

Key Insights
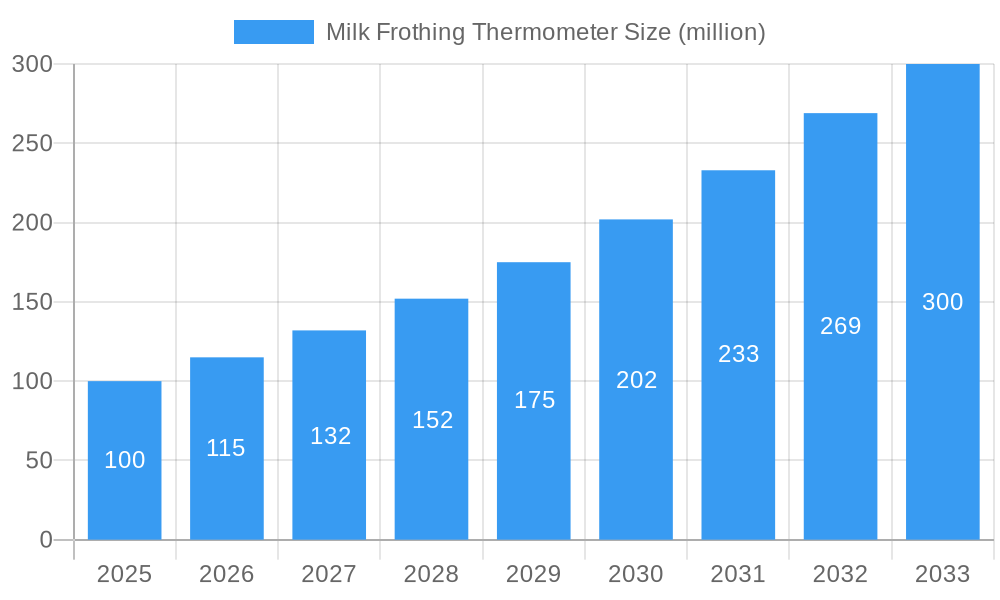
The milk frothing thermometer market is poised for significant expansion, fueled by the rising popularity of specialty coffee and the growing at-home barista culture. With a current market size of $0.15 billion in the base year 2024, the market is projected to achieve a Compound Annual Growth Rate (CAGR) of 7.5%. Key growth drivers include escalating consumer demand for premium coffee beverages, the proliferation of online resources emphasizing precise milk frothing temperature control, and a growing preference for sophisticated at-home coffee experiences. Emerging trends such as the availability of aesthetically appealing, user-friendly thermometer designs, and the integration of smart features are further accelerating market growth. While production costs and potential competition from integrated frothing solutions present challenges, the overall market outlook remains highly favorable. The market is segmented by type (digital and analog), application (home and commercial), and price point, with premium models featuring advanced capabilities commanding higher value. Leading manufacturers, including HIC Harold Import Co., Taylor Precision Products, and OXO, are leveraging brand strength and innovation, while specialized companies like Brewista cater to discerning home baristas seeking exceptional accuracy and performance.
Milk Frothing Thermometer Market Size (In Million)
The competitive environment features a blend of established brands and emerging innovators. Established companies benefit from strong brand recognition and extensive distribution, while new entrants are focusing on product innovation and targeted niche strategies. Growth is particularly robust in North America and Europe, driven by high coffee consumption and disposable income. However, developing markets in Asia and Latin America offer substantial future growth potential as consumer awareness and demand for specialty coffee increase. Continuous product development, focusing on durability, accuracy, and ease of cleaning, alongside strategic marketing campaigns highlighting the critical role of temperature control in achieving perfect milk froth, will be essential for sustaining the market's impressive growth trajectory.
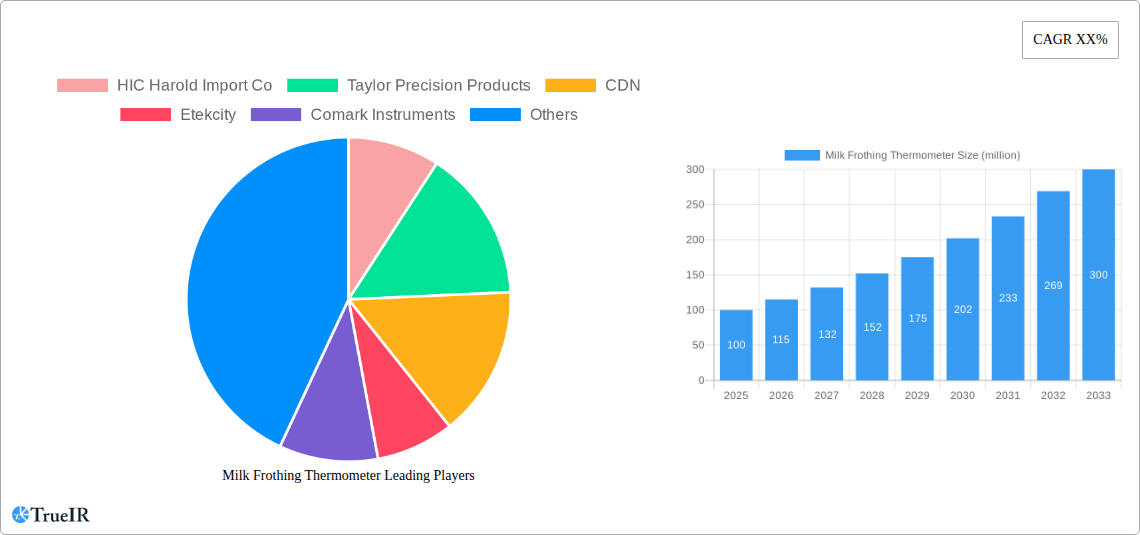
Milk Frothing Thermometer Company Market Share
Milk Frothing Thermometer Market Report: A Comprehensive Analysis (2019-2033)
This dynamic report provides a comprehensive analysis of the global milk frothing thermometer market, projecting a market value exceeding $XX million by 2033. The study covers the period 2019-2033, with 2025 as the base and estimated year. This in-depth analysis unveils market trends, competitive landscapes, growth drivers, and challenges, offering valuable insights for stakeholders across the industry. The report leverages extensive data analysis to forecast market growth and identify lucrative opportunities within the $XX million market.
Milk Frothing Thermometer Market Structure & Competitive Landscape
The milk frothing thermometer market exhibits a moderately fragmented structure, with no single dominant player controlling a significant market share. The estimated concentration ratio (CR4) for 2025 is xx%, indicating a competitive landscape. Innovation plays a vital role, with companies constantly introducing features like improved accuracy, durability, and user-friendly designs. Regulatory impacts, primarily concerning safety and material standards, are relatively mild but influence product development. Substitutes, such as relying on touch or experience, exist but are limited due to the precision and speed offered by thermometers. The market caters to various end-users, including home consumers, professional baristas, and cafes. M&A activity has been relatively low in recent years, with an estimated xx deals recorded between 2019 and 2024. However, increased competition could lead to consolidation in the coming years.
- Market Concentration: CR4 estimated at xx% in 2025.
- Innovation Drivers: Enhanced accuracy, durability, user-friendly designs, and smart features.
- Regulatory Impacts: Mild, focusing on safety and material compliance.
- Product Substitutes: Limited; relying on experience lacks precision and speed.
- End-User Segmentation: Home consumers, professional baristas, cafes, and restaurants.
- M&A Trends: Low activity (xx deals 2019-2024); potential for future consolidation.
Milk Frothing Thermometer Market Trends & Opportunities
The global milk frothing thermometer market is experiencing robust growth, with a projected CAGR of xx% during the forecast period (2025-2033). This growth is fueled by several factors. The rising popularity of specialty coffee and at-home coffee preparation has significantly boosted demand for precision temperature control during milk frothing. Consumers are increasingly seeking high-quality coffee experiences, driving adoption of milk frothing thermometers. Technological advancements, such as digital displays and Bluetooth connectivity, are enhancing product appeal and functionality. Furthermore, the market witnesses rising consumer preferences for convenience and ease of use, leading to demand for simpler, more intuitive devices. The competitive landscape is dynamic, with established players and new entrants vying for market share. The market penetration rate for milk frothing thermometers in households is estimated at xx% in 2025, with significant potential for expansion.
Dominant Markets & Segments in Milk Frothing Thermometer
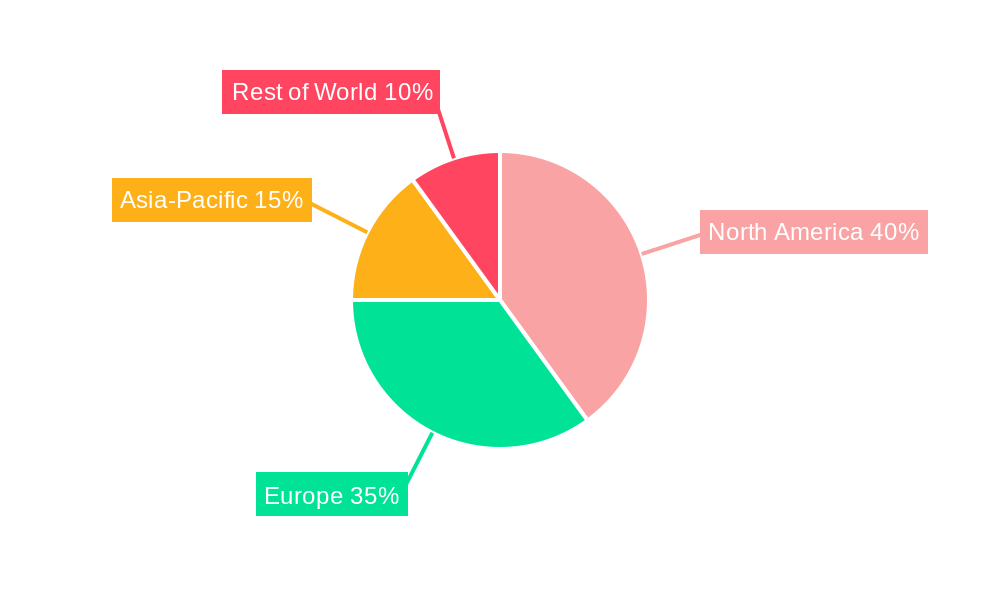
The North American market currently holds the dominant position in the global milk frothing thermometer market, accounting for an estimated xx% of the global market share in 2025. This dominance is driven by several factors:
- High Coffee Consumption: High per capita consumption of specialty coffee fuels demand for premium equipment.
- Strong Disposable Incomes: High disposable incomes facilitate the purchase of premium kitchen appliances.
- Established Retail Infrastructure: Robust retail networks ensure efficient product distribution.
- Early Adoption of Technology: Consumers readily embrace new technologies in kitchen appliances.
Other regions, such as Europe and Asia-Pacific, are also showing significant growth potential, driven by increasing coffee consumption and rising disposable incomes. The home consumer segment constitutes the largest market share, driven by the ease of use and convenience of milk frothing thermometers.
Milk Frothing Thermometer Product Analysis
Milk frothing thermometers are increasingly sophisticated. Beyond basic temperature readings, many now offer digital displays, timers, and even Bluetooth connectivity for smart device integration. This integration facilitates precise temperature control and streamlined workflows. The competitive advantage lies in features like rapid response times, accurate readings, and durable construction. These features cater to both casual home users and professional baristas seeking precision and efficiency. Technological advancements continue to shape the market, with manufacturers focusing on improving accuracy, ease of use, and overall design aesthetics.
Key Drivers, Barriers & Challenges in Milk Frothing Thermometer
Key Drivers: The rising popularity of specialty coffee, increased consumer spending on kitchen appliances, technological advancements leading to enhanced product features, and government initiatives promoting food safety standards.
Key Challenges: Intense competition among manufacturers, potential supply chain disruptions, and fluctuations in raw material costs. The impact of these challenges can be significant, potentially affecting market growth by approximately xx% annually.
Growth Drivers in the Milk Frothing Thermometer Market
The continued growth in the milk frothing thermometer market is driven by several key factors, including the increasing demand for specialty coffee and at-home barista experiences. Technological advancements, such as the development of more accurate and user-friendly thermometers, are also contributing to market growth. Additionally, rising consumer disposable incomes and a growing awareness of the importance of food safety are positively impacting market expansion.
Challenges Impacting Milk Frothing Thermometer Growth
Challenges facing the milk frothing thermometer market include intense competition, price sensitivity among consumers, and potential supply chain disruptions caused by global economic conditions. Regulatory hurdles and changes in consumer preferences also pose risks to market growth.
Key Players Shaping the Milk Frothing Thermometer Market
- HIC Harold Import Co
- Taylor Precision Products
- CDN
- Etekcity
- Comark Instruments
- BonJour
- OXO
- Brewista
- Rattleware
- Dreamfarm
- Espro
Significant Milk Frothing Thermometer Industry Milestones
- 2020: Introduction of the first Bluetooth-enabled milk frothing thermometer by Brewista.
- 2022: Taylor Precision Products launches a line of eco-friendly milk frothing thermometers.
- 2023: HIC Harold Import Co. expands its product line with a new, budget-friendly option.
Future Outlook for Milk Frothing Thermometer Market
The milk frothing thermometer market is poised for continued growth, driven by ongoing innovation, rising consumer demand for quality coffee, and expansion into new markets. Strategic partnerships and investments in research and development will be crucial for success. The market presents significant opportunities for manufacturers who can effectively adapt to evolving consumer preferences and technological advancements. The forecast indicates a promising future, with potential for substantial market expansion in the coming years.
Milk Frothing Thermometer Segmentation
-
1. Application
- 1.1. Home Kitchen
- 1.2. Commercial Kitchens
- 1.3. Other
-
2. Types
- 2.1. Analog
- 2.2. Digital
- 2.3. Others
Milk Frothing Thermometer Segmentation By Geography
-
1. North America
- 1.1. United States
- 1.2. Canada
- 1.3. Mexico
-
2. South America
- 2.1. Brazil
- 2.2. Argentina
- 2.3. Rest of South America
-
3. Europe
- 3.1. United Kingdom
- 3.2. Germany
- 3.3. France
- 3.4. Italy
- 3.5. Spain
- 3.6. Russia
- 3.7. Benelux
- 3.8. Nordics
- 3.9. Rest of Europe
-
4. Middle East & Africa
- 4.1. Turkey
- 4.2. Israel
- 4.3. GCC
- 4.4. North Africa
- 4.5. South Africa
- 4.6. Rest of Middle East & Africa
-
5. Asia Pacific
- 5.1. China
- 5.2. India
- 5.3. Japan
- 5.4. South Korea
- 5.5. ASEAN
- 5.6. Oceania
- 5.7. Rest of Asia Pacific
Milk Frothing Thermometer Regional Market Share
Geographic Coverage of Milk Frothing Thermometer
Milk Frothing Thermometer REPORT HIGHLIGHTS
| Aspects | Details |
|---|---|
| Study Period | 2020-2034 |
| Base Year | 2025 |
| Estimated Year | 2026 |
| Forecast Period | 2026-2034 |
| Historical Period | 2020-2025 |
| Growth Rate | CAGR of 7.5% from 2020-2034 |
| Segmentation |
|
Table of Contents
- 1. Introduction
- 1.1. Research Scope
- 1.2. Market Segmentation
- 1.3. Research Objective
- 1.4. Definitions and Assumptions
- 2. Executive Summary
- 2.1. Market Snapshot
- 3. Market Dynamics
- 3.1. Market Drivers
- 3.2. Market Restrains
- 3.3. Market Trends
- 3.4. Market Opportunities
- 4. Market Factor Analysis
- 4.1. Porters Five Forces
- 4.1.1. Bargaining Power of Suppliers
- 4.1.2. Bargaining Power of Buyers
- 4.1.3. Threat of New Entrants
- 4.1.4. Threat of Substitutes
- 4.1.5. Competitive Rivalry
- 4.2. PESTEL analysis
- 4.3. BCG Analysis
- 4.3.1. Stars (High Growth, High Market Share)
- 4.3.2. Cash Cows (Low Growth, High Market Share)
- 4.3.3. Question Mark (High Growth, Low Market Share)
- 4.3.4. Dogs (Low Growth, Low Market Share)
- 4.4. Ansoff Matrix Analysis
- 4.5. Supply Chain Analysis
- 4.6. Regulatory Landscape
- 4.7. Current Market Potential and Opportunity Assessment (TAM–SAM–SOM Framework)
- 4.8. TIR Analyst Note
- 4.1. Porters Five Forces
- 5. Market Analysis, Insights and Forecast 2021-2033
- 5.1. Market Analysis, Insights and Forecast - by Application
- 5.1.1. Home Kitchen
- 5.1.2. Commercial Kitchens
- 5.1.3. Other
- 5.2. Market Analysis, Insights and Forecast - by Types
- 5.2.1. Analog
- 5.2.2. Digital
- 5.2.3. Others
- 5.3. Market Analysis, Insights and Forecast - by Region
- 5.3.1. North America
- 5.3.2. South America
- 5.3.3. Europe
- 5.3.4. Middle East & Africa
- 5.3.5. Asia Pacific
- 5.1. Market Analysis, Insights and Forecast - by Application
- 6. Global Milk Frothing Thermometer Analysis, Insights and Forecast, 2021-2033
- 6.1. Market Analysis, Insights and Forecast - by Application
- 6.1.1. Home Kitchen
- 6.1.2. Commercial Kitchens
- 6.1.3. Other
- 6.2. Market Analysis, Insights and Forecast - by Types
- 6.2.1. Analog
- 6.2.2. Digital
- 6.2.3. Others
- 6.1. Market Analysis, Insights and Forecast - by Application
- 7. North America Milk Frothing Thermometer Analysis, Insights and Forecast, 2020-2032
- 7.1. Market Analysis, Insights and Forecast - by Application
- 7.1.1. Home Kitchen
- 7.1.2. Commercial Kitchens
- 7.1.3. Other
- 7.2. Market Analysis, Insights and Forecast - by Types
- 7.2.1. Analog
- 7.2.2. Digital
- 7.2.3. Others
- 7.1. Market Analysis, Insights and Forecast - by Application
- 8. South America Milk Frothing Thermometer Analysis, Insights and Forecast, 2020-2032
- 8.1. Market Analysis, Insights and Forecast - by Application
- 8.1.1. Home Kitchen
- 8.1.2. Commercial Kitchens
- 8.1.3. Other
- 8.2. Market Analysis, Insights and Forecast - by Types
- 8.2.1. Analog
- 8.2.2. Digital
- 8.2.3. Others
- 8.1. Market Analysis, Insights and Forecast - by Application
- 9. Europe Milk Frothing Thermometer Analysis, Insights and Forecast, 2020-2032
- 9.1. Market Analysis, Insights and Forecast - by Application
- 9.1.1. Home Kitchen
- 9.1.2. Commercial Kitchens
- 9.1.3. Other
- 9.2. Market Analysis, Insights and Forecast - by Types
- 9.2.1. Analog
- 9.2.2. Digital
- 9.2.3. Others
- 9.1. Market Analysis, Insights and Forecast - by Application
- 10. Middle East & Africa Milk Frothing Thermometer Analysis, Insights and Forecast, 2020-2032
- 10.1. Market Analysis, Insights and Forecast - by Application
- 10.1.1. Home Kitchen
- 10.1.2. Commercial Kitchens
- 10.1.3. Other
- 10.2. Market Analysis, Insights and Forecast - by Types
- 10.2.1. Analog
- 10.2.2. Digital
- 10.2.3. Others
- 10.1. Market Analysis, Insights and Forecast - by Application
- 11. Asia Pacific Milk Frothing Thermometer Analysis, Insights and Forecast, 2020-2032
- 11.1. Market Analysis, Insights and Forecast - by Application
- 11.1.1. Home Kitchen
- 11.1.2. Commercial Kitchens
- 11.1.3. Other
- 11.2. Market Analysis, Insights and Forecast - by Types
- 11.2.1. Analog
- 11.2.2. Digital
- 11.2.3. Others
- 11.1. Market Analysis, Insights and Forecast - by Application
- 12. Competitive Analysis
- 12.1. Company Profiles
- 12.1.1 HIC Harold Import Co
- 12.1.1.1. Company Overview
- 12.1.1.2. Products
- 12.1.1.3. Company Financials
- 12.1.1.4. SWOT Analysis
- 12.1.2 Taylor Precision Products
- 12.1.2.1. Company Overview
- 12.1.2.2. Products
- 12.1.2.3. Company Financials
- 12.1.2.4. SWOT Analysis
- 12.1.3 CDN
- 12.1.3.1. Company Overview
- 12.1.3.2. Products
- 12.1.3.3. Company Financials
- 12.1.3.4. SWOT Analysis
- 12.1.4 Etekcity
- 12.1.4.1. Company Overview
- 12.1.4.2. Products
- 12.1.4.3. Company Financials
- 12.1.4.4. SWOT Analysis
- 12.1.5 Comark Instruments
- 12.1.5.1. Company Overview
- 12.1.5.2. Products
- 12.1.5.3. Company Financials
- 12.1.5.4. SWOT Analysis
- 12.1.6 BonJour
- 12.1.6.1. Company Overview
- 12.1.6.2. Products
- 12.1.6.3. Company Financials
- 12.1.6.4. SWOT Analysis
- 12.1.7 OXO
- 12.1.7.1. Company Overview
- 12.1.7.2. Products
- 12.1.7.3. Company Financials
- 12.1.7.4. SWOT Analysis
- 12.1.8 Brewista
- 12.1.8.1. Company Overview
- 12.1.8.2. Products
- 12.1.8.3. Company Financials
- 12.1.8.4. SWOT Analysis
- 12.1.9 Rattleware
- 12.1.9.1. Company Overview
- 12.1.9.2. Products
- 12.1.9.3. Company Financials
- 12.1.9.4. SWOT Analysis
- 12.1.10 Dreamfarm
- 12.1.10.1. Company Overview
- 12.1.10.2. Products
- 12.1.10.3. Company Financials
- 12.1.10.4. SWOT Analysis
- 12.1.11 Espro
- 12.1.11.1. Company Overview
- 12.1.11.2. Products
- 12.1.11.3. Company Financials
- 12.1.11.4. SWOT Analysis
- 12.1.1 HIC Harold Import Co
- 12.2. Market Entropy
- 12.2.1 Company's Key Areas Served
- 12.2.2 Recent Developments
- 12.3. Company Market Share Analysis 2025
- 12.3.1 Top 5 Companies Market Share Analysis
- 12.3.2 Top 3 Companies Market Share Analysis
- 12.4. List of Potential Customers
- 13. Research Methodology
List of Figures
- Figure 1: Global Milk Frothing Thermometer Revenue Breakdown (billion, %) by Region 2025 & 2033
- Figure 2: North America Milk Frothing Thermometer Revenue (billion), by Application 2025 & 2033
- Figure 3: North America Milk Frothing Thermometer Revenue Share (%), by Application 2025 & 2033
- Figure 4: North America Milk Frothing Thermometer Revenue (billion), by Types 2025 & 2033
- Figure 5: North America Milk Frothing Thermometer Revenue Share (%), by Types 2025 & 2033
- Figure 6: North America Milk Frothing Thermometer Revenue (billion), by Country 2025 & 2033
- Figure 7: North America Milk Frothing Thermometer Revenue Share (%), by Country 2025 & 2033
- Figure 8: South America Milk Frothing Thermometer Revenue (billion), by Application 2025 & 2033
- Figure 9: South America Milk Frothing Thermometer Revenue Share (%), by Application 2025 & 2033
- Figure 10: South America Milk Frothing Thermometer Revenue (billion), by Types 2025 & 2033
- Figure 11: South America Milk Frothing Thermometer Revenue Share (%), by Types 2025 & 2033
- Figure 12: South America Milk Frothing Thermometer Revenue (billion), by Country 2025 & 2033
- Figure 13: South America Milk Frothing Thermometer Revenue Share (%), by Country 2025 & 2033
- Figure 14: Europe Milk Frothing Thermometer Revenue (billion), by Application 2025 & 2033
- Figure 15: Europe Milk Frothing Thermometer Revenue Share (%), by Application 2025 & 2033
- Figure 16: Europe Milk Frothing Thermometer Revenue (billion), by Types 2025 & 2033
- Figure 17: Europe Milk Frothing Thermometer Revenue Share (%), by Types 2025 & 2033
- Figure 18: Europe Milk Frothing Thermometer Revenue (billion), by Country 2025 & 2033
- Figure 19: Europe Milk Frothing Thermometer Revenue Share (%), by Country 2025 & 2033
- Figure 20: Middle East & Africa Milk Frothing Thermometer Revenue (billion), by Application 2025 & 2033
- Figure 21: Middle East & Africa Milk Frothing Thermometer Revenue Share (%), by Application 2025 & 2033
- Figure 22: Middle East & Africa Milk Frothing Thermometer Revenue (billion), by Types 2025 & 2033
- Figure 23: Middle East & Africa Milk Frothing Thermometer Revenue Share (%), by Types 2025 & 2033
- Figure 24: Middle East & Africa Milk Frothing Thermometer Revenue (billion), by Country 2025 & 2033
- Figure 25: Middle East & Africa Milk Frothing Thermometer Revenue Share (%), by Country 2025 & 2033
- Figure 26: Asia Pacific Milk Frothing Thermometer Revenue (billion), by Application 2025 & 2033
- Figure 27: Asia Pacific Milk Frothing Thermometer Revenue Share (%), by Application 2025 & 2033
- Figure 28: Asia Pacific Milk Frothing Thermometer Revenue (billion), by Types 2025 & 2033
- Figure 29: Asia Pacific Milk Frothing Thermometer Revenue Share (%), by Types 2025 & 2033
- Figure 30: Asia Pacific Milk Frothing Thermometer Revenue (billion), by Country 2025 & 2033
- Figure 31: Asia Pacific Milk Frothing Thermometer Revenue Share (%), by Country 2025 & 2033
List of Tables
- Table 1: Global Milk Frothing Thermometer Revenue billion Forecast, by Application 2020 & 2033
- Table 2: Global Milk Frothing Thermometer Revenue billion Forecast, by Types 2020 & 2033
- Table 3: Global Milk Frothing Thermometer Revenue billion Forecast, by Region 2020 & 2033
- Table 4: Global Milk Frothing Thermometer Revenue billion Forecast, by Application 2020 & 2033
- Table 5: Global Milk Frothing Thermometer Revenue billion Forecast, by Types 2020 & 2033
- Table 6: Global Milk Frothing Thermometer Revenue billion Forecast, by Country 2020 & 2033
- Table 7: United States Milk Frothing Thermometer Revenue (billion) Forecast, by Application 2020 & 2033
- Table 8: Canada Milk Frothing Thermometer Revenue (billion) Forecast, by Application 2020 & 2033
- Table 9: Mexico Milk Frothing Thermometer Revenue (billion) Forecast, by Application 2020 & 2033
- Table 10: Global Milk Frothing Thermometer Revenue billion Forecast, by Application 2020 & 2033
- Table 11: Global Milk Frothing Thermometer Revenue billion Forecast, by Types 2020 & 2033
- Table 12: Global Milk Frothing Thermometer Revenue billion Forecast, by Country 2020 & 2033
- Table 13: Brazil Milk Frothing Thermometer Revenue (billion) Forecast, by Application 2020 & 2033
- Table 14: Argentina Milk Frothing Thermometer Revenue (billion) Forecast, by Application 2020 & 2033
- Table 15: Rest of South America Milk Frothing Thermometer Revenue (billion) Forecast, by Application 2020 & 2033
- Table 16: Global Milk Frothing Thermometer Revenue billion Forecast, by Application 2020 & 2033
- Table 17: Global Milk Frothing Thermometer Revenue billion Forecast, by Types 2020 & 2033
- Table 18: Global Milk Frothing Thermometer Revenue billion Forecast, by Country 2020 & 2033
- Table 19: United Kingdom Milk Frothing Thermometer Revenue (billion) Forecast, by Application 2020 & 2033
- Table 20: Germany Milk Frothing Thermometer Revenue (billion) Forecast, by Application 2020 & 2033
- Table 21: France Milk Frothing Thermometer Revenue (billion) Forecast, by Application 2020 & 2033
- Table 22: Italy Milk Frothing Thermometer Revenue (billion) Forecast, by Application 2020 & 2033
- Table 23: Spain Milk Frothing Thermometer Revenue (billion) Forecast, by Application 2020 & 2033
- Table 24: Russia Milk Frothing Thermometer Revenue (billion) Forecast, by Application 2020 & 2033
- Table 25: Benelux Milk Frothing Thermometer Revenue (billion) Forecast, by Application 2020 & 2033
- Table 26: Nordics Milk Frothing Thermometer Revenue (billion) Forecast, by Application 2020 & 2033
- Table 27: Rest of Europe Milk Frothing Thermometer Revenue (billion) Forecast, by Application 2020 & 2033
- Table 28: Global Milk Frothing Thermometer Revenue billion Forecast, by Application 2020 & 2033
- Table 29: Global Milk Frothing Thermometer Revenue billion Forecast, by Types 2020 & 2033
- Table 30: Global Milk Frothing Thermometer Revenue billion Forecast, by Country 2020 & 2033
- Table 31: Turkey Milk Frothing Thermometer Revenue (billion) Forecast, by Application 2020 & 2033
- Table 32: Israel Milk Frothing Thermometer Revenue (billion) Forecast, by Application 2020 & 2033
- Table 33: GCC Milk Frothing Thermometer Revenue (billion) Forecast, by Application 2020 & 2033
- Table 34: North Africa Milk Frothing Thermometer Revenue (billion) Forecast, by Application 2020 & 2033
- Table 35: South Africa Milk Frothing Thermometer Revenue (billion) Forecast, by Application 2020 & 2033
- Table 36: Rest of Middle East & Africa Milk Frothing Thermometer Revenue (billion) Forecast, by Application 2020 & 2033
- Table 37: Global Milk Frothing Thermometer Revenue billion Forecast, by Application 2020 & 2033
- Table 38: Global Milk Frothing Thermometer Revenue billion Forecast, by Types 2020 & 2033
- Table 39: Global Milk Frothing Thermometer Revenue billion Forecast, by Country 2020 & 2033
- Table 40: China Milk Frothing Thermometer Revenue (billion) Forecast, by Application 2020 & 2033
- Table 41: India Milk Frothing Thermometer Revenue (billion) Forecast, by Application 2020 & 2033
- Table 42: Japan Milk Frothing Thermometer Revenue (billion) Forecast, by Application 2020 & 2033
- Table 43: South Korea Milk Frothing Thermometer Revenue (billion) Forecast, by Application 2020 & 2033
- Table 44: ASEAN Milk Frothing Thermometer Revenue (billion) Forecast, by Application 2020 & 2033
- Table 45: Oceania Milk Frothing Thermometer Revenue (billion) Forecast, by Application 2020 & 2033
- Table 46: Rest of Asia Pacific Milk Frothing Thermometer Revenue (billion) Forecast, by Application 2020 & 2033
Frequently Asked Questions
1. What is the projected Compound Annual Growth Rate (CAGR) of the Milk Frothing Thermometer?
The projected CAGR is approximately 7.5%.
2. Which companies are prominent players in the Milk Frothing Thermometer?
Key companies in the market include HIC Harold Import Co, Taylor Precision Products, CDN, Etekcity, Comark Instruments, BonJour, OXO, Brewista, Rattleware, Dreamfarm, Espro.
3. What are the main segments of the Milk Frothing Thermometer?
The market segments include Application, Types.
4. Can you provide details about the market size?
The market size is estimated to be USD 0.15 billion as of 2022.
5. What are some drivers contributing to market growth?
N/A
6. What are the notable trends driving market growth?
N/A
7. Are there any restraints impacting market growth?
N/A
8. Can you provide examples of recent developments in the market?
N/A
9. What pricing options are available for accessing the report?
Pricing options include single-user, multi-user, and enterprise licenses priced at USD 2900.00, USD 4350.00, and USD 5800.00 respectively.
10. Is the market size provided in terms of value or volume?
The market size is provided in terms of value, measured in billion.
11. Are there any specific market keywords associated with the report?
Yes, the market keyword associated with the report is "Milk Frothing Thermometer," which aids in identifying and referencing the specific market segment covered.
12. How do I determine which pricing option suits my needs best?
The pricing options vary based on user requirements and access needs. Individual users may opt for single-user licenses, while businesses requiring broader access may choose multi-user or enterprise licenses for cost-effective access to the report.
13. Are there any additional resources or data provided in the Milk Frothing Thermometer report?
While the report offers comprehensive insights, it's advisable to review the specific contents or supplementary materials provided to ascertain if additional resources or data are available.
14. How can I stay updated on further developments or reports in the Milk Frothing Thermometer?
To stay informed about further developments, trends, and reports in the Milk Frothing Thermometer, consider subscribing to industry newsletters, following relevant companies and organizations, or regularly checking reputable industry news sources and publications.
Methodology
Step 1 - Identification of Relevant Samples Size from Population Database


Step 2 - Approaches for Defining Global Market Size (Value, Volume* & Price*)

Note*: In applicable scenarios
Step 3 - Data Sources
Primary Research
- Web Analytics
- Survey Reports
- Research Institute
- Latest Research Reports
- Opinion Leaders
Secondary Research
- Annual Reports
- White Paper
- Latest Press Release
- Industry Association
- Paid Database
- Investor Presentations

Step 4 - Data Triangulation
Involves using different sources of information in order to increase the validity of a study
These sources are likely to be stakeholders in a program - participants, other researchers, program staff, other community members, and so on.
Then we put all data in single framework & apply various statistical tools to find out the dynamic on the market.
During the analysis stage, feedback from the stakeholder groups would be compared to determine areas of agreement as well as areas of divergence