

Key Insights
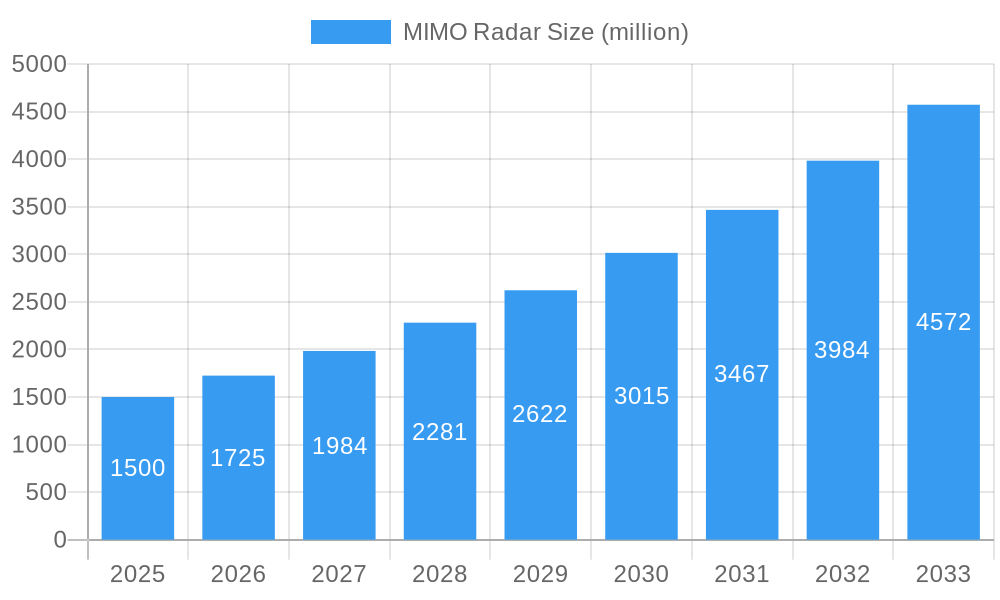
The MIMO (Multiple-Input and Multiple-Output) radar market is experiencing substantial expansion, propelled by the growing adoption of Advanced Driver-Assistance Systems (ADAS) and autonomous vehicles. Key drivers include the imperative for superior object detection and classification in adverse conditions, the increasing integration of high-resolution imaging radar for enhanced safety, and ongoing advancements in MIMO radar technology's miniaturization and cost-effectiveness. The market is projected to reach $9.02 billion by 2025, with a Compound Annual Growth Rate (CAGR) of 11.28% from 2025 to 2033, forecasting a market valuation of over $21.37 billion by 2033. Significant investments by automotive OEMs and Tier-1 suppliers in sophisticated radar system development and integration underscore this growth. Leading innovators such as Continental AG, ZF Friedrichshafen AG, and Aptiv are actively enhancing MIMO radar performance, reliability, and affordability.
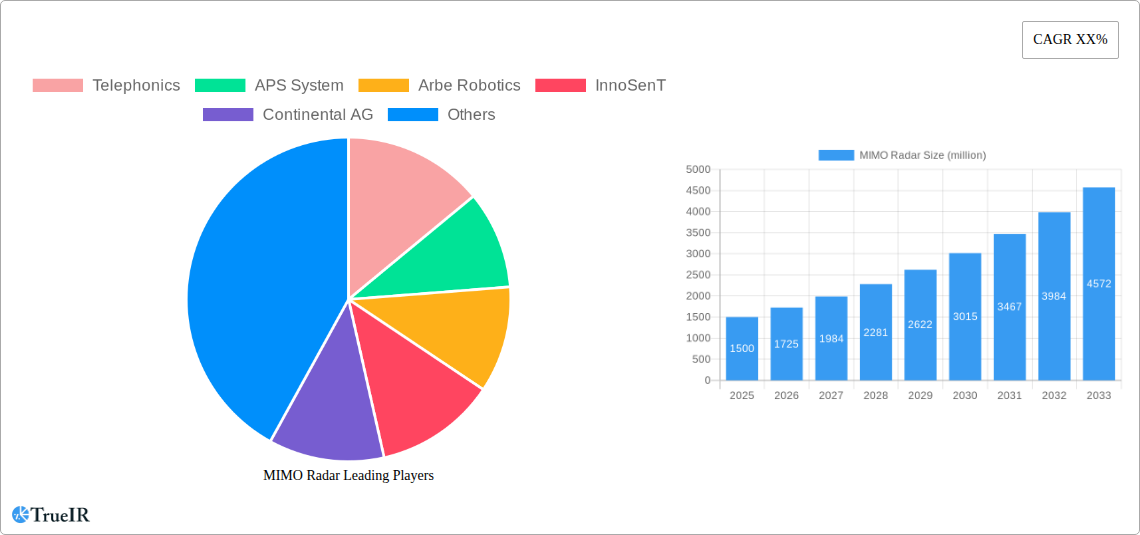
MIMO Radar Market Size (In Billion)
Despite positive growth trajectories, market restraints persist. High initial capital expenditure for manufacturing and integration poses a challenge to widespread adoption, particularly for smaller enterprises. Furthermore, complexities in data processing and algorithm development for precise object recognition require ongoing innovation. Nevertheless, the outlook remains exceptionally favorable, with the escalating sophistication of ADAS and autonomous driving functionalities directly fueling demand for advanced MIMO radar systems. Market segmentation is expected to diversify across automotive and industrial applications, as well as various radar frequencies including 77 GHz and 79 GHz, catering to diverse industry requirements.
MIMO Radar Company Market Share
Dynamic MIMO Radar Market Report: 2019-2033
This comprehensive report provides an in-depth analysis of the global MIMO Radar market, projecting robust growth and significant market expansion from $XX million in 2025 to $XX million by 2033, exhibiting a Compound Annual Growth Rate (CAGR) of XX%. The report covers the period 2019-2033, with a focus on the forecast period 2025-2033 and a base year of 2025. It offers critical insights for stakeholders, including manufacturers, investors, and industry analysts, seeking to navigate this rapidly evolving technological landscape.
MIMO Radar Market Structure & Competitive Landscape
The MIMO Radar market is characterized by a moderately concentrated landscape with several key players vying for market share. The Herfindahl-Hirschman Index (HHI) is estimated at XX in 2025, indicating a relatively competitive environment. However, ongoing mergers and acquisitions (M&A) activity, totaling approximately $XX million in the historical period (2019-2024), suggests a trend toward consolidation. Innovation, driven by advancements in signal processing and antenna technology, is a key competitive differentiator. Regulatory frameworks concerning spectrum allocation and safety standards also play a significant role. Product substitution, primarily from other advanced radar technologies, is a factor to consider, though MIMO’s unique capabilities continue to offer a competitive advantage. End-user segmentation is diverse, encompassing automotive, aerospace, defense, and industrial sectors.
- Market Concentration: Moderately concentrated, with an estimated HHI of XX in 2025.
- Innovation Drivers: Advancements in signal processing, antenna technology, and AI integration.
- Regulatory Impacts: Spectrum allocation policies and safety standards significantly influence market growth.
- Product Substitutes: Competition from other advanced radar systems, but MIMO's capabilities maintain its edge.
- End-User Segmentation: Automotive, aerospace, defense, and industrial sectors are key end-users.
- M&A Trends: Significant M&A activity, totaling approximately $XX million during 2019-2024, indicates consolidation.
MIMO Radar Market Trends & Opportunities
The global MIMO Radar market is experiencing substantial growth, driven by increasing demand across multiple sectors. The automotive industry is a primary growth driver, fueled by the need for advanced driver-assistance systems (ADAS) and autonomous driving capabilities. Technological advancements, such as the integration of artificial intelligence (AI) and machine learning (ML) algorithms, are enhancing MIMO radar's performance and expanding its applications. Consumer preferences for enhanced safety and convenience are further bolstering market growth. Competitive dynamics are intense, with companies focusing on innovation, cost reduction, and strategic partnerships to gain a competitive edge. Market penetration rates are steadily increasing, particularly in the automotive sector. The market is expected to reach $XX million by 2033, driven by technological advancements and increasing adoption.
Dominant Markets & Segments in MIMO Radar
The automotive sector currently dominates the MIMO Radar market, accounting for approximately XX% of the total market revenue in 2025. North America and Europe are currently leading regional markets, with significant growth potential in Asia-Pacific.
- Key Growth Drivers (Automotive Sector):
- Stringent safety regulations and increasing demand for ADAS features.
- Growing adoption of autonomous driving technologies.
- Rising consumer demand for enhanced vehicle safety and comfort.
- Key Growth Drivers (North America & Europe):
- Early adoption of advanced automotive technologies.
- Well-established automotive manufacturing base.
- Strong government support for research and development.
MIMO Radar Product Analysis
MIMO radar technology offers significant advantages over traditional radar systems, including enhanced target detection, improved resolution, and reduced clutter. Recent product innovations include the integration of AI and ML algorithms for improved signal processing and object recognition. This leads to superior performance in challenging environmental conditions and an enhanced ability to support the rising demand for more sophisticated autonomous driving features. Various MIMO radar configurations and system integrations cater to diverse applications across various sectors. Competitive advantages are primarily derived from superior performance, cost-effectiveness, and ease of integration into existing systems.
Key Drivers, Barriers & Challenges in MIMO Radar
Key Drivers:
Technological advancements in signal processing, antenna technology, and AI integration are key drivers. Growing demand for advanced driver-assistance systems (ADAS) and autonomous driving is fuelling market growth, and governmental regulations aimed at improving road safety further accelerate adoption. The increasing need for enhanced surveillance and security applications in various industries also contributes significantly.
Challenges:
High initial costs for development and implementation represent a key barrier. Complex regulatory landscapes concerning spectrum allocation and safety standards can create obstacles. Supply chain disruptions can impact production volumes and increase costs. Intense competition among established players and new entrants adds another level of challenge.
Growth Drivers in the MIMO Radar Market
Technological advancements like AI integration, miniaturization, and improved signal processing capabilities are significant drivers. The increasing demand for ADAS and autonomous vehicles is a key factor. Stringent safety regulations worldwide push for better radar systems. Growing investments in research and development further accelerate market growth.
Challenges Impacting MIMO Radar Growth
High manufacturing and development costs hinder widespread adoption, especially in price-sensitive sectors. Complex regulatory approvals and standardization efforts slow down market penetration. Competition from other sensing technologies also restricts market expansion. Supply chain vulnerabilities impact production stability and overall costs.
Key Players Shaping the MIMO Radar Market
- Telephonics
- APS System
- Arbe Robotics
- InnoSenT
- Continental AG
- Smart Radar System
- Aptiv
- Smartmicro
- ZF Friedrichshafen AG
- Rohde & Schwarz
Significant MIMO Radar Industry Milestones
- 2020: Introduction of the first commercially available high-resolution automotive MIMO radar system by Company X.
- 2022: Strategic partnership between Company Y and Company Z to develop next-generation MIMO radar technology for autonomous vehicles.
- 2023: Successful field testing of a new MIMO radar system for enhanced object detection in challenging environments by Company A.
Future Outlook for MIMO Radar Market
The MIMO radar market is poised for significant expansion, driven by continuous technological innovation, increasing demand from various sectors, and supportive government policies. Strategic collaborations and mergers and acquisitions will shape market consolidation. New applications in areas such as robotics and smart infrastructure will provide further growth opportunities. The market is expected to witness a robust CAGR, reaching $XX million by 2033, representing considerable growth potential for stakeholders involved.
MIMO Radar Segmentation
-
1. Application
- 1.1. Car Assisted Driving
- 1.2. Robot
- 1.3. Remote Sensing and Detection
- 1.4. Military
- 1.5. Other
-
2. Types
- 2.1. Colocated Antennas MIMO Radar
- 2.2. Widely Separated Antennas MIMO Radar
- 2.3. Other
MIMO Radar Segmentation By Geography
-
1. North America
- 1.1. United States
- 1.2. Canada
- 1.3. Mexico
-
2. South America
- 2.1. Brazil
- 2.2. Argentina
- 2.3. Rest of South America
-
3. Europe
- 3.1. United Kingdom
- 3.2. Germany
- 3.3. France
- 3.4. Italy
- 3.5. Spain
- 3.6. Russia
- 3.7. Benelux
- 3.8. Nordics
- 3.9. Rest of Europe
-
4. Middle East & Africa
- 4.1. Turkey
- 4.2. Israel
- 4.3. GCC
- 4.4. North Africa
- 4.5. South Africa
- 4.6. Rest of Middle East & Africa
-
5. Asia Pacific
- 5.1. China
- 5.2. India
- 5.3. Japan
- 5.4. South Korea
- 5.5. ASEAN
- 5.6. Oceania
- 5.7. Rest of Asia Pacific

MIMO Radar Regional Market Share
Geographic Coverage of MIMO Radar
MIMO Radar REPORT HIGHLIGHTS
| Aspects | Details |
|---|---|
| Study Period | 2020-2034 |
| Base Year | 2025 |
| Estimated Year | 2026 |
| Forecast Period | 2026-2034 |
| Historical Period | 2020-2025 |
| Growth Rate | CAGR of 11.28% from 2020-2034 |
| Segmentation |
|
Table of Contents
- 1. Introduction
- 1.1. Research Scope
- 1.2. Market Segmentation
- 1.3. Research Objective
- 1.4. Definitions and Assumptions
- 2. Executive Summary
- 2.1. Market Snapshot
- 3. Market Dynamics
- 3.1. Market Drivers
- 3.2. Market Restrains
- 3.3. Market Trends
- 3.4. Market Opportunities
- 4. Market Factor Analysis
- 4.1. Porters Five Forces
- 4.1.1. Bargaining Power of Suppliers
- 4.1.2. Bargaining Power of Buyers
- 4.1.3. Threat of New Entrants
- 4.1.4. Threat of Substitutes
- 4.1.5. Competitive Rivalry
- 4.2. PESTEL analysis
- 4.3. BCG Analysis
- 4.3.1. Stars (High Growth, High Market Share)
- 4.3.2. Cash Cows (Low Growth, High Market Share)
- 4.3.3. Question Mark (High Growth, Low Market Share)
- 4.3.4. Dogs (Low Growth, Low Market Share)
- 4.4. Ansoff Matrix Analysis
- 4.5. Supply Chain Analysis
- 4.6. Regulatory Landscape
- 4.7. Current Market Potential and Opportunity Assessment (TAM–SAM–SOM Framework)
- 4.8. TIR Analyst Note
- 4.1. Porters Five Forces
- 5. Market Analysis, Insights and Forecast 2021-2033
- 5.1. Market Analysis, Insights and Forecast - by Application
- 5.1.1. Car Assisted Driving
- 5.1.2. Robot
- 5.1.3. Remote Sensing and Detection
- 5.1.4. Military
- 5.1.5. Other
- 5.2. Market Analysis, Insights and Forecast - by Types
- 5.2.1. Colocated Antennas MIMO Radar
- 5.2.2. Widely Separated Antennas MIMO Radar
- 5.2.3. Other
- 5.3. Market Analysis, Insights and Forecast - by Region
- 5.3.1. North America
- 5.3.2. South America
- 5.3.3. Europe
- 5.3.4. Middle East & Africa
- 5.3.5. Asia Pacific
- 5.1. Market Analysis, Insights and Forecast - by Application
- 6. Global MIMO Radar Analysis, Insights and Forecast, 2021-2033
- 6.1. Market Analysis, Insights and Forecast - by Application
- 6.1.1. Car Assisted Driving
- 6.1.2. Robot
- 6.1.3. Remote Sensing and Detection
- 6.1.4. Military
- 6.1.5. Other
- 6.2. Market Analysis, Insights and Forecast - by Types
- 6.2.1. Colocated Antennas MIMO Radar
- 6.2.2. Widely Separated Antennas MIMO Radar
- 6.2.3. Other
- 6.1. Market Analysis, Insights and Forecast - by Application
- 7. North America MIMO Radar Analysis, Insights and Forecast, 2020-2032
- 7.1. Market Analysis, Insights and Forecast - by Application
- 7.1.1. Car Assisted Driving
- 7.1.2. Robot
- 7.1.3. Remote Sensing and Detection
- 7.1.4. Military
- 7.1.5. Other
- 7.2. Market Analysis, Insights and Forecast - by Types
- 7.2.1. Colocated Antennas MIMO Radar
- 7.2.2. Widely Separated Antennas MIMO Radar
- 7.2.3. Other
- 7.1. Market Analysis, Insights and Forecast - by Application
- 8. South America MIMO Radar Analysis, Insights and Forecast, 2020-2032
- 8.1. Market Analysis, Insights and Forecast - by Application
- 8.1.1. Car Assisted Driving
- 8.1.2. Robot
- 8.1.3. Remote Sensing and Detection
- 8.1.4. Military
- 8.1.5. Other
- 8.2. Market Analysis, Insights and Forecast - by Types
- 8.2.1. Colocated Antennas MIMO Radar
- 8.2.2. Widely Separated Antennas MIMO Radar
- 8.2.3. Other
- 8.1. Market Analysis, Insights and Forecast - by Application
- 9. Europe MIMO Radar Analysis, Insights and Forecast, 2020-2032
- 9.1. Market Analysis, Insights and Forecast - by Application
- 9.1.1. Car Assisted Driving
- 9.1.2. Robot
- 9.1.3. Remote Sensing and Detection
- 9.1.4. Military
- 9.1.5. Other
- 9.2. Market Analysis, Insights and Forecast - by Types
- 9.2.1. Colocated Antennas MIMO Radar
- 9.2.2. Widely Separated Antennas MIMO Radar
- 9.2.3. Other
- 9.1. Market Analysis, Insights and Forecast - by Application
- 10. Middle East & Africa MIMO Radar Analysis, Insights and Forecast, 2020-2032
- 10.1. Market Analysis, Insights and Forecast - by Application
- 10.1.1. Car Assisted Driving
- 10.1.2. Robot
- 10.1.3. Remote Sensing and Detection
- 10.1.4. Military
- 10.1.5. Other
- 10.2. Market Analysis, Insights and Forecast - by Types
- 10.2.1. Colocated Antennas MIMO Radar
- 10.2.2. Widely Separated Antennas MIMO Radar
- 10.2.3. Other
- 10.1. Market Analysis, Insights and Forecast - by Application
- 11. Asia Pacific MIMO Radar Analysis, Insights and Forecast, 2020-2032
- 11.1. Market Analysis, Insights and Forecast - by Application
- 11.1.1. Car Assisted Driving
- 11.1.2. Robot
- 11.1.3. Remote Sensing and Detection
- 11.1.4. Military
- 11.1.5. Other
- 11.2. Market Analysis, Insights and Forecast - by Types
- 11.2.1. Colocated Antennas MIMO Radar
- 11.2.2. Widely Separated Antennas MIMO Radar
- 11.2.3. Other
- 11.1. Market Analysis, Insights and Forecast - by Application
- 12. Competitive Analysis
- 12.1. Company Profiles
- 12.1.1 Telephonics
- 12.1.1.1. Company Overview
- 12.1.1.2. Products
- 12.1.1.3. Company Financials
- 12.1.1.4. SWOT Analysis
- 12.1.2 APS System
- 12.1.2.1. Company Overview
- 12.1.2.2. Products
- 12.1.2.3. Company Financials
- 12.1.2.4. SWOT Analysis
- 12.1.3 Arbe Robotics
- 12.1.3.1. Company Overview
- 12.1.3.2. Products
- 12.1.3.3. Company Financials
- 12.1.3.4. SWOT Analysis
- 12.1.4 InnoSenT
- 12.1.4.1. Company Overview
- 12.1.4.2. Products
- 12.1.4.3. Company Financials
- 12.1.4.4. SWOT Analysis
- 12.1.5 Continental AG
- 12.1.5.1. Company Overview
- 12.1.5.2. Products
- 12.1.5.3. Company Financials
- 12.1.5.4. SWOT Analysis
- 12.1.6 Smart Radar System
- 12.1.6.1. Company Overview
- 12.1.6.2. Products
- 12.1.6.3. Company Financials
- 12.1.6.4. SWOT Analysis
- 12.1.7 Aptiv
- 12.1.7.1. Company Overview
- 12.1.7.2. Products
- 12.1.7.3. Company Financials
- 12.1.7.4. SWOT Analysis
- 12.1.8 Smartmicro
- 12.1.8.1. Company Overview
- 12.1.8.2. Products
- 12.1.8.3. Company Financials
- 12.1.8.4. SWOT Analysis
- 12.1.9 ZF Friedrichshafen AG
- 12.1.9.1. Company Overview
- 12.1.9.2. Products
- 12.1.9.3. Company Financials
- 12.1.9.4. SWOT Analysis
- 12.1.10 Rohde Schwarz
- 12.1.10.1. Company Overview
- 12.1.10.2. Products
- 12.1.10.3. Company Financials
- 12.1.10.4. SWOT Analysis
- 12.1.1 Telephonics
- 12.2. Market Entropy
- 12.2.1 Company's Key Areas Served
- 12.2.2 Recent Developments
- 12.3. Company Market Share Analysis 2025
- 12.3.1 Top 5 Companies Market Share Analysis
- 12.3.2 Top 3 Companies Market Share Analysis
- 12.4. List of Potential Customers
- 13. Research Methodology
List of Figures
- Figure 1: Global MIMO Radar Revenue Breakdown (billion, %) by Region 2025 & 2033
- Figure 2: Global MIMO Radar Volume Breakdown (K, %) by Region 2025 & 2033
- Figure 3: North America MIMO Radar Revenue (billion), by Application 2025 & 2033
- Figure 4: North America MIMO Radar Volume (K), by Application 2025 & 2033
- Figure 5: North America MIMO Radar Revenue Share (%), by Application 2025 & 2033
- Figure 6: North America MIMO Radar Volume Share (%), by Application 2025 & 2033
- Figure 7: North America MIMO Radar Revenue (billion), by Types 2025 & 2033
- Figure 8: North America MIMO Radar Volume (K), by Types 2025 & 2033
- Figure 9: North America MIMO Radar Revenue Share (%), by Types 2025 & 2033
- Figure 10: North America MIMO Radar Volume Share (%), by Types 2025 & 2033
- Figure 11: North America MIMO Radar Revenue (billion), by Country 2025 & 2033
- Figure 12: North America MIMO Radar Volume (K), by Country 2025 & 2033
- Figure 13: North America MIMO Radar Revenue Share (%), by Country 2025 & 2033
- Figure 14: North America MIMO Radar Volume Share (%), by Country 2025 & 2033
- Figure 15: South America MIMO Radar Revenue (billion), by Application 2025 & 2033
- Figure 16: South America MIMO Radar Volume (K), by Application 2025 & 2033
- Figure 17: South America MIMO Radar Revenue Share (%), by Application 2025 & 2033
- Figure 18: South America MIMO Radar Volume Share (%), by Application 2025 & 2033
- Figure 19: South America MIMO Radar Revenue (billion), by Types 2025 & 2033
- Figure 20: South America MIMO Radar Volume (K), by Types 2025 & 2033
- Figure 21: South America MIMO Radar Revenue Share (%), by Types 2025 & 2033
- Figure 22: South America MIMO Radar Volume Share (%), by Types 2025 & 2033
- Figure 23: South America MIMO Radar Revenue (billion), by Country 2025 & 2033
- Figure 24: South America MIMO Radar Volume (K), by Country 2025 & 2033
- Figure 25: South America MIMO Radar Revenue Share (%), by Country 2025 & 2033
- Figure 26: South America MIMO Radar Volume Share (%), by Country 2025 & 2033
- Figure 27: Europe MIMO Radar Revenue (billion), by Application 2025 & 2033
- Figure 28: Europe MIMO Radar Volume (K), by Application 2025 & 2033
- Figure 29: Europe MIMO Radar Revenue Share (%), by Application 2025 & 2033
- Figure 30: Europe MIMO Radar Volume Share (%), by Application 2025 & 2033
- Figure 31: Europe MIMO Radar Revenue (billion), by Types 2025 & 2033
- Figure 32: Europe MIMO Radar Volume (K), by Types 2025 & 2033
- Figure 33: Europe MIMO Radar Revenue Share (%), by Types 2025 & 2033
- Figure 34: Europe MIMO Radar Volume Share (%), by Types 2025 & 2033
- Figure 35: Europe MIMO Radar Revenue (billion), by Country 2025 & 2033
- Figure 36: Europe MIMO Radar Volume (K), by Country 2025 & 2033
- Figure 37: Europe MIMO Radar Revenue Share (%), by Country 2025 & 2033
- Figure 38: Europe MIMO Radar Volume Share (%), by Country 2025 & 2033
- Figure 39: Middle East & Africa MIMO Radar Revenue (billion), by Application 2025 & 2033
- Figure 40: Middle East & Africa MIMO Radar Volume (K), by Application 2025 & 2033
- Figure 41: Middle East & Africa MIMO Radar Revenue Share (%), by Application 2025 & 2033
- Figure 42: Middle East & Africa MIMO Radar Volume Share (%), by Application 2025 & 2033
- Figure 43: Middle East & Africa MIMO Radar Revenue (billion), by Types 2025 & 2033
- Figure 44: Middle East & Africa MIMO Radar Volume (K), by Types 2025 & 2033
- Figure 45: Middle East & Africa MIMO Radar Revenue Share (%), by Types 2025 & 2033
- Figure 46: Middle East & Africa MIMO Radar Volume Share (%), by Types 2025 & 2033
- Figure 47: Middle East & Africa MIMO Radar Revenue (billion), by Country 2025 & 2033
- Figure 48: Middle East & Africa MIMO Radar Volume (K), by Country 2025 & 2033
- Figure 49: Middle East & Africa MIMO Radar Revenue Share (%), by Country 2025 & 2033
- Figure 50: Middle East & Africa MIMO Radar Volume Share (%), by Country 2025 & 2033
- Figure 51: Asia Pacific MIMO Radar Revenue (billion), by Application 2025 & 2033
- Figure 52: Asia Pacific MIMO Radar Volume (K), by Application 2025 & 2033
- Figure 53: Asia Pacific MIMO Radar Revenue Share (%), by Application 2025 & 2033
- Figure 54: Asia Pacific MIMO Radar Volume Share (%), by Application 2025 & 2033
- Figure 55: Asia Pacific MIMO Radar Revenue (billion), by Types 2025 & 2033
- Figure 56: Asia Pacific MIMO Radar Volume (K), by Types 2025 & 2033
- Figure 57: Asia Pacific MIMO Radar Revenue Share (%), by Types 2025 & 2033
- Figure 58: Asia Pacific MIMO Radar Volume Share (%), by Types 2025 & 2033
- Figure 59: Asia Pacific MIMO Radar Revenue (billion), by Country 2025 & 2033
- Figure 60: Asia Pacific MIMO Radar Volume (K), by Country 2025 & 2033
- Figure 61: Asia Pacific MIMO Radar Revenue Share (%), by Country 2025 & 2033
- Figure 62: Asia Pacific MIMO Radar Volume Share (%), by Country 2025 & 2033
List of Tables
- Table 1: Global MIMO Radar Revenue billion Forecast, by Application 2020 & 2033
- Table 2: Global MIMO Radar Volume K Forecast, by Application 2020 & 2033
- Table 3: Global MIMO Radar Revenue billion Forecast, by Types 2020 & 2033
- Table 4: Global MIMO Radar Volume K Forecast, by Types 2020 & 2033
- Table 5: Global MIMO Radar Revenue billion Forecast, by Region 2020 & 2033
- Table 6: Global MIMO Radar Volume K Forecast, by Region 2020 & 2033
- Table 7: Global MIMO Radar Revenue billion Forecast, by Application 2020 & 2033
- Table 8: Global MIMO Radar Volume K Forecast, by Application 2020 & 2033
- Table 9: Global MIMO Radar Revenue billion Forecast, by Types 2020 & 2033
- Table 10: Global MIMO Radar Volume K Forecast, by Types 2020 & 2033
- Table 11: Global MIMO Radar Revenue billion Forecast, by Country 2020 & 2033
- Table 12: Global MIMO Radar Volume K Forecast, by Country 2020 & 2033
- Table 13: United States MIMO Radar Revenue (billion) Forecast, by Application 2020 & 2033
- Table 14: United States MIMO Radar Volume (K) Forecast, by Application 2020 & 2033
- Table 15: Canada MIMO Radar Revenue (billion) Forecast, by Application 2020 & 2033
- Table 16: Canada MIMO Radar Volume (K) Forecast, by Application 2020 & 2033
- Table 17: Mexico MIMO Radar Revenue (billion) Forecast, by Application 2020 & 2033
- Table 18: Mexico MIMO Radar Volume (K) Forecast, by Application 2020 & 2033
- Table 19: Global MIMO Radar Revenue billion Forecast, by Application 2020 & 2033
- Table 20: Global MIMO Radar Volume K Forecast, by Application 2020 & 2033
- Table 21: Global MIMO Radar Revenue billion Forecast, by Types 2020 & 2033
- Table 22: Global MIMO Radar Volume K Forecast, by Types 2020 & 2033
- Table 23: Global MIMO Radar Revenue billion Forecast, by Country 2020 & 2033
- Table 24: Global MIMO Radar Volume K Forecast, by Country 2020 & 2033
- Table 25: Brazil MIMO Radar Revenue (billion) Forecast, by Application 2020 & 2033
- Table 26: Brazil MIMO Radar Volume (K) Forecast, by Application 2020 & 2033
- Table 27: Argentina MIMO Radar Revenue (billion) Forecast, by Application 2020 & 2033
- Table 28: Argentina MIMO Radar Volume (K) Forecast, by Application 2020 & 2033
- Table 29: Rest of South America MIMO Radar Revenue (billion) Forecast, by Application 2020 & 2033
- Table 30: Rest of South America MIMO Radar Volume (K) Forecast, by Application 2020 & 2033
- Table 31: Global MIMO Radar Revenue billion Forecast, by Application 2020 & 2033
- Table 32: Global MIMO Radar Volume K Forecast, by Application 2020 & 2033
- Table 33: Global MIMO Radar Revenue billion Forecast, by Types 2020 & 2033
- Table 34: Global MIMO Radar Volume K Forecast, by Types 2020 & 2033
- Table 35: Global MIMO Radar Revenue billion Forecast, by Country 2020 & 2033
- Table 36: Global MIMO Radar Volume K Forecast, by Country 2020 & 2033
- Table 37: United Kingdom MIMO Radar Revenue (billion) Forecast, by Application 2020 & 2033
- Table 38: United Kingdom MIMO Radar Volume (K) Forecast, by Application 2020 & 2033
- Table 39: Germany MIMO Radar Revenue (billion) Forecast, by Application 2020 & 2033
- Table 40: Germany MIMO Radar Volume (K) Forecast, by Application 2020 & 2033
- Table 41: France MIMO Radar Revenue (billion) Forecast, by Application 2020 & 2033
- Table 42: France MIMO Radar Volume (K) Forecast, by Application 2020 & 2033
- Table 43: Italy MIMO Radar Revenue (billion) Forecast, by Application 2020 & 2033
- Table 44: Italy MIMO Radar Volume (K) Forecast, by Application 2020 & 2033
- Table 45: Spain MIMO Radar Revenue (billion) Forecast, by Application 2020 & 2033
- Table 46: Spain MIMO Radar Volume (K) Forecast, by Application 2020 & 2033
- Table 47: Russia MIMO Radar Revenue (billion) Forecast, by Application 2020 & 2033
- Table 48: Russia MIMO Radar Volume (K) Forecast, by Application 2020 & 2033
- Table 49: Benelux MIMO Radar Revenue (billion) Forecast, by Application 2020 & 2033
- Table 50: Benelux MIMO Radar Volume (K) Forecast, by Application 2020 & 2033
- Table 51: Nordics MIMO Radar Revenue (billion) Forecast, by Application 2020 & 2033
- Table 52: Nordics MIMO Radar Volume (K) Forecast, by Application 2020 & 2033
- Table 53: Rest of Europe MIMO Radar Revenue (billion) Forecast, by Application 2020 & 2033
- Table 54: Rest of Europe MIMO Radar Volume (K) Forecast, by Application 2020 & 2033
- Table 55: Global MIMO Radar Revenue billion Forecast, by Application 2020 & 2033
- Table 56: Global MIMO Radar Volume K Forecast, by Application 2020 & 2033
- Table 57: Global MIMO Radar Revenue billion Forecast, by Types 2020 & 2033
- Table 58: Global MIMO Radar Volume K Forecast, by Types 2020 & 2033
- Table 59: Global MIMO Radar Revenue billion Forecast, by Country 2020 & 2033
- Table 60: Global MIMO Radar Volume K Forecast, by Country 2020 & 2033
- Table 61: Turkey MIMO Radar Revenue (billion) Forecast, by Application 2020 & 2033
- Table 62: Turkey MIMO Radar Volume (K) Forecast, by Application 2020 & 2033
- Table 63: Israel MIMO Radar Revenue (billion) Forecast, by Application 2020 & 2033
- Table 64: Israel MIMO Radar Volume (K) Forecast, by Application 2020 & 2033
- Table 65: GCC MIMO Radar Revenue (billion) Forecast, by Application 2020 & 2033
- Table 66: GCC MIMO Radar Volume (K) Forecast, by Application 2020 & 2033
- Table 67: North Africa MIMO Radar Revenue (billion) Forecast, by Application 2020 & 2033
- Table 68: North Africa MIMO Radar Volume (K) Forecast, by Application 2020 & 2033
- Table 69: South Africa MIMO Radar Revenue (billion) Forecast, by Application 2020 & 2033
- Table 70: South Africa MIMO Radar Volume (K) Forecast, by Application 2020 & 2033
- Table 71: Rest of Middle East & Africa MIMO Radar Revenue (billion) Forecast, by Application 2020 & 2033
- Table 72: Rest of Middle East & Africa MIMO Radar Volume (K) Forecast, by Application 2020 & 2033
- Table 73: Global MIMO Radar Revenue billion Forecast, by Application 2020 & 2033
- Table 74: Global MIMO Radar Volume K Forecast, by Application 2020 & 2033
- Table 75: Global MIMO Radar Revenue billion Forecast, by Types 2020 & 2033
- Table 76: Global MIMO Radar Volume K Forecast, by Types 2020 & 2033
- Table 77: Global MIMO Radar Revenue billion Forecast, by Country 2020 & 2033
- Table 78: Global MIMO Radar Volume K Forecast, by Country 2020 & 2033
- Table 79: China MIMO Radar Revenue (billion) Forecast, by Application 2020 & 2033
- Table 80: China MIMO Radar Volume (K) Forecast, by Application 2020 & 2033
- Table 81: India MIMO Radar Revenue (billion) Forecast, by Application 2020 & 2033
- Table 82: India MIMO Radar Volume (K) Forecast, by Application 2020 & 2033
- Table 83: Japan MIMO Radar Revenue (billion) Forecast, by Application 2020 & 2033
- Table 84: Japan MIMO Radar Volume (K) Forecast, by Application 2020 & 2033
- Table 85: South Korea MIMO Radar Revenue (billion) Forecast, by Application 2020 & 2033
- Table 86: South Korea MIMO Radar Volume (K) Forecast, by Application 2020 & 2033
- Table 87: ASEAN MIMO Radar Revenue (billion) Forecast, by Application 2020 & 2033
- Table 88: ASEAN MIMO Radar Volume (K) Forecast, by Application 2020 & 2033
- Table 89: Oceania MIMO Radar Revenue (billion) Forecast, by Application 2020 & 2033
- Table 90: Oceania MIMO Radar Volume (K) Forecast, by Application 2020 & 2033
- Table 91: Rest of Asia Pacific MIMO Radar Revenue (billion) Forecast, by Application 2020 & 2033
- Table 92: Rest of Asia Pacific MIMO Radar Volume (K) Forecast, by Application 2020 & 2033
Frequently Asked Questions
1. What is the projected Compound Annual Growth Rate (CAGR) of the MIMO Radar?
The projected CAGR is approximately 11.28%.
2. Which companies are prominent players in the MIMO Radar?
Key companies in the market include Telephonics, APS System, Arbe Robotics, InnoSenT, Continental AG, Smart Radar System, Aptiv, Smartmicro, ZF Friedrichshafen AG, Rohde Schwarz.
3. What are the main segments of the MIMO Radar?
The market segments include Application, Types.
4. Can you provide details about the market size?
The market size is estimated to be USD 9.02 billion as of 2022.
5. What are some drivers contributing to market growth?
N/A
6. What are the notable trends driving market growth?
N/A
7. Are there any restraints impacting market growth?
N/A
8. Can you provide examples of recent developments in the market?
N/A
9. What pricing options are available for accessing the report?
Pricing options include single-user, multi-user, and enterprise licenses priced at USD 3350.00, USD 5025.00, and USD 6700.00 respectively.
10. Is the market size provided in terms of value or volume?
The market size is provided in terms of value, measured in billion and volume, measured in K.
11. Are there any specific market keywords associated with the report?
Yes, the market keyword associated with the report is "MIMO Radar," which aids in identifying and referencing the specific market segment covered.
12. How do I determine which pricing option suits my needs best?
The pricing options vary based on user requirements and access needs. Individual users may opt for single-user licenses, while businesses requiring broader access may choose multi-user or enterprise licenses for cost-effective access to the report.
13. Are there any additional resources or data provided in the MIMO Radar report?
While the report offers comprehensive insights, it's advisable to review the specific contents or supplementary materials provided to ascertain if additional resources or data are available.
14. How can I stay updated on further developments or reports in the MIMO Radar?
To stay informed about further developments, trends, and reports in the MIMO Radar, consider subscribing to industry newsletters, following relevant companies and organizations, or regularly checking reputable industry news sources and publications.
Methodology
Step 1 - Identification of Relevant Samples Size from Population Database


Step 2 - Approaches for Defining Global Market Size (Value, Volume* & Price*)

Note*: In applicable scenarios
Step 3 - Data Sources
Primary Research
- Web Analytics
- Survey Reports
- Research Institute
- Latest Research Reports
- Opinion Leaders
Secondary Research
- Annual Reports
- White Paper
- Latest Press Release
- Industry Association
- Paid Database
- Investor Presentations

Step 4 - Data Triangulation
Involves using different sources of information in order to increase the validity of a study
These sources are likely to be stakeholders in a program - participants, other researchers, program staff, other community members, and so on.
Then we put all data in single framework & apply various statistical tools to find out the dynamic on the market.
During the analysis stage, feedback from the stakeholder groups would be compared to determine areas of agreement as well as areas of divergence