

Key Insights
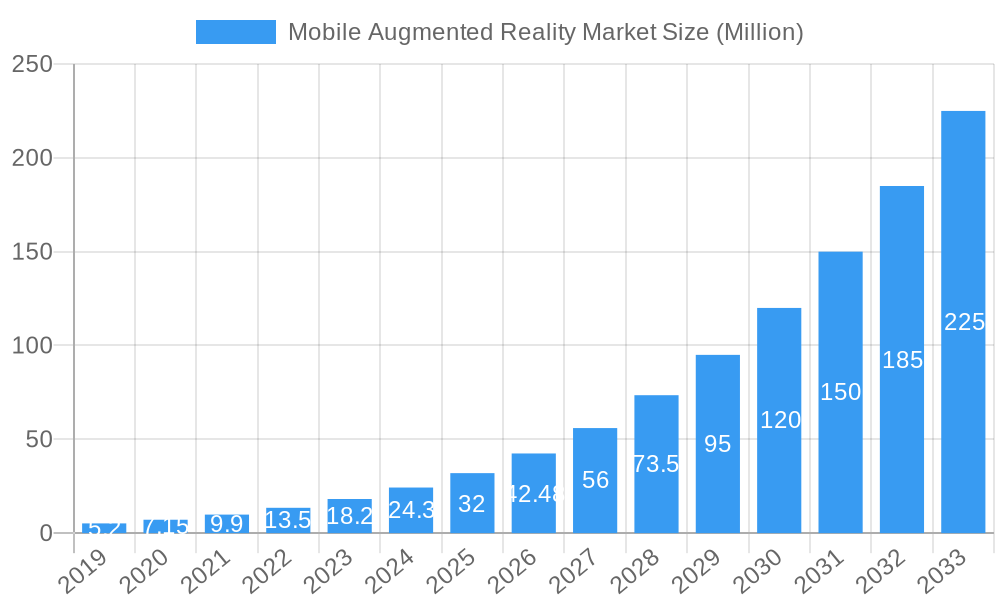
The Mobile Augmented Reality (AR) market is experiencing explosive growth, projected to reach a significant valuation of USD 42.48 billion. This impressive expansion is driven by a staggering Compound Annual Growth Rate (CAGR) of 42.36% from 2025 to 2033. This rapid ascent is fueled by the increasing integration of AR technology into everyday applications, particularly within the gaming sector, where immersive experiences are highly sought after. Educational institutions are leveraging AR for interactive learning, while healthcare professionals are benefiting from its applications in training and surgical planning. The retail and marketing industries are also embracing AR for enhanced product visualization and engaging customer experiences. Furthermore, the automotive sector is utilizing AR for heads-up displays and navigation, and the military and defense industries are exploring its potential for training and operational support. Emerging trends like the development of more sophisticated AR software, including advanced object tracking, sophisticated image recognition capabilities, and powerful data analytics, are further propelling market adoption.
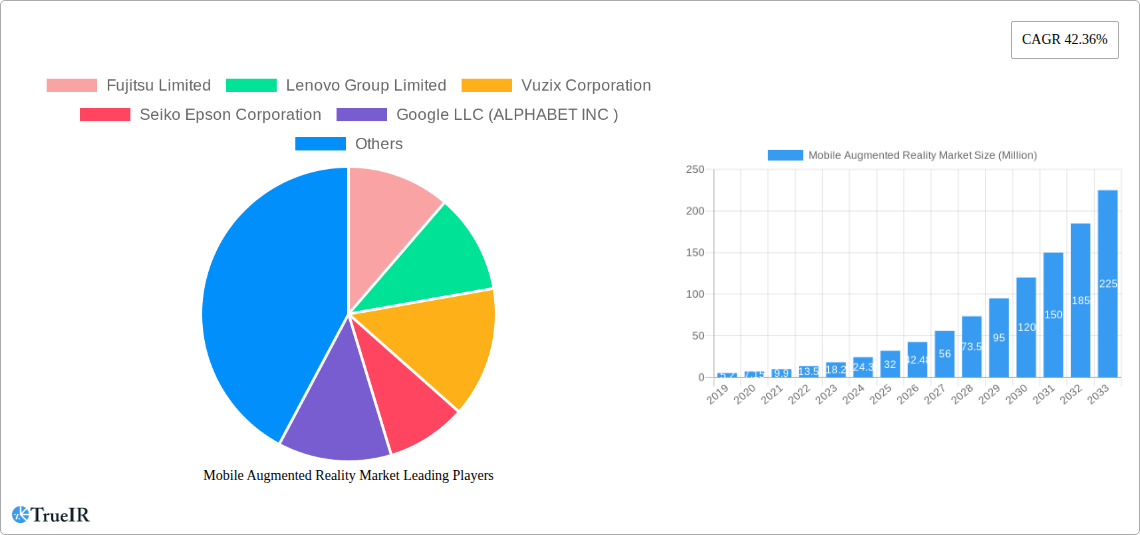
Mobile Augmented Reality Market Market Size (In Million)
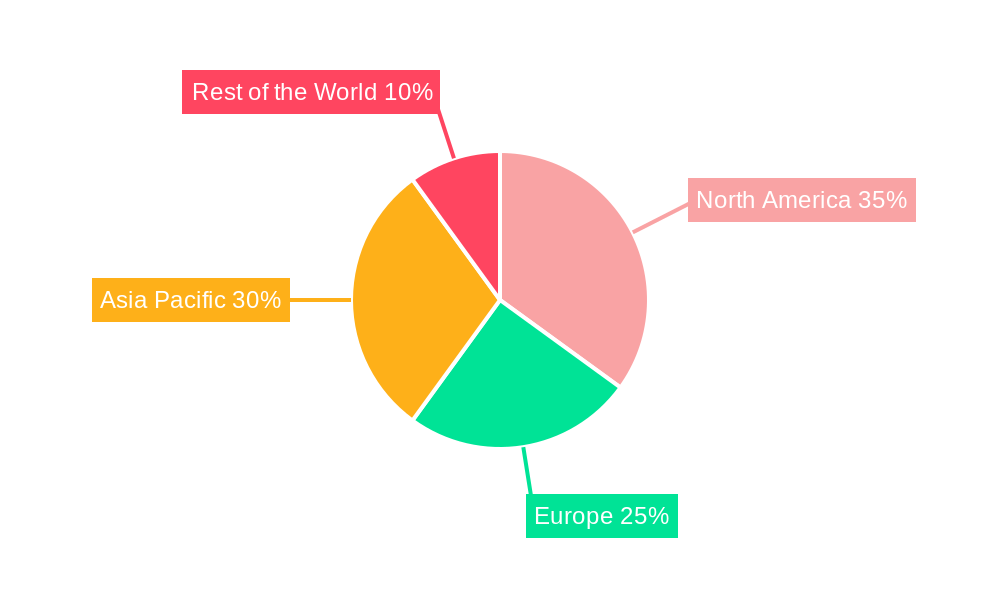
Despite the overwhelmingly positive growth trajectory, certain factors could temper the market's full potential. High development costs for complex AR applications and a need for specialized hardware can act as restraints. Additionally, concerns surrounding data privacy and security within AR environments, along with the requirement for robust network infrastructure to support seamless AR experiences, present ongoing challenges. However, these challenges are being systematically addressed through ongoing technological advancements and strategic investments by leading companies such as Google LLC, Vuzix Corporation, and Realwear Inc. The market is characterized by a diverse range of product types, including standalone AR devices, tethered solutions, and screenless viewers, catering to a broad spectrum of end-user needs. Geographically, North America and Asia Pacific are expected to lead market growth due to strong technological adoption and significant investments in AR development.
Mobile Augmented Reality Market Company Market Share
Mobile Augmented Reality Market: Comprehensive Analysis and Forecast (2019-2033)
This in-depth report provides a dynamic and SEO-optimized analysis of the global Mobile Augmented Reality Market, leveraging high-volume keywords to enhance search rankings and engage industry audiences. We offer a comprehensive outlook on the market's trajectory from 2019 to 2033, with a detailed focus on the estimated year of 2025 and the forecast period of 2025–2033. This report is designed for immediate use without further modification.
Study Period: 2019–2033 Base Year: 2025 Estimated Year: 2025 Forecast Period: 2025–2033 Historical Period: 2019–2024
Mobile Augmented Reality Market Structure & Competitive Landscape
The mobile augmented reality market is characterized by a moderately concentrated structure, with key players investing heavily in research and development to drive innovation. The competitive landscape is shaped by technological advancements, strategic partnerships, and evolving end-user adoption. Regulatory impacts are nascent but will likely influence data privacy and content standards in the future. Product substitutes, such as advanced virtual reality, present a dynamic competitive force.
- Market Concentration: Leading companies hold a significant market share, but the emergence of new startups and specialized AR solutions continues to foster healthy competition. Concentration ratios indicate a trend towards strategic consolidation.
- Innovation Drivers: The relentless pursuit of more immersive and accessible AR experiences fuels innovation. This includes advancements in hardware (lighter, more powerful headsets), software (sophisticated object recognition, AI integration), and content creation tools.
- Regulatory Impacts: Currently, regulatory frameworks are still developing. Future regulations concerning data privacy, content moderation, and interoperability standards could significantly shape market dynamics.
- Product Substitutes: While AR and VR serve distinct purposes, advancements in VR technology could offer alternative immersive experiences, influencing user adoption decisions.
- End-User Segmentation: The market is segmenting rapidly across diverse industries, indicating a broad application potential.
- M&A Trends: Merger and acquisition activities are expected to increase as larger tech companies seek to integrate AR capabilities into their existing ecosystems and acquire innovative technologies. Approximately XX mergers and acquisitions are projected annually during the forecast period.
Mobile Augmented Reality Market Trends & Opportunities
The mobile augmented reality market is poised for explosive growth, driven by increasing smartphone penetration, the development of sophisticated AR SDKs, and a growing demand for immersive digital experiences across consumer and enterprise sectors. Market size is projected to reach a valuation of over XXX Million by 2025, with a projected Compound Annual Growth Rate (CAGR) of XX% during the forecast period. Technological shifts, including the maturation of AI-powered object recognition and real-time spatial mapping, are creating new avenues for application development and user engagement.
Consumer preferences are increasingly leaning towards interactive and engaging content, which AR is uniquely positioned to deliver. This is evident in the growing adoption of AR features in social media, gaming, and e-commerce. For instance, the gaming segment is a significant early adopter, leveraging AR for more interactive and location-based gameplay. Similarly, the retail and marketing segment is embracing AR for virtual try-ons, product visualization, and enhanced in-store experiences, driving increased customer engagement and conversion rates. The education sector is also recognizing the transformative potential of AR in creating engaging and interactive learning environments, moving beyond traditional methods to offer hands-on virtual exploration of complex subjects.
The healthcare industry is exploring AR for surgical planning, medical training, and patient education, offering significant opportunities for improved outcomes and reduced costs. In the automotive sector, AR is being utilized for heads-up displays, driver assistance, and vehicle maintenance, enhancing safety and user experience. The military and defense sector is also a key area of growth, with AR applications for training, mission planning, and enhanced situational awareness.
The development of more accessible and affordable AR hardware, coupled with the continuous improvement of AR software platforms, is further accelerating market penetration. The integration of AR capabilities into everyday mobile devices ensures a broad user base. Strategic collaborations between hardware manufacturers, software developers, and content creators are crucial for unlocking the full potential of this market. Opportunities abound for innovative applications that leverage AR to solve real-world problems, enhance productivity, and create novel forms of entertainment and communication. The increasing investment in the metaverse is also expected to be a significant catalyst for mobile AR adoption, as users seek to bridge the physical and digital worlds.
Dominant Markets & Segments in Mobile Augmented Reality Market
The mobile augmented reality market exhibits significant dominance across specific regions and segments, driven by infrastructural readiness, supportive policies, and strong end-user demand. North America currently leads, owing to its early adoption of technology and substantial investment in AR research and development. The United States, in particular, is a powerhouse for mobile AR, fueled by its robust tech industry and a large consumer base receptive to new digital experiences.
- Dominant Region: North America, with its advanced technological infrastructure and significant venture capital funding, is the current leader in the mobile augmented reality market.
- Leading Country: The United States is at the forefront, driven by innovation from major tech players and widespread consumer adoption of AR-enabled applications.
Type Segmentation:
- Standalone: This segment is experiencing rapid growth due to the increasing capabilities of smartphones and dedicated AR devices. Standalone AR offers greater freedom of movement and a more integrated user experience, driving adoption in various applications. The projected market share for standalone devices is expected to reach XX% by 2025.
- Tethered: While still relevant, particularly for specialized enterprise applications requiring higher processing power or specific sensor arrays, tethered devices are seeing a gradual decline in market share compared to standalone solutions.
- Screenless Viewer: This niche segment, primarily focused on smart glasses, is expected to see steady growth as technology matures and costs decrease, offering a more unobtrusive AR experience.
End User Segmentation:
- Gaming: This segment remains a primary driver of mobile AR adoption, with innovative games leveraging location-based AR and interactive gameplay. The continued development of AR-enabled gaming platforms and the integration of AR into mainstream gaming experiences will further propel its growth.
- Education: The educational sector is a rapidly expanding market for mobile AR, offering immersive and interactive learning experiences. AR applications that allow students to explore complex concepts, historical sites, or scientific models in 3D are gaining traction.
- Retail and Marketing: AR is revolutionizing retail with virtual try-ons, product visualization, and enhanced in-store experiences. Marketing campaigns are leveraging AR for interactive advertisements and engaging brand storytelling, leading to increased customer interaction and conversion rates.
- Healthcare: AR is transforming healthcare through applications in surgical planning, medical training, and patient education. The ability to visualize anatomical structures in 3D or overlay critical patient data during procedures offers significant advantages.
- Automotive: In the automotive sector, AR is enhancing driver safety through advanced heads-up displays and providing valuable information for vehicle maintenance and diagnostics.
- Military and Defense: This sector utilizes AR for advanced training simulations, mission planning, and improving situational awareness on the battlefield, contributing to enhanced operational effectiveness.
- Other End-user Verticals: Emerging applications in fields like architecture, real estate, and tourism are further diversifying the market and creating new growth opportunities.
Software Segmentation:
- Object Tracking: Essential for overlaying digital information onto real-world objects, object tracking is a foundational technology for many AR applications. Continuous improvements in accuracy and speed are critical for seamless experiences.
- Image Recognition: This software component enables AR applications to identify and understand specific images, triggering relevant digital content. Its development is crucial for interactive marketing and educational AR experiences.
- Data Analytics: As AR applications gather more user interaction data, robust data analytics capabilities become vital for understanding user behavior, optimizing AR experiences, and driving business insights.
The growth in these segments is underpinned by ongoing technological advancements and increasing investment from both established companies and emerging startups.
Mobile Augmented Reality Market Product Analysis
Product innovations in the mobile augmented reality market are rapidly enhancing user experience and expanding application scope. Advancements in AR hardware, such as lighter and more powerful smart glasses and improved smartphone camera capabilities, are key. Software innovations focus on more sophisticated object tracking, enhanced image recognition, and real-time data analytics, enabling more realistic and interactive AR experiences. Competitive advantages are being built on the seamless integration of hardware and software, intuitive user interfaces, and the creation of compelling content tailored to specific industry needs. The market is witnessing a strong trend towards personalized AR experiences that cater to individual user preferences and contextual information.
Key Drivers, Barriers & Challenges in Mobile Augmented Reality Market
The mobile augmented reality market is propelled by significant technological advancements, including the increasing power and accessibility of smartphones and the development of sophisticated AR software. Economic factors, such as growing venture capital investment and the potential for significant ROI in enterprise applications, are also driving growth. Supportive government initiatives and industry standards, though still emerging, are expected to foster wider adoption.
- Technological Advancements: Enhanced processing power, improved sensors, and sophisticated algorithms for object recognition and spatial mapping are fundamental drivers.
- Economic Factors: Increasing enterprise adoption for training, design, and customer engagement, alongside growing consumer interest in AR-enhanced entertainment and e-commerce, fuels investment.
- Policy-Driven Factors: The development of industry standards and potential government incentives for AR integration in key sectors can accelerate market expansion.
The market faces challenges including the high cost of advanced AR hardware, privacy concerns related to data collection, and the need for more compelling and practical AR content across various use cases.
- Supply Chain Issues: While not a primary constraint currently, potential bottlenecks in the supply of specialized AR components could impact production scalability.
- Regulatory Hurdles: Evolving data privacy regulations and the absence of a universal AR content standard could pose adoption challenges.
- Competitive Pressures: Intense competition among technology giants and startups necessitates continuous innovation and differentiation.
Growth Drivers in the Mobile Augmented Reality Market Market
Several key drivers are propelling the mobile augmented reality market. Technologically, the continuous improvement of smartphone capabilities, including enhanced processors, cameras, and sensors, makes AR more accessible to a broader audience. Software advancements, such as sophisticated AI-powered object recognition and real-time environmental mapping, are enabling more realistic and interactive AR experiences. Economically, increasing enterprise adoption for applications in training, design, and remote assistance is driving significant investment and demonstrating tangible ROI. Furthermore, the growing consumer appetite for immersive gaming, interactive shopping, and enhanced entertainment content creates substantial market pull. Policy-wise, the development of industry standards and potential government support for AR integration in sectors like education and healthcare can further accelerate growth.
Challenges Impacting Mobile Augmented Reality Market Growth
Despite its promising growth, the mobile augmented reality market faces several challenges. Regulatory complexities, particularly concerning data privacy and security, can slow down adoption, especially in sensitive sectors like healthcare. Supply chain issues, while not currently a major impediment, could arise with a rapid surge in demand for specialized AR hardware components. Competitive pressures are intense, with major tech players investing heavily, potentially leading to market consolidation and making it difficult for smaller innovators to gain traction. The development of truly compelling and practical AR content that goes beyond novelty and provides significant utility remains a critical challenge. Furthermore, the initial cost of some advanced AR hardware, such as dedicated AR glasses, can be a barrier to widespread consumer adoption.
Key Players Shaping the Mobile Augmented Reality Market Market
- Fujitsu Limited
- Lenovo Group Limited
- Vuzix Corporation
- Seiko Epson Corporation
- Google LLC (ALPHABET INC )
- Realwear Inc
- Kopin Corporation
- Optinvent
- Daqri
- Dynabook Europe GmbH
Significant Mobile Augmented Reality Market Industry Milestones
- January 2022: Qualcomm and Microsoft announced a partnership to advance and accelerate augmented reality and open up new portals to the metaverse. The businesses will work together to design unique augmented reality chips and integrate software platforms, signaling a major push towards next-generation AR hardware and software integration.
- September 2022: The premier augmented reality (AR) technology and content platform Blippar integrated its WebAR SDK into Unity, making it possible for Unity developers to create simple AR experiences that can be quickly distributed to any web browser. Unity developers can create and distribute WebAR experiences without switching back and forth between different platforms thanks to the Blippar SDK Beta plug-in, democratizing AR content creation and distribution.
Future Outlook for Mobile Augmented Reality Market Market
The future outlook for the mobile augmented reality market is exceptionally bright, characterized by sustained growth and an expanding array of applications. Continued technological advancements in hardware, including lighter and more powerful smart glasses and enhanced smartphone AR capabilities, will drive user adoption. Software innovations in AI, computer vision, and spatial computing will unlock more immersive and contextually relevant AR experiences. Strategic opportunities lie in the deeper integration of AR into enterprise workflows, revolutionizing training, design, and remote collaboration, leading to significant productivity gains. The burgeoning metaverse concept will act as a powerful catalyst, driving demand for AR devices and content that seamlessly blend the physical and digital realms. Furthermore, the increasing focus on personalized AR experiences, tailored to individual needs and preferences, will create new avenues for engagement and monetization across various consumer sectors, from gaming and retail to education and entertainment. The market is projected to witness substantial growth, fueled by innovation and a widening adoption base.
Mobile Augmented Reality Market Segmentation
-
1. Type
- 1.1. Standalone
- 1.2. Tethered
- 1.3. Screenless Viewer
-
2. End User
- 2.1. Gaming
- 2.2. Education
- 2.3. Healthcare
- 2.4. Retail and Marketing
- 2.5. Automotive
- 2.6. Military and Defense
- 2.7. Other End-user Verticals
-
3. Software
- 3.1. Object Tracking
- 3.2. Image Recognition
- 3.3. Data Analytics
Mobile Augmented Reality Market Segmentation By Geography
-
1. North America
- 1.1. US
- 1.2. Canada
-
2. Europe
- 2.1. Germany
- 2.2. UK
- 2.3. France
- 2.4. Italy
- 2.5. Rest of Europe
-
3. Asia Pacific
- 3.1. India
- 3.2. China
- 3.3. Japan
- 3.4. Rest of Asia Pacific
- 4. Rest of the World
Mobile Augmented Reality Market Regional Market Share
Geographic Coverage of Mobile Augmented Reality Market
Mobile Augmented Reality Market REPORT HIGHLIGHTS
| Aspects | Details |
|---|---|
| Study Period | 2020-2034 |
| Base Year | 2025 |
| Estimated Year | 2026 |
| Forecast Period | 2026-2034 |
| Historical Period | 2020-2025 |
| Growth Rate | CAGR of 42.36% from 2020-2034 |
| Segmentation |
|
Table of Contents
- 1. Introduction
- 1.1. Research Scope
- 1.2. Market Segmentation
- 1.3. Research Objective
- 1.4. Definitions and Assumptions
- 2. Executive Summary
- 2.1. Market Snapshot
- 3. Market Dynamics
- 3.1. Market Drivers
- 3.2. Market Restrains
- 3.3. Market Trends
- 3.4. Market Opportunities
- 4. Market Factor Analysis
- 4.1. Porters Five Forces
- 4.1.1. Bargaining Power of Suppliers
- 4.1.2. Bargaining Power of Buyers
- 4.1.3. Threat of New Entrants
- 4.1.4. Threat of Substitutes
- 4.1.5. Competitive Rivalry
- 4.2. PESTEL analysis
- 4.3. BCG Analysis
- 4.3.1. Stars (High Growth, High Market Share)
- 4.3.2. Cash Cows (Low Growth, High Market Share)
- 4.3.3. Question Mark (High Growth, Low Market Share)
- 4.3.4. Dogs (Low Growth, Low Market Share)
- 4.4. Ansoff Matrix Analysis
- 4.5. Supply Chain Analysis
- 4.6. Regulatory Landscape
- 4.7. Current Market Potential and Opportunity Assessment (TAM–SAM–SOM Framework)
- 4.8. TIR Analyst Note
- 4.1. Porters Five Forces
- 5. Market Analysis, Insights and Forecast 2021-2033
- 5.1. Market Analysis, Insights and Forecast - by Type
- 5.1.1. Standalone
- 5.1.2. Tethered
- 5.1.3. Screenless Viewer
- 5.2. Market Analysis, Insights and Forecast - by End User
- 5.2.1. Gaming
- 5.2.2. Education
- 5.2.3. Healthcare
- 5.2.4. Retail and Marketing
- 5.2.5. Automotive
- 5.2.6. Military and Defense
- 5.2.7. Other End-user Verticals
- 5.3. Market Analysis, Insights and Forecast - by Software
- 5.3.1. Object Tracking
- 5.3.2. Image Recognition
- 5.3.3. Data Analytics
- 5.4. Market Analysis, Insights and Forecast - by Region
- 5.4.1. North America
- 5.4.2. Europe
- 5.4.3. Asia Pacific
- 5.4.4. Rest of the World
- 5.1. Market Analysis, Insights and Forecast - by Type
- 6. Global Mobile Augmented Reality Market Analysis, Insights and Forecast, 2021-2033
- 6.1. Market Analysis, Insights and Forecast - by Type
- 6.1.1. Standalone
- 6.1.2. Tethered
- 6.1.3. Screenless Viewer
- 6.2. Market Analysis, Insights and Forecast - by End User
- 6.2.1. Gaming
- 6.2.2. Education
- 6.2.3. Healthcare
- 6.2.4. Retail and Marketing
- 6.2.5. Automotive
- 6.2.6. Military and Defense
- 6.2.7. Other End-user Verticals
- 6.3. Market Analysis, Insights and Forecast - by Software
- 6.3.1. Object Tracking
- 6.3.2. Image Recognition
- 6.3.3. Data Analytics
- 6.1. Market Analysis, Insights and Forecast - by Type
- 7. North America Mobile Augmented Reality Market Analysis, Insights and Forecast, 2020-2032
- 7.1. Market Analysis, Insights and Forecast - by Type
- 7.1.1. Standalone
- 7.1.2. Tethered
- 7.1.3. Screenless Viewer
- 7.2. Market Analysis, Insights and Forecast - by End User
- 7.2.1. Gaming
- 7.2.2. Education
- 7.2.3. Healthcare
- 7.2.4. Retail and Marketing
- 7.2.5. Automotive
- 7.2.6. Military and Defense
- 7.2.7. Other End-user Verticals
- 7.3. Market Analysis, Insights and Forecast - by Software
- 7.3.1. Object Tracking
- 7.3.2. Image Recognition
- 7.3.3. Data Analytics
- 7.1. Market Analysis, Insights and Forecast - by Type
- 8. Europe Mobile Augmented Reality Market Analysis, Insights and Forecast, 2020-2032
- 8.1. Market Analysis, Insights and Forecast - by Type
- 8.1.1. Standalone
- 8.1.2. Tethered
- 8.1.3. Screenless Viewer
- 8.2. Market Analysis, Insights and Forecast - by End User
- 8.2.1. Gaming
- 8.2.2. Education
- 8.2.3. Healthcare
- 8.2.4. Retail and Marketing
- 8.2.5. Automotive
- 8.2.6. Military and Defense
- 8.2.7. Other End-user Verticals
- 8.3. Market Analysis, Insights and Forecast - by Software
- 8.3.1. Object Tracking
- 8.3.2. Image Recognition
- 8.3.3. Data Analytics
- 8.1. Market Analysis, Insights and Forecast - by Type
- 9. Asia Pacific Mobile Augmented Reality Market Analysis, Insights and Forecast, 2020-2032
- 9.1. Market Analysis, Insights and Forecast - by Type
- 9.1.1. Standalone
- 9.1.2. Tethered
- 9.1.3. Screenless Viewer
- 9.2. Market Analysis, Insights and Forecast - by End User
- 9.2.1. Gaming
- 9.2.2. Education
- 9.2.3. Healthcare
- 9.2.4. Retail and Marketing
- 9.2.5. Automotive
- 9.2.6. Military and Defense
- 9.2.7. Other End-user Verticals
- 9.3. Market Analysis, Insights and Forecast - by Software
- 9.3.1. Object Tracking
- 9.3.2. Image Recognition
- 9.3.3. Data Analytics
- 9.1. Market Analysis, Insights and Forecast - by Type
- 10. Rest of the World Mobile Augmented Reality Market Analysis, Insights and Forecast, 2020-2032
- 10.1. Market Analysis, Insights and Forecast - by Type
- 10.1.1. Standalone
- 10.1.2. Tethered
- 10.1.3. Screenless Viewer
- 10.2. Market Analysis, Insights and Forecast - by End User
- 10.2.1. Gaming
- 10.2.2. Education
- 10.2.3. Healthcare
- 10.2.4. Retail and Marketing
- 10.2.5. Automotive
- 10.2.6. Military and Defense
- 10.2.7. Other End-user Verticals
- 10.3. Market Analysis, Insights and Forecast - by Software
- 10.3.1. Object Tracking
- 10.3.2. Image Recognition
- 10.3.3. Data Analytics
- 10.1. Market Analysis, Insights and Forecast - by Type
- 11. Competitive Analysis
- 11.1. Company Profiles
- 11.1.1 Fujitsu Limited
- 11.1.1.1. Company Overview
- 11.1.1.2. Products
- 11.1.1.3. Company Financials
- 11.1.1.4. SWOT Analysis
- 11.1.2 Lenovo Group Limited
- 11.1.2.1. Company Overview
- 11.1.2.2. Products
- 11.1.2.3. Company Financials
- 11.1.2.4. SWOT Analysis
- 11.1.3 Vuzix Corporation
- 11.1.3.1. Company Overview
- 11.1.3.2. Products
- 11.1.3.3. Company Financials
- 11.1.3.4. SWOT Analysis
- 11.1.4 Seiko Epson Corporation
- 11.1.4.1. Company Overview
- 11.1.4.2. Products
- 11.1.4.3. Company Financials
- 11.1.4.4. SWOT Analysis
- 11.1.5 Google LLC (ALPHABET INC )
- 11.1.5.1. Company Overview
- 11.1.5.2. Products
- 11.1.5.3. Company Financials
- 11.1.5.4. SWOT Analysis
- 11.1.6 Realwear Inc
- 11.1.6.1. Company Overview
- 11.1.6.2. Products
- 11.1.6.3. Company Financials
- 11.1.6.4. SWOT Analysis
- 11.1.7 Kopin Corporation
- 11.1.7.1. Company Overview
- 11.1.7.2. Products
- 11.1.7.3. Company Financials
- 11.1.7.4. SWOT Analysis
- 11.1.8 Optinvent
- 11.1.8.1. Company Overview
- 11.1.8.2. Products
- 11.1.8.3. Company Financials
- 11.1.8.4. SWOT Analysis
- 11.1.9 Daqri
- 11.1.9.1. Company Overview
- 11.1.9.2. Products
- 11.1.9.3. Company Financials
- 11.1.9.4. SWOT Analysis
- 11.1.10 Dynabook Europe GmbH
- 11.1.10.1. Company Overview
- 11.1.10.2. Products
- 11.1.10.3. Company Financials
- 11.1.10.4. SWOT Analysis
- 11.1.1 Fujitsu Limited
- 11.2. Market Entropy
- 11.2.1 Company's Key Areas Served
- 11.2.2 Recent Developments
- 11.3. Company Market Share Analysis 2025
- 11.3.1 Top 5 Companies Market Share Analysis
- 11.3.2 Top 3 Companies Market Share Analysis
- 11.4. List of Potential Customers
- 12. Research Methodology
List of Figures
- Figure 1: Global Mobile Augmented Reality Market Revenue Breakdown (Million, %) by Region 2025 & 2033
- Figure 2: Global Mobile Augmented Reality Market Volume Breakdown (K Unit, %) by Region 2025 & 2033
- Figure 3: North America Mobile Augmented Reality Market Revenue (Million), by Type 2025 & 2033
- Figure 4: North America Mobile Augmented Reality Market Volume (K Unit), by Type 2025 & 2033
- Figure 5: North America Mobile Augmented Reality Market Revenue Share (%), by Type 2025 & 2033
- Figure 6: North America Mobile Augmented Reality Market Volume Share (%), by Type 2025 & 2033
- Figure 7: North America Mobile Augmented Reality Market Revenue (Million), by End User 2025 & 2033
- Figure 8: North America Mobile Augmented Reality Market Volume (K Unit), by End User 2025 & 2033
- Figure 9: North America Mobile Augmented Reality Market Revenue Share (%), by End User 2025 & 2033
- Figure 10: North America Mobile Augmented Reality Market Volume Share (%), by End User 2025 & 2033
- Figure 11: North America Mobile Augmented Reality Market Revenue (Million), by Software 2025 & 2033
- Figure 12: North America Mobile Augmented Reality Market Volume (K Unit), by Software 2025 & 2033
- Figure 13: North America Mobile Augmented Reality Market Revenue Share (%), by Software 2025 & 2033
- Figure 14: North America Mobile Augmented Reality Market Volume Share (%), by Software 2025 & 2033
- Figure 15: North America Mobile Augmented Reality Market Revenue (Million), by Country 2025 & 2033
- Figure 16: North America Mobile Augmented Reality Market Volume (K Unit), by Country 2025 & 2033
- Figure 17: North America Mobile Augmented Reality Market Revenue Share (%), by Country 2025 & 2033
- Figure 18: North America Mobile Augmented Reality Market Volume Share (%), by Country 2025 & 2033
- Figure 19: Europe Mobile Augmented Reality Market Revenue (Million), by Type 2025 & 2033
- Figure 20: Europe Mobile Augmented Reality Market Volume (K Unit), by Type 2025 & 2033
- Figure 21: Europe Mobile Augmented Reality Market Revenue Share (%), by Type 2025 & 2033
- Figure 22: Europe Mobile Augmented Reality Market Volume Share (%), by Type 2025 & 2033
- Figure 23: Europe Mobile Augmented Reality Market Revenue (Million), by End User 2025 & 2033
- Figure 24: Europe Mobile Augmented Reality Market Volume (K Unit), by End User 2025 & 2033
- Figure 25: Europe Mobile Augmented Reality Market Revenue Share (%), by End User 2025 & 2033
- Figure 26: Europe Mobile Augmented Reality Market Volume Share (%), by End User 2025 & 2033
- Figure 27: Europe Mobile Augmented Reality Market Revenue (Million), by Software 2025 & 2033
- Figure 28: Europe Mobile Augmented Reality Market Volume (K Unit), by Software 2025 & 2033
- Figure 29: Europe Mobile Augmented Reality Market Revenue Share (%), by Software 2025 & 2033
- Figure 30: Europe Mobile Augmented Reality Market Volume Share (%), by Software 2025 & 2033
- Figure 31: Europe Mobile Augmented Reality Market Revenue (Million), by Country 2025 & 2033
- Figure 32: Europe Mobile Augmented Reality Market Volume (K Unit), by Country 2025 & 2033
- Figure 33: Europe Mobile Augmented Reality Market Revenue Share (%), by Country 2025 & 2033
- Figure 34: Europe Mobile Augmented Reality Market Volume Share (%), by Country 2025 & 2033
- Figure 35: Asia Pacific Mobile Augmented Reality Market Revenue (Million), by Type 2025 & 2033
- Figure 36: Asia Pacific Mobile Augmented Reality Market Volume (K Unit), by Type 2025 & 2033
- Figure 37: Asia Pacific Mobile Augmented Reality Market Revenue Share (%), by Type 2025 & 2033
- Figure 38: Asia Pacific Mobile Augmented Reality Market Volume Share (%), by Type 2025 & 2033
- Figure 39: Asia Pacific Mobile Augmented Reality Market Revenue (Million), by End User 2025 & 2033
- Figure 40: Asia Pacific Mobile Augmented Reality Market Volume (K Unit), by End User 2025 & 2033
- Figure 41: Asia Pacific Mobile Augmented Reality Market Revenue Share (%), by End User 2025 & 2033
- Figure 42: Asia Pacific Mobile Augmented Reality Market Volume Share (%), by End User 2025 & 2033
- Figure 43: Asia Pacific Mobile Augmented Reality Market Revenue (Million), by Software 2025 & 2033
- Figure 44: Asia Pacific Mobile Augmented Reality Market Volume (K Unit), by Software 2025 & 2033
- Figure 45: Asia Pacific Mobile Augmented Reality Market Revenue Share (%), by Software 2025 & 2033
- Figure 46: Asia Pacific Mobile Augmented Reality Market Volume Share (%), by Software 2025 & 2033
- Figure 47: Asia Pacific Mobile Augmented Reality Market Revenue (Million), by Country 2025 & 2033
- Figure 48: Asia Pacific Mobile Augmented Reality Market Volume (K Unit), by Country 2025 & 2033
- Figure 49: Asia Pacific Mobile Augmented Reality Market Revenue Share (%), by Country 2025 & 2033
- Figure 50: Asia Pacific Mobile Augmented Reality Market Volume Share (%), by Country 2025 & 2033
- Figure 51: Rest of the World Mobile Augmented Reality Market Revenue (Million), by Type 2025 & 2033
- Figure 52: Rest of the World Mobile Augmented Reality Market Volume (K Unit), by Type 2025 & 2033
- Figure 53: Rest of the World Mobile Augmented Reality Market Revenue Share (%), by Type 2025 & 2033
- Figure 54: Rest of the World Mobile Augmented Reality Market Volume Share (%), by Type 2025 & 2033
- Figure 55: Rest of the World Mobile Augmented Reality Market Revenue (Million), by End User 2025 & 2033
- Figure 56: Rest of the World Mobile Augmented Reality Market Volume (K Unit), by End User 2025 & 2033
- Figure 57: Rest of the World Mobile Augmented Reality Market Revenue Share (%), by End User 2025 & 2033
- Figure 58: Rest of the World Mobile Augmented Reality Market Volume Share (%), by End User 2025 & 2033
- Figure 59: Rest of the World Mobile Augmented Reality Market Revenue (Million), by Software 2025 & 2033
- Figure 60: Rest of the World Mobile Augmented Reality Market Volume (K Unit), by Software 2025 & 2033
- Figure 61: Rest of the World Mobile Augmented Reality Market Revenue Share (%), by Software 2025 & 2033
- Figure 62: Rest of the World Mobile Augmented Reality Market Volume Share (%), by Software 2025 & 2033
- Figure 63: Rest of the World Mobile Augmented Reality Market Revenue (Million), by Country 2025 & 2033
- Figure 64: Rest of the World Mobile Augmented Reality Market Volume (K Unit), by Country 2025 & 2033
- Figure 65: Rest of the World Mobile Augmented Reality Market Revenue Share (%), by Country 2025 & 2033
- Figure 66: Rest of the World Mobile Augmented Reality Market Volume Share (%), by Country 2025 & 2033
List of Tables
- Table 1: Global Mobile Augmented Reality Market Revenue Million Forecast, by Type 2020 & 2033
- Table 2: Global Mobile Augmented Reality Market Volume K Unit Forecast, by Type 2020 & 2033
- Table 3: Global Mobile Augmented Reality Market Revenue Million Forecast, by End User 2020 & 2033
- Table 4: Global Mobile Augmented Reality Market Volume K Unit Forecast, by End User 2020 & 2033
- Table 5: Global Mobile Augmented Reality Market Revenue Million Forecast, by Software 2020 & 2033
- Table 6: Global Mobile Augmented Reality Market Volume K Unit Forecast, by Software 2020 & 2033
- Table 7: Global Mobile Augmented Reality Market Revenue Million Forecast, by Region 2020 & 2033
- Table 8: Global Mobile Augmented Reality Market Volume K Unit Forecast, by Region 2020 & 2033
- Table 9: Global Mobile Augmented Reality Market Revenue Million Forecast, by Type 2020 & 2033
- Table 10: Global Mobile Augmented Reality Market Volume K Unit Forecast, by Type 2020 & 2033
- Table 11: Global Mobile Augmented Reality Market Revenue Million Forecast, by End User 2020 & 2033
- Table 12: Global Mobile Augmented Reality Market Volume K Unit Forecast, by End User 2020 & 2033
- Table 13: Global Mobile Augmented Reality Market Revenue Million Forecast, by Software 2020 & 2033
- Table 14: Global Mobile Augmented Reality Market Volume K Unit Forecast, by Software 2020 & 2033
- Table 15: Global Mobile Augmented Reality Market Revenue Million Forecast, by Country 2020 & 2033
- Table 16: Global Mobile Augmented Reality Market Volume K Unit Forecast, by Country 2020 & 2033
- Table 17: US Mobile Augmented Reality Market Revenue (Million) Forecast, by Application 2020 & 2033
- Table 18: US Mobile Augmented Reality Market Volume (K Unit) Forecast, by Application 2020 & 2033
- Table 19: Canada Mobile Augmented Reality Market Revenue (Million) Forecast, by Application 2020 & 2033
- Table 20: Canada Mobile Augmented Reality Market Volume (K Unit) Forecast, by Application 2020 & 2033
- Table 21: Global Mobile Augmented Reality Market Revenue Million Forecast, by Type 2020 & 2033
- Table 22: Global Mobile Augmented Reality Market Volume K Unit Forecast, by Type 2020 & 2033
- Table 23: Global Mobile Augmented Reality Market Revenue Million Forecast, by End User 2020 & 2033
- Table 24: Global Mobile Augmented Reality Market Volume K Unit Forecast, by End User 2020 & 2033
- Table 25: Global Mobile Augmented Reality Market Revenue Million Forecast, by Software 2020 & 2033
- Table 26: Global Mobile Augmented Reality Market Volume K Unit Forecast, by Software 2020 & 2033
- Table 27: Global Mobile Augmented Reality Market Revenue Million Forecast, by Country 2020 & 2033
- Table 28: Global Mobile Augmented Reality Market Volume K Unit Forecast, by Country 2020 & 2033
- Table 29: Germany Mobile Augmented Reality Market Revenue (Million) Forecast, by Application 2020 & 2033
- Table 30: Germany Mobile Augmented Reality Market Volume (K Unit) Forecast, by Application 2020 & 2033
- Table 31: UK Mobile Augmented Reality Market Revenue (Million) Forecast, by Application 2020 & 2033
- Table 32: UK Mobile Augmented Reality Market Volume (K Unit) Forecast, by Application 2020 & 2033
- Table 33: France Mobile Augmented Reality Market Revenue (Million) Forecast, by Application 2020 & 2033
- Table 34: France Mobile Augmented Reality Market Volume (K Unit) Forecast, by Application 2020 & 2033
- Table 35: Italy Mobile Augmented Reality Market Revenue (Million) Forecast, by Application 2020 & 2033
- Table 36: Italy Mobile Augmented Reality Market Volume (K Unit) Forecast, by Application 2020 & 2033
- Table 37: Rest of Europe Mobile Augmented Reality Market Revenue (Million) Forecast, by Application 2020 & 2033
- Table 38: Rest of Europe Mobile Augmented Reality Market Volume (K Unit) Forecast, by Application 2020 & 2033
- Table 39: Global Mobile Augmented Reality Market Revenue Million Forecast, by Type 2020 & 2033
- Table 40: Global Mobile Augmented Reality Market Volume K Unit Forecast, by Type 2020 & 2033
- Table 41: Global Mobile Augmented Reality Market Revenue Million Forecast, by End User 2020 & 2033
- Table 42: Global Mobile Augmented Reality Market Volume K Unit Forecast, by End User 2020 & 2033
- Table 43: Global Mobile Augmented Reality Market Revenue Million Forecast, by Software 2020 & 2033
- Table 44: Global Mobile Augmented Reality Market Volume K Unit Forecast, by Software 2020 & 2033
- Table 45: Global Mobile Augmented Reality Market Revenue Million Forecast, by Country 2020 & 2033
- Table 46: Global Mobile Augmented Reality Market Volume K Unit Forecast, by Country 2020 & 2033
- Table 47: India Mobile Augmented Reality Market Revenue (Million) Forecast, by Application 2020 & 2033
- Table 48: India Mobile Augmented Reality Market Volume (K Unit) Forecast, by Application 2020 & 2033
- Table 49: China Mobile Augmented Reality Market Revenue (Million) Forecast, by Application 2020 & 2033
- Table 50: China Mobile Augmented Reality Market Volume (K Unit) Forecast, by Application 2020 & 2033
- Table 51: Japan Mobile Augmented Reality Market Revenue (Million) Forecast, by Application 2020 & 2033
- Table 52: Japan Mobile Augmented Reality Market Volume (K Unit) Forecast, by Application 2020 & 2033
- Table 53: Rest of Asia Pacific Mobile Augmented Reality Market Revenue (Million) Forecast, by Application 2020 & 2033
- Table 54: Rest of Asia Pacific Mobile Augmented Reality Market Volume (K Unit) Forecast, by Application 2020 & 2033
- Table 55: Global Mobile Augmented Reality Market Revenue Million Forecast, by Type 2020 & 2033
- Table 56: Global Mobile Augmented Reality Market Volume K Unit Forecast, by Type 2020 & 2033
- Table 57: Global Mobile Augmented Reality Market Revenue Million Forecast, by End User 2020 & 2033
- Table 58: Global Mobile Augmented Reality Market Volume K Unit Forecast, by End User 2020 & 2033
- Table 59: Global Mobile Augmented Reality Market Revenue Million Forecast, by Software 2020 & 2033
- Table 60: Global Mobile Augmented Reality Market Volume K Unit Forecast, by Software 2020 & 2033
- Table 61: Global Mobile Augmented Reality Market Revenue Million Forecast, by Country 2020 & 2033
- Table 62: Global Mobile Augmented Reality Market Volume K Unit Forecast, by Country 2020 & 2033
Frequently Asked Questions
1. What is the projected Compound Annual Growth Rate (CAGR) of the Mobile Augmented Reality Market?
The projected CAGR is approximately 42.36%.
2. Which companies are prominent players in the Mobile Augmented Reality Market?
Key companies in the market include Fujitsu Limited, Lenovo Group Limited, Vuzix Corporation, Seiko Epson Corporation, Google LLC (ALPHABET INC ), Realwear Inc, Kopin Corporation, Optinvent, Daqri, Dynabook Europe GmbH.
3. What are the main segments of the Mobile Augmented Reality Market?
The market segments include Type, End User, Software.
4. Can you provide details about the market size?
The market size is estimated to be USD 42.48 Million as of 2022.
5. What are some drivers contributing to market growth?
Increasing Applications of Augmented Reality; High Demand for Mobile-based Augmented Reality.
6. What are the notable trends driving market growth?
Hardware to Exhibit Higher Growth.
7. Are there any restraints impacting market growth?
Security Issues Associated with Mobile Payments.
8. Can you provide examples of recent developments in the market?
January 2022 - Qualcomm and Microsoft announced a partnership to advance and accelerate augmented reality and open up new portals to the metaverse. The businesses will work together to design unique augmented reality chips and integrate software platforms.
9. What pricing options are available for accessing the report?
Pricing options include single-user, multi-user, and enterprise licenses priced at USD 4750, USD 5250, and USD 8750 respectively.
10. Is the market size provided in terms of value or volume?
The market size is provided in terms of value, measured in Million and volume, measured in K Unit.
11. Are there any specific market keywords associated with the report?
Yes, the market keyword associated with the report is "Mobile Augmented Reality Market," which aids in identifying and referencing the specific market segment covered.
12. How do I determine which pricing option suits my needs best?
The pricing options vary based on user requirements and access needs. Individual users may opt for single-user licenses, while businesses requiring broader access may choose multi-user or enterprise licenses for cost-effective access to the report.
13. Are there any additional resources or data provided in the Mobile Augmented Reality Market report?
While the report offers comprehensive insights, it's advisable to review the specific contents or supplementary materials provided to ascertain if additional resources or data are available.
14. How can I stay updated on further developments or reports in the Mobile Augmented Reality Market?
To stay informed about further developments, trends, and reports in the Mobile Augmented Reality Market, consider subscribing to industry newsletters, following relevant companies and organizations, or regularly checking reputable industry news sources and publications.
Methodology
Step 1 - Identification of Relevant Samples Size from Population Database


Step 2 - Approaches for Defining Global Market Size (Value, Volume* & Price*)

Note*: In applicable scenarios
Step 3 - Data Sources
Primary Research
- Web Analytics
- Survey Reports
- Research Institute
- Latest Research Reports
- Opinion Leaders
Secondary Research
- Annual Reports
- White Paper
- Latest Press Release
- Industry Association
- Paid Database
- Investor Presentations

Step 4 - Data Triangulation
Involves using different sources of information in order to increase the validity of a study
These sources are likely to be stakeholders in a program - participants, other researchers, program staff, other community members, and so on.
Then we put all data in single framework & apply various statistical tools to find out the dynamic on the market.
During the analysis stage, feedback from the stakeholder groups would be compared to determine areas of agreement as well as areas of divergence