

Key Insights
The mobile phone 3D glass back cover market is experiencing significant expansion, driven by escalating consumer demand for sophisticated and durable smartphone designs. The market, projected to reach $27.3 billion by 2025, is forecast to grow at a Compound Annual Growth Rate (CAGR) of 5.6% from 2025 to 2033, achieving an estimated size of approximately $45 billion by 2033. This growth trajectory is propelled by several pivotal factors. The increasing adoption of premium smartphones, which predominantly feature 3D glass back covers for enhanced aesthetics and perceived value, is a primary driver. Concurrently, advancements in glass manufacturing technologies are enabling the production of thinner, lighter, and more resilient glass, further stimulating market penetration. The integration of in-glass fingerprint sensors and wireless charging capabilities also contributes to the escalating demand for these specialized glass covers. However, the market faces challenges, including higher production costs relative to alternative materials such as plastic, and potential supply chain volatility impacting component availability.
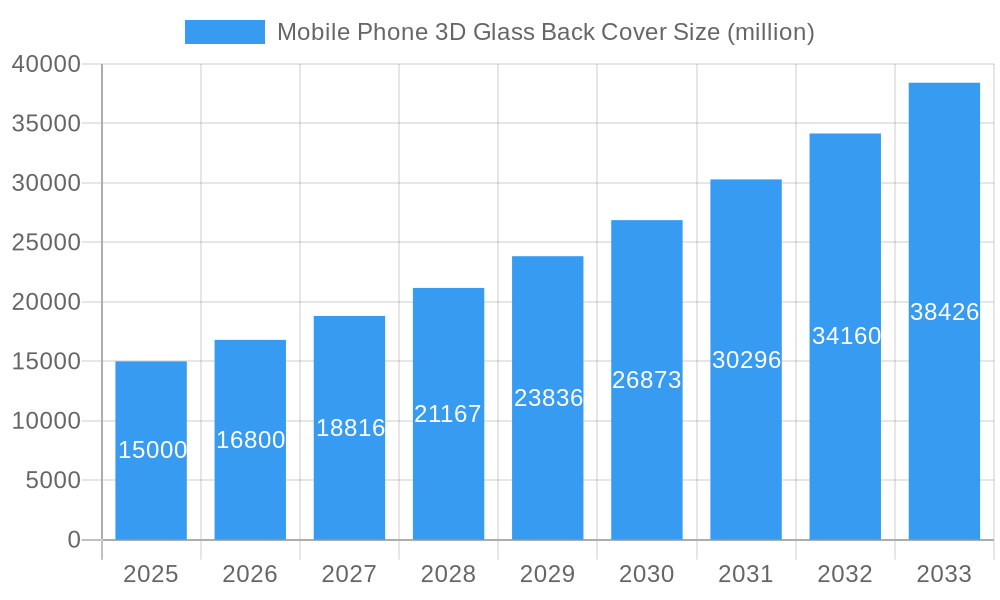
Mobile Phone 3D Glass Back Cover Market Size (In Billion)
The market is segmented by glass type (e.g., Gorilla Glass, Asahi Glass), application (flagship, mid-range, and budget smartphones), and geographical region. Leading market participants include Corning, Schott, AGC, and Lens Technology, alongside other prominent specialists in glass processing and assembly. Asia, particularly China and South Korea, exhibits a strong market presence, attributed to the high concentration of smartphone manufacturing hubs. North America and Europe also represent substantial markets, driven by high per-capita smartphone ownership and a preference for premium devices. Strategic collaborations between glass manufacturers and smartphone original equipment manufacturers (OEMs) are anticipated to foster continued innovation and market expansion in the coming years, potentially ushering in new technologies and material advancements that will shape future market growth.
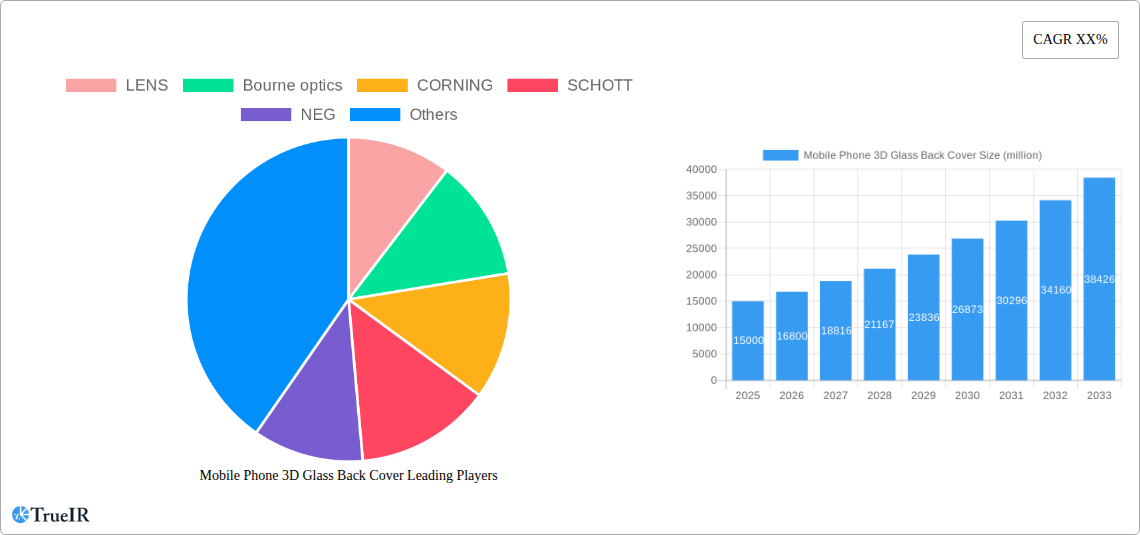
Mobile Phone 3D Glass Back Cover Company Market Share
This comprehensive report offers an in-depth analysis of the global mobile phone 3D glass back cover market, providing critical insights for industry stakeholders, investors, and researchers. The analysis covers the period from 2019 to 2033, with a specific focus on the estimated market size for 2025 and a forecast period of 2025-2033. Utilizing extensive market research, including both quantitative data and qualitative analysis, this study details the market's structure, prevailing trends, emerging opportunities, and inherent challenges. This detailed investigation assesses a market valued at millions, projecting robust growth throughout the forecast period.
Mobile Phone 3D Glass Back Cover Market Structure & Competitive Landscape
The global mobile phone 3D glass back cover market is characterized by a moderately concentrated competitive landscape. Key players, including LENS, Bourne Optics, CORNING, SCHOTT, NEG, AGC, First-panel, FOXCONN, Holitech Technology, KMTC, and Gtoc, control a significant portion of the market share, estimated at xx% in 2025. The market's concentration ratio (CR4) is projected to be xx in 2025, indicating a moderate level of competition. Innovation plays a crucial role, with companies constantly striving to improve glass strength, durability, and aesthetic appeal. Regulatory impacts, particularly concerning material safety and environmental standards, significantly influence market dynamics. The market experiences some degree of substitution with alternative materials like plastic and metal, though glass maintains a dominant position due to its premium aesthetics and feel. End-user segmentation primarily focuses on smartphone manufacturers and third-party accessory providers. M&A activity has been moderate, with xx major mergers and acquisitions recorded between 2019 and 2024, largely driven by consolidation efforts and the acquisition of specialized technologies.
- Market Concentration: Moderately concentrated, with a CR4 of xx in 2025.
- Innovation Drivers: Improved glass strength, durability, and aesthetic design.
- Regulatory Impacts: Stringent safety and environmental regulations.
- Product Substitutes: Plastic and metal back covers, though glass remains dominant.
- End-User Segmentation: Smartphone manufacturers and third-party accessory providers.
- M&A Trends: Moderate activity (xx major deals between 2019 and 2024) driven by consolidation and technology acquisition.
Mobile Phone 3D Glass Back Cover Market Trends & Opportunities
The mobile phone 3D glass back cover market exhibits substantial growth potential, driven by several key factors. The market size is projected to reach millions by 2033, exhibiting a CAGR of xx% during the forecast period (2025-2033). Technological advancements, particularly in glass processing and strengthening techniques (e.g., ion-exchange, chemical strengthening), are constantly expanding the capabilities and applications of 3D glass back covers. Consumer preference for aesthetically pleasing and durable smartphones fuels demand. Competitive dynamics are intensifying, with companies focusing on innovation, cost optimization, and supply chain efficiency. Market penetration rates are expected to increase significantly in emerging markets, driven by rising smartphone adoption. Opportunities exist in developing advanced functionalities, such as embedded sensors and wireless charging capabilities, directly within the 3D glass.
Dominant Markets & Segments in Mobile Phone 3D Glass Back Cover
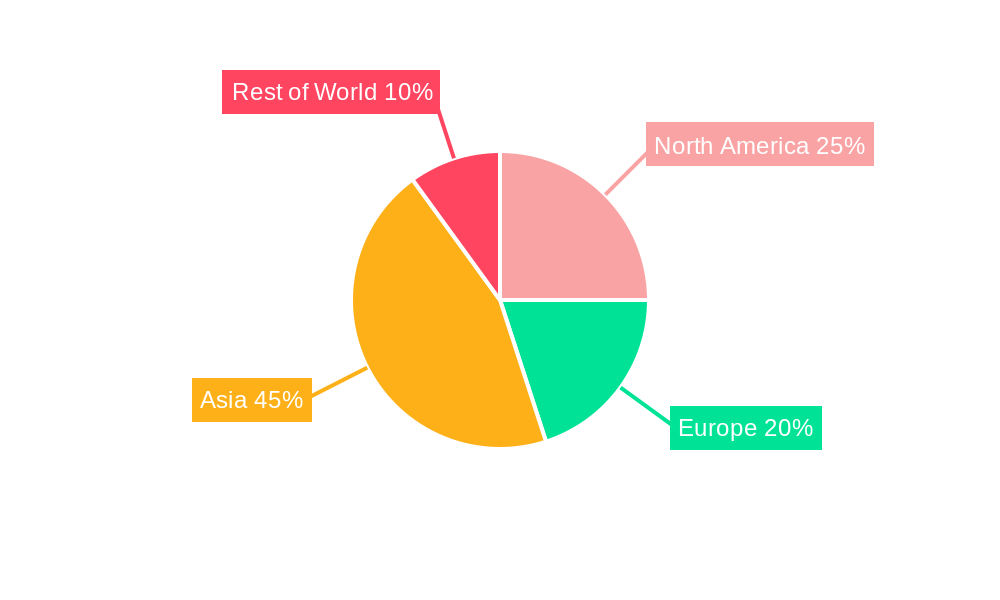
The Asia-Pacific region currently dominates the global market for mobile phone 3D glass back covers, accounting for an estimated xx% of global revenue in 2025. This dominance is largely attributed to:
- High Smartphone Production: Major smartphone manufacturers are concentrated in this region.
- Growing Middle Class: Increasing disposable incomes drive demand for premium smartphones.
- Favorable Government Policies: Supportive policies promoting technological advancement and manufacturing.
Within the Asia-Pacific region, China and India are the leading national markets, exhibiting exceptionally strong growth trajectories. The high-end segment of the market, featuring premium glass with enhanced features, represents a significant opportunity for growth.
Mobile Phone 3D Glass Back Cover Product Analysis
Technological advancements in glass processing, including improved strengthening techniques and the incorporation of new materials, are leading to more durable, scratch-resistant, and aesthetically pleasing 3D glass back covers. These innovations are directly impacting market fit by allowing for thinner designs, more intricate curves, and improved functionality. The integration of in-glass sensors and wireless charging capabilities enhances the competitive advantages of these products, attracting consumers seeking higher-end features.
Key Drivers, Barriers & Challenges in Mobile Phone 3D Glass Back Cover
Key Drivers: Technological advancements, such as improved strengthening techniques and the incorporation of new materials (e.g., stronger, thinner glass) drive market growth. Rising disposable incomes in emerging markets fuel demand for premium smartphones. Government support for technological innovation and manufacturing contributes significantly.
Key Challenges: Supply chain disruptions, particularly regarding raw material availability and geopolitical uncertainties, pose significant risks. Stringent environmental regulations and concerns about e-waste management present challenges. Intense competition among manufacturers puts pressure on pricing and profit margins. The estimated impact of these challenges on market growth is projected at a reduction of xx% in 2025.
Growth Drivers in the Mobile Phone 3D Glass Back Cover Market
Technological innovation in glass strengthening, enhanced durability, and the integration of advanced functionalities are key growth drivers. The increasing adoption of premium smartphones in emerging economies and favorable government policies supporting technological advancements are other important factors.
Challenges Impacting Mobile Phone 3D Glass Back Cover Growth
Supply chain vulnerabilities, stringent environmental regulations impacting raw material sourcing, and intense competition among manufacturers causing price pressure are significant challenges impacting market growth. Geopolitical instability and potential trade conflicts further exacerbate these issues.
Key Players Shaping the Mobile Phone 3D Glass Back Cover Market
- LENS
- Bourne Optics
- CORNING
- SCHOTT
- NEG
- AGC
- First-panel
- FOXCONN
- Holitech Technology
- KMTC
- Gtoc
Significant Mobile Phone 3D Glass Back Cover Industry Milestones
- 2020-Q4: LENS introduces a new strengthened glass with improved scratch resistance.
- 2021-Q2: CORNING patents a novel glass processing technique enabling thinner, more flexible glass.
- 2022-Q3: A major merger between two key players in the market reshapes the competitive landscape.
- 2023-Q1: New environmental regulations in key markets impact material sourcing and manufacturing processes.
Future Outlook for Mobile Phone 3D Glass Back Cover Market
The mobile phone 3D glass back cover market is poised for continued growth, driven by technological advancements in glass processing, increasing smartphone adoption in emerging economies, and the ongoing demand for premium devices with aesthetically pleasing designs. Strategic opportunities exist in developing innovative products with enhanced functionalities, such as integrated sensors and wireless charging, and focusing on sustainable manufacturing practices to address environmental concerns. The market's projected growth remains strong, with a positive outlook for the coming decade.
Mobile Phone 3D Glass Back Cover Segmentation
-
1. Application
- 1.1. Smart Phone
- 1.2. Feature Phone
-
2. Types
- 2.1. iPhone Model
- 2.2. Huawei Model
- 2.3. Xiaomi Model
- 2.4. Samsung Model
- 2.5. Others
Mobile Phone 3D Glass Back Cover Segmentation By Geography
-
1. North America
- 1.1. United States
- 1.2. Canada
- 1.3. Mexico
-
2. South America
- 2.1. Brazil
- 2.2. Argentina
- 2.3. Rest of South America
-
3. Europe
- 3.1. United Kingdom
- 3.2. Germany
- 3.3. France
- 3.4. Italy
- 3.5. Spain
- 3.6. Russia
- 3.7. Benelux
- 3.8. Nordics
- 3.9. Rest of Europe
-
4. Middle East & Africa
- 4.1. Turkey
- 4.2. Israel
- 4.3. GCC
- 4.4. North Africa
- 4.5. South Africa
- 4.6. Rest of Middle East & Africa
-
5. Asia Pacific
- 5.1. China
- 5.2. India
- 5.3. Japan
- 5.4. South Korea
- 5.5. ASEAN
- 5.6. Oceania
- 5.7. Rest of Asia Pacific
Mobile Phone 3D Glass Back Cover Regional Market Share
Geographic Coverage of Mobile Phone 3D Glass Back Cover
Mobile Phone 3D Glass Back Cover REPORT HIGHLIGHTS
| Aspects | Details |
|---|---|
| Study Period | 2020-2034 |
| Base Year | 2025 |
| Estimated Year | 2026 |
| Forecast Period | 2026-2034 |
| Historical Period | 2020-2025 |
| Growth Rate | CAGR of 5.6% from 2020-2034 |
| Segmentation |
|
Table of Contents
- 1. Introduction
- 1.1. Research Scope
- 1.2. Market Segmentation
- 1.3. Research Objective
- 1.4. Definitions and Assumptions
- 2. Executive Summary
- 2.1. Market Snapshot
- 3. Market Dynamics
- 3.1. Market Drivers
- 3.2. Market Restrains
- 3.3. Market Trends
- 3.4. Market Opportunities
- 4. Market Factor Analysis
- 4.1. Porters Five Forces
- 4.1.1. Bargaining Power of Suppliers
- 4.1.2. Bargaining Power of Buyers
- 4.1.3. Threat of New Entrants
- 4.1.4. Threat of Substitutes
- 4.1.5. Competitive Rivalry
- 4.2. PESTEL analysis
- 4.3. BCG Analysis
- 4.3.1. Stars (High Growth, High Market Share)
- 4.3.2. Cash Cows (Low Growth, High Market Share)
- 4.3.3. Question Mark (High Growth, Low Market Share)
- 4.3.4. Dogs (Low Growth, Low Market Share)
- 4.4. Ansoff Matrix Analysis
- 4.5. Supply Chain Analysis
- 4.6. Regulatory Landscape
- 4.7. Current Market Potential and Opportunity Assessment (TAM–SAM–SOM Framework)
- 4.8. TIR Analyst Note
- 4.1. Porters Five Forces
- 5. Market Analysis, Insights and Forecast 2021-2033
- 5.1. Market Analysis, Insights and Forecast - by Application
- 5.1.1. Smart Phone
- 5.1.2. Feature Phone
- 5.2. Market Analysis, Insights and Forecast - by Types
- 5.2.1. iPhone Model
- 5.2.2. Huawei Model
- 5.2.3. Xiaomi Model
- 5.2.4. Samsung Model
- 5.2.5. Others
- 5.3. Market Analysis, Insights and Forecast - by Region
- 5.3.1. North America
- 5.3.2. South America
- 5.3.3. Europe
- 5.3.4. Middle East & Africa
- 5.3.5. Asia Pacific
- 5.1. Market Analysis, Insights and Forecast - by Application
- 6. Global Mobile Phone 3D Glass Back Cover Analysis, Insights and Forecast, 2021-2033
- 6.1. Market Analysis, Insights and Forecast - by Application
- 6.1.1. Smart Phone
- 6.1.2. Feature Phone
- 6.2. Market Analysis, Insights and Forecast - by Types
- 6.2.1. iPhone Model
- 6.2.2. Huawei Model
- 6.2.3. Xiaomi Model
- 6.2.4. Samsung Model
- 6.2.5. Others
- 6.1. Market Analysis, Insights and Forecast - by Application
- 7. North America Mobile Phone 3D Glass Back Cover Analysis, Insights and Forecast, 2020-2032
- 7.1. Market Analysis, Insights and Forecast - by Application
- 7.1.1. Smart Phone
- 7.1.2. Feature Phone
- 7.2. Market Analysis, Insights and Forecast - by Types
- 7.2.1. iPhone Model
- 7.2.2. Huawei Model
- 7.2.3. Xiaomi Model
- 7.2.4. Samsung Model
- 7.2.5. Others
- 7.1. Market Analysis, Insights and Forecast - by Application
- 8. South America Mobile Phone 3D Glass Back Cover Analysis, Insights and Forecast, 2020-2032
- 8.1. Market Analysis, Insights and Forecast - by Application
- 8.1.1. Smart Phone
- 8.1.2. Feature Phone
- 8.2. Market Analysis, Insights and Forecast - by Types
- 8.2.1. iPhone Model
- 8.2.2. Huawei Model
- 8.2.3. Xiaomi Model
- 8.2.4. Samsung Model
- 8.2.5. Others
- 8.1. Market Analysis, Insights and Forecast - by Application
- 9. Europe Mobile Phone 3D Glass Back Cover Analysis, Insights and Forecast, 2020-2032
- 9.1. Market Analysis, Insights and Forecast - by Application
- 9.1.1. Smart Phone
- 9.1.2. Feature Phone
- 9.2. Market Analysis, Insights and Forecast - by Types
- 9.2.1. iPhone Model
- 9.2.2. Huawei Model
- 9.2.3. Xiaomi Model
- 9.2.4. Samsung Model
- 9.2.5. Others
- 9.1. Market Analysis, Insights and Forecast - by Application
- 10. Middle East & Africa Mobile Phone 3D Glass Back Cover Analysis, Insights and Forecast, 2020-2032
- 10.1. Market Analysis, Insights and Forecast - by Application
- 10.1.1. Smart Phone
- 10.1.2. Feature Phone
- 10.2. Market Analysis, Insights and Forecast - by Types
- 10.2.1. iPhone Model
- 10.2.2. Huawei Model
- 10.2.3. Xiaomi Model
- 10.2.4. Samsung Model
- 10.2.5. Others
- 10.1. Market Analysis, Insights and Forecast - by Application
- 11. Asia Pacific Mobile Phone 3D Glass Back Cover Analysis, Insights and Forecast, 2020-2032
- 11.1. Market Analysis, Insights and Forecast - by Application
- 11.1.1. Smart Phone
- 11.1.2. Feature Phone
- 11.2. Market Analysis, Insights and Forecast - by Types
- 11.2.1. iPhone Model
- 11.2.2. Huawei Model
- 11.2.3. Xiaomi Model
- 11.2.4. Samsung Model
- 11.2.5. Others
- 11.1. Market Analysis, Insights and Forecast - by Application
- 12. Competitive Analysis
- 12.1. Company Profiles
- 12.1.1 LENS
- 12.1.1.1. Company Overview
- 12.1.1.2. Products
- 12.1.1.3. Company Financials
- 12.1.1.4. SWOT Analysis
- 12.1.2 Bourne optics
- 12.1.2.1. Company Overview
- 12.1.2.2. Products
- 12.1.2.3. Company Financials
- 12.1.2.4. SWOT Analysis
- 12.1.3 CORNING
- 12.1.3.1. Company Overview
- 12.1.3.2. Products
- 12.1.3.3. Company Financials
- 12.1.3.4. SWOT Analysis
- 12.1.4 SCHOTT
- 12.1.4.1. Company Overview
- 12.1.4.2. Products
- 12.1.4.3. Company Financials
- 12.1.4.4. SWOT Analysis
- 12.1.5 NEG
- 12.1.5.1. Company Overview
- 12.1.5.2. Products
- 12.1.5.3. Company Financials
- 12.1.5.4. SWOT Analysis
- 12.1.6 AGC
- 12.1.6.1. Company Overview
- 12.1.6.2. Products
- 12.1.6.3. Company Financials
- 12.1.6.4. SWOT Analysis
- 12.1.7 First-panel
- 12.1.7.1. Company Overview
- 12.1.7.2. Products
- 12.1.7.3. Company Financials
- 12.1.7.4. SWOT Analysis
- 12.1.8 FOXCONN
- 12.1.8.1. Company Overview
- 12.1.8.2. Products
- 12.1.8.3. Company Financials
- 12.1.8.4. SWOT Analysis
- 12.1.9 Holitech Technology
- 12.1.9.1. Company Overview
- 12.1.9.2. Products
- 12.1.9.3. Company Financials
- 12.1.9.4. SWOT Analysis
- 12.1.10 KMTC
- 12.1.10.1. Company Overview
- 12.1.10.2. Products
- 12.1.10.3. Company Financials
- 12.1.10.4. SWOT Analysis
- 12.1.11 Gtoc
- 12.1.11.1. Company Overview
- 12.1.11.2. Products
- 12.1.11.3. Company Financials
- 12.1.11.4. SWOT Analysis
- 12.1.1 LENS
- 12.2. Market Entropy
- 12.2.1 Company's Key Areas Served
- 12.2.2 Recent Developments
- 12.3. Company Market Share Analysis 2025
- 12.3.1 Top 5 Companies Market Share Analysis
- 12.3.2 Top 3 Companies Market Share Analysis
- 12.4. List of Potential Customers
- 13. Research Methodology
List of Figures
- Figure 1: Global Mobile Phone 3D Glass Back Cover Revenue Breakdown (billion, %) by Region 2025 & 2033
- Figure 2: North America Mobile Phone 3D Glass Back Cover Revenue (billion), by Application 2025 & 2033
- Figure 3: North America Mobile Phone 3D Glass Back Cover Revenue Share (%), by Application 2025 & 2033
- Figure 4: North America Mobile Phone 3D Glass Back Cover Revenue (billion), by Types 2025 & 2033
- Figure 5: North America Mobile Phone 3D Glass Back Cover Revenue Share (%), by Types 2025 & 2033
- Figure 6: North America Mobile Phone 3D Glass Back Cover Revenue (billion), by Country 2025 & 2033
- Figure 7: North America Mobile Phone 3D Glass Back Cover Revenue Share (%), by Country 2025 & 2033
- Figure 8: South America Mobile Phone 3D Glass Back Cover Revenue (billion), by Application 2025 & 2033
- Figure 9: South America Mobile Phone 3D Glass Back Cover Revenue Share (%), by Application 2025 & 2033
- Figure 10: South America Mobile Phone 3D Glass Back Cover Revenue (billion), by Types 2025 & 2033
- Figure 11: South America Mobile Phone 3D Glass Back Cover Revenue Share (%), by Types 2025 & 2033
- Figure 12: South America Mobile Phone 3D Glass Back Cover Revenue (billion), by Country 2025 & 2033
- Figure 13: South America Mobile Phone 3D Glass Back Cover Revenue Share (%), by Country 2025 & 2033
- Figure 14: Europe Mobile Phone 3D Glass Back Cover Revenue (billion), by Application 2025 & 2033
- Figure 15: Europe Mobile Phone 3D Glass Back Cover Revenue Share (%), by Application 2025 & 2033
- Figure 16: Europe Mobile Phone 3D Glass Back Cover Revenue (billion), by Types 2025 & 2033
- Figure 17: Europe Mobile Phone 3D Glass Back Cover Revenue Share (%), by Types 2025 & 2033
- Figure 18: Europe Mobile Phone 3D Glass Back Cover Revenue (billion), by Country 2025 & 2033
- Figure 19: Europe Mobile Phone 3D Glass Back Cover Revenue Share (%), by Country 2025 & 2033
- Figure 20: Middle East & Africa Mobile Phone 3D Glass Back Cover Revenue (billion), by Application 2025 & 2033
- Figure 21: Middle East & Africa Mobile Phone 3D Glass Back Cover Revenue Share (%), by Application 2025 & 2033
- Figure 22: Middle East & Africa Mobile Phone 3D Glass Back Cover Revenue (billion), by Types 2025 & 2033
- Figure 23: Middle East & Africa Mobile Phone 3D Glass Back Cover Revenue Share (%), by Types 2025 & 2033
- Figure 24: Middle East & Africa Mobile Phone 3D Glass Back Cover Revenue (billion), by Country 2025 & 2033
- Figure 25: Middle East & Africa Mobile Phone 3D Glass Back Cover Revenue Share (%), by Country 2025 & 2033
- Figure 26: Asia Pacific Mobile Phone 3D Glass Back Cover Revenue (billion), by Application 2025 & 2033
- Figure 27: Asia Pacific Mobile Phone 3D Glass Back Cover Revenue Share (%), by Application 2025 & 2033
- Figure 28: Asia Pacific Mobile Phone 3D Glass Back Cover Revenue (billion), by Types 2025 & 2033
- Figure 29: Asia Pacific Mobile Phone 3D Glass Back Cover Revenue Share (%), by Types 2025 & 2033
- Figure 30: Asia Pacific Mobile Phone 3D Glass Back Cover Revenue (billion), by Country 2025 & 2033
- Figure 31: Asia Pacific Mobile Phone 3D Glass Back Cover Revenue Share (%), by Country 2025 & 2033
List of Tables
- Table 1: Global Mobile Phone 3D Glass Back Cover Revenue billion Forecast, by Application 2020 & 2033
- Table 2: Global Mobile Phone 3D Glass Back Cover Revenue billion Forecast, by Types 2020 & 2033
- Table 3: Global Mobile Phone 3D Glass Back Cover Revenue billion Forecast, by Region 2020 & 2033
- Table 4: Global Mobile Phone 3D Glass Back Cover Revenue billion Forecast, by Application 2020 & 2033
- Table 5: Global Mobile Phone 3D Glass Back Cover Revenue billion Forecast, by Types 2020 & 2033
- Table 6: Global Mobile Phone 3D Glass Back Cover Revenue billion Forecast, by Country 2020 & 2033
- Table 7: United States Mobile Phone 3D Glass Back Cover Revenue (billion) Forecast, by Application 2020 & 2033
- Table 8: Canada Mobile Phone 3D Glass Back Cover Revenue (billion) Forecast, by Application 2020 & 2033
- Table 9: Mexico Mobile Phone 3D Glass Back Cover Revenue (billion) Forecast, by Application 2020 & 2033
- Table 10: Global Mobile Phone 3D Glass Back Cover Revenue billion Forecast, by Application 2020 & 2033
- Table 11: Global Mobile Phone 3D Glass Back Cover Revenue billion Forecast, by Types 2020 & 2033
- Table 12: Global Mobile Phone 3D Glass Back Cover Revenue billion Forecast, by Country 2020 & 2033
- Table 13: Brazil Mobile Phone 3D Glass Back Cover Revenue (billion) Forecast, by Application 2020 & 2033
- Table 14: Argentina Mobile Phone 3D Glass Back Cover Revenue (billion) Forecast, by Application 2020 & 2033
- Table 15: Rest of South America Mobile Phone 3D Glass Back Cover Revenue (billion) Forecast, by Application 2020 & 2033
- Table 16: Global Mobile Phone 3D Glass Back Cover Revenue billion Forecast, by Application 2020 & 2033
- Table 17: Global Mobile Phone 3D Glass Back Cover Revenue billion Forecast, by Types 2020 & 2033
- Table 18: Global Mobile Phone 3D Glass Back Cover Revenue billion Forecast, by Country 2020 & 2033
- Table 19: United Kingdom Mobile Phone 3D Glass Back Cover Revenue (billion) Forecast, by Application 2020 & 2033
- Table 20: Germany Mobile Phone 3D Glass Back Cover Revenue (billion) Forecast, by Application 2020 & 2033
- Table 21: France Mobile Phone 3D Glass Back Cover Revenue (billion) Forecast, by Application 2020 & 2033
- Table 22: Italy Mobile Phone 3D Glass Back Cover Revenue (billion) Forecast, by Application 2020 & 2033
- Table 23: Spain Mobile Phone 3D Glass Back Cover Revenue (billion) Forecast, by Application 2020 & 2033
- Table 24: Russia Mobile Phone 3D Glass Back Cover Revenue (billion) Forecast, by Application 2020 & 2033
- Table 25: Benelux Mobile Phone 3D Glass Back Cover Revenue (billion) Forecast, by Application 2020 & 2033
- Table 26: Nordics Mobile Phone 3D Glass Back Cover Revenue (billion) Forecast, by Application 2020 & 2033
- Table 27: Rest of Europe Mobile Phone 3D Glass Back Cover Revenue (billion) Forecast, by Application 2020 & 2033
- Table 28: Global Mobile Phone 3D Glass Back Cover Revenue billion Forecast, by Application 2020 & 2033
- Table 29: Global Mobile Phone 3D Glass Back Cover Revenue billion Forecast, by Types 2020 & 2033
- Table 30: Global Mobile Phone 3D Glass Back Cover Revenue billion Forecast, by Country 2020 & 2033
- Table 31: Turkey Mobile Phone 3D Glass Back Cover Revenue (billion) Forecast, by Application 2020 & 2033
- Table 32: Israel Mobile Phone 3D Glass Back Cover Revenue (billion) Forecast, by Application 2020 & 2033
- Table 33: GCC Mobile Phone 3D Glass Back Cover Revenue (billion) Forecast, by Application 2020 & 2033
- Table 34: North Africa Mobile Phone 3D Glass Back Cover Revenue (billion) Forecast, by Application 2020 & 2033
- Table 35: South Africa Mobile Phone 3D Glass Back Cover Revenue (billion) Forecast, by Application 2020 & 2033
- Table 36: Rest of Middle East & Africa Mobile Phone 3D Glass Back Cover Revenue (billion) Forecast, by Application 2020 & 2033
- Table 37: Global Mobile Phone 3D Glass Back Cover Revenue billion Forecast, by Application 2020 & 2033
- Table 38: Global Mobile Phone 3D Glass Back Cover Revenue billion Forecast, by Types 2020 & 2033
- Table 39: Global Mobile Phone 3D Glass Back Cover Revenue billion Forecast, by Country 2020 & 2033
- Table 40: China Mobile Phone 3D Glass Back Cover Revenue (billion) Forecast, by Application 2020 & 2033
- Table 41: India Mobile Phone 3D Glass Back Cover Revenue (billion) Forecast, by Application 2020 & 2033
- Table 42: Japan Mobile Phone 3D Glass Back Cover Revenue (billion) Forecast, by Application 2020 & 2033
- Table 43: South Korea Mobile Phone 3D Glass Back Cover Revenue (billion) Forecast, by Application 2020 & 2033
- Table 44: ASEAN Mobile Phone 3D Glass Back Cover Revenue (billion) Forecast, by Application 2020 & 2033
- Table 45: Oceania Mobile Phone 3D Glass Back Cover Revenue (billion) Forecast, by Application 2020 & 2033
- Table 46: Rest of Asia Pacific Mobile Phone 3D Glass Back Cover Revenue (billion) Forecast, by Application 2020 & 2033
Frequently Asked Questions
1. What is the projected Compound Annual Growth Rate (CAGR) of the Mobile Phone 3D Glass Back Cover?
The projected CAGR is approximately 5.6%.
2. Which companies are prominent players in the Mobile Phone 3D Glass Back Cover?
Key companies in the market include LENS, Bourne optics, CORNING, SCHOTT, NEG, AGC, First-panel, FOXCONN, Holitech Technology, KMTC, Gtoc.
3. What are the main segments of the Mobile Phone 3D Glass Back Cover?
The market segments include Application, Types.
4. Can you provide details about the market size?
The market size is estimated to be USD 27.3 billion as of 2022.
5. What are some drivers contributing to market growth?
N/A
6. What are the notable trends driving market growth?
N/A
7. Are there any restraints impacting market growth?
N/A
8. Can you provide examples of recent developments in the market?
N/A
9. What pricing options are available for accessing the report?
Pricing options include single-user, multi-user, and enterprise licenses priced at USD 2900.00, USD 4350.00, and USD 5800.00 respectively.
10. Is the market size provided in terms of value or volume?
The market size is provided in terms of value, measured in billion.
11. Are there any specific market keywords associated with the report?
Yes, the market keyword associated with the report is "Mobile Phone 3D Glass Back Cover," which aids in identifying and referencing the specific market segment covered.
12. How do I determine which pricing option suits my needs best?
The pricing options vary based on user requirements and access needs. Individual users may opt for single-user licenses, while businesses requiring broader access may choose multi-user or enterprise licenses for cost-effective access to the report.
13. Are there any additional resources or data provided in the Mobile Phone 3D Glass Back Cover report?
While the report offers comprehensive insights, it's advisable to review the specific contents or supplementary materials provided to ascertain if additional resources or data are available.
14. How can I stay updated on further developments or reports in the Mobile Phone 3D Glass Back Cover?
To stay informed about further developments, trends, and reports in the Mobile Phone 3D Glass Back Cover, consider subscribing to industry newsletters, following relevant companies and organizations, or regularly checking reputable industry news sources and publications.
Methodology
Step 1 - Identification of Relevant Samples Size from Population Database


Step 2 - Approaches for Defining Global Market Size (Value, Volume* & Price*)

Note*: In applicable scenarios
Step 3 - Data Sources
Primary Research
- Web Analytics
- Survey Reports
- Research Institute
- Latest Research Reports
- Opinion Leaders
Secondary Research
- Annual Reports
- White Paper
- Latest Press Release
- Industry Association
- Paid Database
- Investor Presentations

Step 4 - Data Triangulation
Involves using different sources of information in order to increase the validity of a study
These sources are likely to be stakeholders in a program - participants, other researchers, program staff, other community members, and so on.
Then we put all data in single framework & apply various statistical tools to find out the dynamic on the market.
During the analysis stage, feedback from the stakeholder groups would be compared to determine areas of agreement as well as areas of divergence