

Key Insights
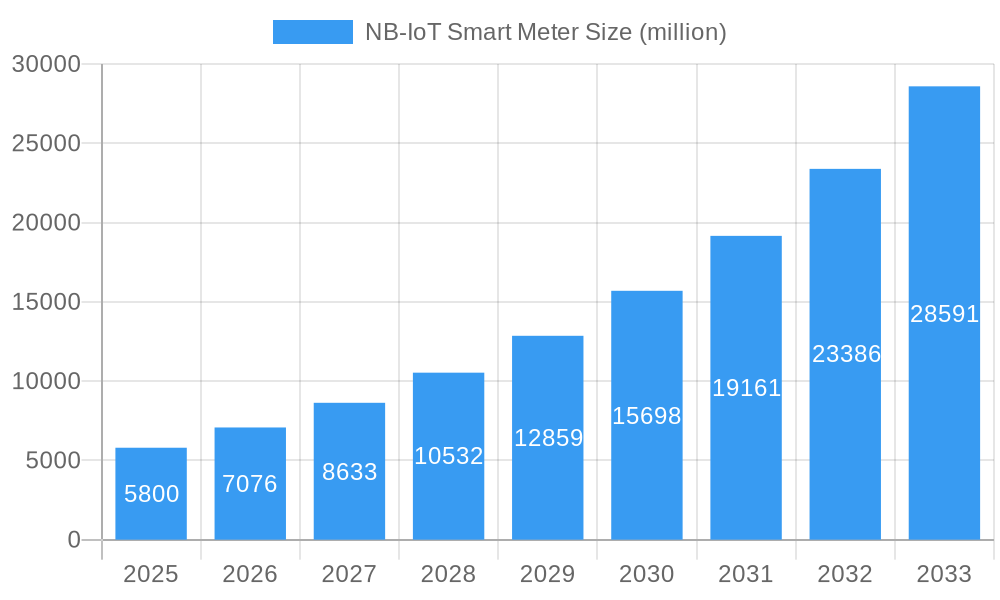
The NB-IoT smart meter market is poised for significant expansion, with a projected market size of approximately $5,800 million by 2025, driven by a robust Compound Annual Growth Rate (CAGR) of 22%. This impressive growth trajectory is fueled by a confluence of factors, including the increasing demand for advanced metering infrastructure to enhance grid efficiency and reduce operational costs for utilities. The ongoing digital transformation within the energy sector, coupled with government initiatives promoting smart city development and sustainable energy management, acts as a powerful catalyst. Furthermore, the inherent advantages of NB-IoT technology, such as its low power consumption, wide coverage, and cost-effectiveness for device deployment, make it an ideal solution for large-scale smart metering rollouts. The market is experiencing a substantial shift towards intelligent energy consumption monitoring and management, enabling utilities to gain real-time insights into energy usage patterns and detect anomalies swiftly.
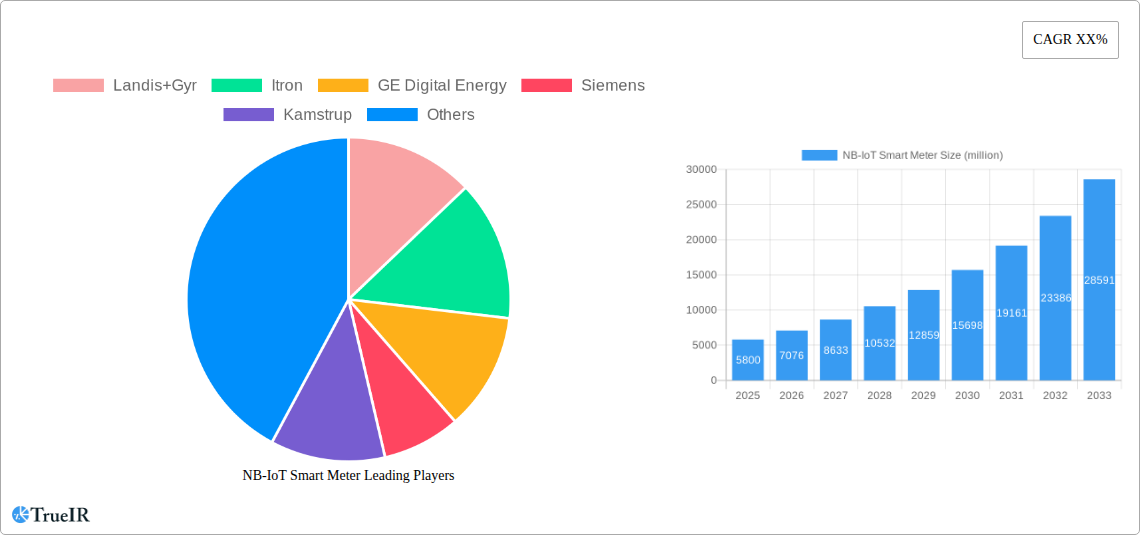
NB-IoT Smart Meter Market Size (In Billion)
The market segmentation reveals a strong demand across residential, commercial, and industrial applications, with residential applications currently leading due to widespread smart meter adoption initiatives. Single-phase meters are dominating the market, catering to the majority of residential and small commercial needs, while three-phase meters are gaining traction in industrial and larger commercial settings. Geographically, Asia Pacific, particularly China and India, is emerging as a dominant region, owing to rapid urbanization, government investments in smart grids, and a large consumer base. North America and Europe are also significant markets, driven by stringent regulations for energy efficiency and the replacement of aging traditional meters. Key players like Landis+Gyr, Itron, and Siemens are at the forefront, investing heavily in research and development to innovate NB-IoT meter functionalities and expand their market reach, contributing to the overall dynamic growth of this essential technological segment.
NB-IoT Smart Meter Company Market Share
NB-IoT Smart Meter Market Analysis Report: Unlocking the Future of Utility Connectivity
This comprehensive report dives deep into the rapidly evolving NB-IoT Smart Meter market, providing in-depth analysis and actionable insights for industry stakeholders. Leveraging advanced analytics and a robust forecast model spanning the Study Period of 2019–2033, this report offers a definitive guide to market dynamics, competitive strategies, and future growth trajectories.
NB-IoT Smart Meter Market Structure & Competitive Landscape
The global NB-IoT Smart Meter market exhibits a moderately concentrated structure, driven by significant R&D investments and the ongoing transition towards smarter grid technologies. Key players like Landis+Gyr, Itron, GE Digital Energy, Siemens, Kamstrup, Sensus, and Elster Group are at the forefront, continually innovating to meet the burgeoning demand for efficient and reliable utility metering. The market is characterized by a strong focus on product differentiation, with companies investing millions in enhancing meter accuracy, communication reliability, and data security. Regulatory mandates promoting energy efficiency and smart grid adoption are significant drivers, impacting market entry barriers and fostering a competitive environment. While direct product substitutes are limited in this specialized segment, advancements in other low-power wide-area network (LPWAN) technologies and alternative connectivity solutions present indirect competitive pressures. The end-user segmentation across Residential Application, Commercial Application, and Industrial Application highlights the diverse adoption potential. Mergers and acquisitions (M&A) activity, estimated to be in the hundreds of millions annually, is a crucial trend, as larger entities acquire innovative startups to consolidate market share and expand their technological portfolios. The competitive landscape is dynamic, with established utility meter manufacturers facing increasing competition from newer technology providers.
NB-IoT Smart Meter Market Trends & Opportunities
The NB-IoT Smart Meter market is poised for explosive growth, with a projected market size reaching several hundred million dollars by the Estimated Year of 2025 and exceeding one billion dollars by the end of the Forecast Period in 2033. This expansion is underpinned by a Compound Annual Growth Rate (CAGR) of approximately 20% from 2025 to 2033. The primary catalyst for this surge is the global imperative for digital transformation in the utility sector, driven by a need for enhanced operational efficiency, real-time data analytics, and improved customer engagement. Technological shifts are a significant trend, with NB-IoT's inherent advantages of low power consumption, wide coverage, and cost-effectiveness making it the ideal communication protocol for mass smart meter deployments. This technology enables seamless data transmission from millions of devices, facilitating remote meter reading, fault detection, and proactive maintenance. Consumer preferences are increasingly leaning towards smart home solutions and greater control over energy consumption, further fueling demand for smart meters. Utilities are investing heavily in upgrading their infrastructure to support these advanced metering solutions, recognizing the long-term benefits of reduced operational costs and improved grid management. The competitive dynamics are intensifying, with established players and emerging technology providers vying for market dominance. Opportunities abound in developing advanced functionalities, such as integrated IoT capabilities for demand-response programs, prepayment metering, and enhanced tamper detection. The penetration rate of NB-IoT smart meters is expected to rise exponentially, moving from a significant percentage in the Base Year of 2025 to over ninety percent across key markets by 2033, signifying a fundamental shift in how utilities manage and interact with their customer base.
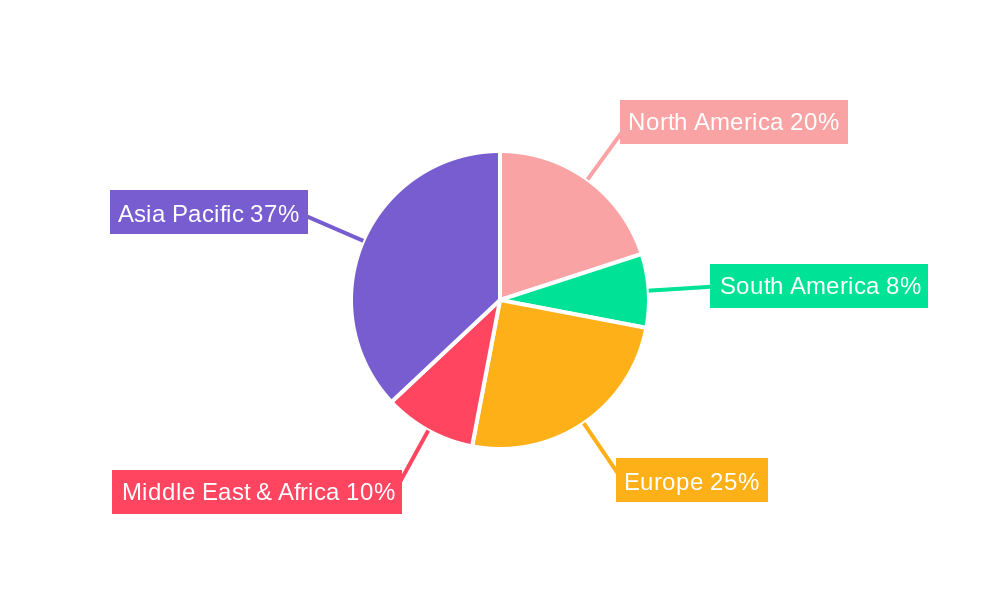
Dominant Markets & Segments in NB-IoT Smart Meter
The global NB-IoT Smart Meter market demonstrates significant regional and segment-specific dominance. Asia Pacific, particularly China, is a leading region, driven by extensive government initiatives and massive smart grid infrastructure development projects, with an estimated market share in the hundreds of billions. North America and Europe also represent substantial markets, owing to stringent regulations on energy efficiency and the ongoing modernization of utility networks.
Within the Application segmentation:
- Residential Application is the largest and fastest-growing segment. Factors driving this dominance include increasing consumer demand for smart home technology, the need for accurate billing, and utility programs aimed at promoting energy conservation. The deployment of millions of residential smart meters is expected to continue throughout the forecast period.
- Commercial Application is also a significant contributor. Businesses are recognizing the substantial cost savings achievable through optimized energy management, real-time consumption monitoring, and reduced operational overheads associated with manual meter reading. Investments in this segment are in the tens of billions.
- Industrial Application, while representing a smaller but critical segment, is witnessing substantial growth. Industries require highly accurate and reliable metering for critical process control, energy optimization, and compliance with environmental regulations. The focus here is on sophisticated data analytics and integration with industrial IoT platforms, with potential investments reaching hundreds of millions.
Regarding Types segmentation:
- Three Phase Meter currently holds a dominant position, particularly in industrial and commercial settings, due to their higher capacity and suitability for managing substantial energy loads. Their market share is in the tens of billions.
- Single Phase Meter is experiencing rapid growth, driven by the vast number of residential connections worldwide. As NB-IoT technology becomes more cost-effective, single-phase meter deployments are set to surge, with market expansion in the hundreds of billions.
The growth drivers in these dominant segments include supportive government policies, the decreasing cost of NB-IoT modules and smart meters, and the clear return on investment offered by smart metering solutions, which can range from hundreds of millions in operational savings for large utilities.
NB-IoT Smart Meter Product Analysis
NB-IoT smart meters represent a leap forward in utility metering technology, characterized by their robust connectivity, low power consumption, and enhanced data capabilities. Product innovations focus on miniaturization, improved tamper resistance, and integrated functionalities such as remote firmware updates and advanced diagnostics. These meters are designed for seamless integration into existing smart grid infrastructure, offering reliable communication over long distances with minimal network congestion. Their competitive advantage lies in their cost-effectiveness compared to other LPWAN technologies and their ability to operate for years on a single battery, reducing maintenance costs for utilities. The primary applications span automated meter reading (AMR), advanced metering infrastructure (AMI), and enabling smart grid services, all contributing to operational efficiency and data-driven decision-making.
Key Drivers, Barriers & Challenges in NB-IoT Smart Meter
Key Drivers: The NB-IoT smart meter market is propelled by several key drivers. Technological advancements in LPWAN, particularly NB-IoT, offer a cost-effective and power-efficient solution for widespread connectivity, enabling millions of devices to transmit data reliably. Government initiatives and regulatory mandates promoting energy efficiency, smart grids, and decarbonization are significant policy-driven factors, creating a favorable environment for adoption. Economic benefits, such as reduced operational costs for utilities through automated meter reading and enhanced grid management, are compelling arguments for investment, with potential savings in the hundreds of millions. The growing demand for real-time data analytics for better resource management and customer engagement is another critical driver.
Barriers & Challenges: Despite the positive outlook, the market faces several challenges. Regulatory complexities and standardization issues across different regions can slow down widespread adoption and create interoperability hurdles, potentially impacting market growth by hundreds of millions in delayed deployment. Supply chain disruptions for critical components and the global shortage of skilled technicians for installation and maintenance pose significant restraints. High upfront investment costs for utilities to deploy new infrastructure and upgrade existing systems, although offset by long-term savings, can be a barrier for some. Cybersecurity concerns related to data breaches and network vulnerabilities require robust security protocols, adding to development costs. Customer acceptance and education regarding the benefits and functionality of smart meters are also crucial for widespread adoption.
Growth Drivers in the NB-IoT Smart Meter Market
The NB-IoT smart meter market is fueled by compelling growth drivers. Technological advancements in LPWAN offer an ideal, cost-effective, and power-efficient solution for massive IoT deployments, enabling millions of smart meters to communicate reliably. Government incentives and supportive policies aimed at promoting energy efficiency, smart grids, and carbon footprint reduction are creating a robust regulatory push for widespread adoption. Economic benefits, including significant reductions in operational costs for utilities through automated meter reading, proactive maintenance, and enhanced grid management, are a major investment catalyst, with potential savings reaching hundreds of millions annually. Furthermore, the increasing demand for real-time data analytics for better resource optimization and enhanced customer engagement is a critical factor driving market expansion.
Challenges Impacting NB-IoT Smart Meter Growth
Several challenges impact the growth of the NB-IoT smart meter market. Regulatory complexities and evolving standardization efforts across diverse geographical markets can create fragmentation and slow down the pace of deployment, potentially leading to hundreds of millions in delayed revenue. Supply chain vulnerabilities for essential components, coupled with a global shortage of skilled installation and maintenance personnel, present significant operational hurdles. While long-term savings are substantial, the high initial capital expenditure required for utilities to implement new infrastructure and upgrade existing systems remains a considerable barrier for some organizations. Additionally, cybersecurity concerns surrounding data privacy and network integrity necessitate stringent security measures and ongoing investment.
Key Players Shaping the NB-IoT Smart Meter Market
- Landis+Gyr
- Itron
- GE Digital Energy
- Siemens
- Kamstrup
- Sensus
- Elster Group
- Silver Spring Networks
- Aclara
- Nuri Telecom
- Sagemcom
- Trilliant
- Iskraemeco
- Echelon
- Tantalus Systems
- ZIV
- Sanxing
- Linyang Electronics
- Wasion Group
- Haixing Electrical
Significant NB-IoT Smart Meter Industry Milestones
- 2019: Widespread pilot deployments of NB-IoT smart meters in major European cities, showcasing scalability and reliability.
- 2020: Standardization bodies finalize key protocols for NB-IoT device interoperability, fostering broader ecosystem development.
- 2021: Major chipset manufacturers announce significant price reductions for NB-IoT modules, lowering meter manufacturing costs by millions.
- 2022: Launch of first large-scale residential smart metering projects utilizing NB-IoT in China, involving millions of meters.
- 2023: Several utility companies announce multi-year smart meter deployment plans, committing hundreds of millions in investment.
- 2024: Emergence of advanced analytics platforms integrated with NB-IoT smart meter data, unlocking new revenue streams for utilities.
Future Outlook for NB-IoT Smart Meter Market
The future outlook for the NB-IoT smart meter market is exceptionally bright, driven by escalating demand for smart grid technologies and the inherent advantages of NB-IoT connectivity. Strategic opportunities lie in expanding smart meter functionalities to support advanced services like electric vehicle charging management, distributed energy resource integration, and predictive maintenance. The market is expected to witness continued innovation, with a focus on enhanced cybersecurity, improved data analytics capabilities, and seamless integration with broader IoT ecosystems. Continued investment in infrastructure upgrades by utilities, coupled with supportive government policies promoting energy efficiency, will fuel market growth, with the potential for hundreds of millions of new deployments globally. The transition towards a fully digitized and automated utility landscape positions NB-IoT smart meters as a cornerstone technology for the next decade.
NB-IoT Smart Meter Segmentation
-
1. Application
- 1.1. Residential Application
- 1.2. Commercial Application
- 1.3. Industrial Application
-
2. Types
- 2.1. Single Phase Meter
- 2.2. Three Phase Meter
NB-IoT Smart Meter Segmentation By Geography
-
1. North America
- 1.1. United States
- 1.2. Canada
- 1.3. Mexico
-
2. South America
- 2.1. Brazil
- 2.2. Argentina
- 2.3. Rest of South America
-
3. Europe
- 3.1. United Kingdom
- 3.2. Germany
- 3.3. France
- 3.4. Italy
- 3.5. Spain
- 3.6. Russia
- 3.7. Benelux
- 3.8. Nordics
- 3.9. Rest of Europe
-
4. Middle East & Africa
- 4.1. Turkey
- 4.2. Israel
- 4.3. GCC
- 4.4. North Africa
- 4.5. South Africa
- 4.6. Rest of Middle East & Africa
-
5. Asia Pacific
- 5.1. China
- 5.2. India
- 5.3. Japan
- 5.4. South Korea
- 5.5. ASEAN
- 5.6. Oceania
- 5.7. Rest of Asia Pacific
NB-IoT Smart Meter Regional Market Share
Geographic Coverage of NB-IoT Smart Meter
NB-IoT Smart Meter REPORT HIGHLIGHTS
| Aspects | Details |
|---|---|
| Study Period | 2020-2034 |
| Base Year | 2025 |
| Estimated Year | 2026 |
| Forecast Period | 2026-2034 |
| Historical Period | 2020-2025 |
| Growth Rate | CAGR of 13.2% from 2020-2034 |
| Segmentation |
|
Table of Contents
- 1. Introduction
- 1.1. Research Scope
- 1.2. Market Segmentation
- 1.3. Research Objective
- 1.4. Definitions and Assumptions
- 2. Executive Summary
- 2.1. Market Snapshot
- 3. Market Dynamics
- 3.1. Market Drivers
- 3.2. Market Restrains
- 3.3. Market Trends
- 3.4. Market Opportunities
- 4. Market Factor Analysis
- 4.1. Porters Five Forces
- 4.1.1. Bargaining Power of Suppliers
- 4.1.2. Bargaining Power of Buyers
- 4.1.3. Threat of New Entrants
- 4.1.4. Threat of Substitutes
- 4.1.5. Competitive Rivalry
- 4.2. PESTEL analysis
- 4.3. BCG Analysis
- 4.3.1. Stars (High Growth, High Market Share)
- 4.3.2. Cash Cows (Low Growth, High Market Share)
- 4.3.3. Question Mark (High Growth, Low Market Share)
- 4.3.4. Dogs (Low Growth, Low Market Share)
- 4.4. Ansoff Matrix Analysis
- 4.5. Supply Chain Analysis
- 4.6. Regulatory Landscape
- 4.7. Current Market Potential and Opportunity Assessment (TAM–SAM–SOM Framework)
- 4.8. TIR Analyst Note
- 4.1. Porters Five Forces
- 5. Market Analysis, Insights and Forecast 2021-2033
- 5.1. Market Analysis, Insights and Forecast - by Application
- 5.1.1. Residential Application
- 5.1.2. Commercial Application
- 5.1.3. Industrial Application
- 5.2. Market Analysis, Insights and Forecast - by Types
- 5.2.1. Single Phase Meter
- 5.2.2. Three Phase Meter
- 5.3. Market Analysis, Insights and Forecast - by Region
- 5.3.1. North America
- 5.3.2. South America
- 5.3.3. Europe
- 5.3.4. Middle East & Africa
- 5.3.5. Asia Pacific
- 5.1. Market Analysis, Insights and Forecast - by Application
- 6. Global NB-IoT Smart Meter Analysis, Insights and Forecast, 2021-2033
- 6.1. Market Analysis, Insights and Forecast - by Application
- 6.1.1. Residential Application
- 6.1.2. Commercial Application
- 6.1.3. Industrial Application
- 6.2. Market Analysis, Insights and Forecast - by Types
- 6.2.1. Single Phase Meter
- 6.2.2. Three Phase Meter
- 6.1. Market Analysis, Insights and Forecast - by Application
- 7. North America NB-IoT Smart Meter Analysis, Insights and Forecast, 2020-2032
- 7.1. Market Analysis, Insights and Forecast - by Application
- 7.1.1. Residential Application
- 7.1.2. Commercial Application
- 7.1.3. Industrial Application
- 7.2. Market Analysis, Insights and Forecast - by Types
- 7.2.1. Single Phase Meter
- 7.2.2. Three Phase Meter
- 7.1. Market Analysis, Insights and Forecast - by Application
- 8. South America NB-IoT Smart Meter Analysis, Insights and Forecast, 2020-2032
- 8.1. Market Analysis, Insights and Forecast - by Application
- 8.1.1. Residential Application
- 8.1.2. Commercial Application
- 8.1.3. Industrial Application
- 8.2. Market Analysis, Insights and Forecast - by Types
- 8.2.1. Single Phase Meter
- 8.2.2. Three Phase Meter
- 8.1. Market Analysis, Insights and Forecast - by Application
- 9. Europe NB-IoT Smart Meter Analysis, Insights and Forecast, 2020-2032
- 9.1. Market Analysis, Insights and Forecast - by Application
- 9.1.1. Residential Application
- 9.1.2. Commercial Application
- 9.1.3. Industrial Application
- 9.2. Market Analysis, Insights and Forecast - by Types
- 9.2.1. Single Phase Meter
- 9.2.2. Three Phase Meter
- 9.1. Market Analysis, Insights and Forecast - by Application
- 10. Middle East & Africa NB-IoT Smart Meter Analysis, Insights and Forecast, 2020-2032
- 10.1. Market Analysis, Insights and Forecast - by Application
- 10.1.1. Residential Application
- 10.1.2. Commercial Application
- 10.1.3. Industrial Application
- 10.2. Market Analysis, Insights and Forecast - by Types
- 10.2.1. Single Phase Meter
- 10.2.2. Three Phase Meter
- 10.1. Market Analysis, Insights and Forecast - by Application
- 11. Asia Pacific NB-IoT Smart Meter Analysis, Insights and Forecast, 2020-2032
- 11.1. Market Analysis, Insights and Forecast - by Application
- 11.1.1. Residential Application
- 11.1.2. Commercial Application
- 11.1.3. Industrial Application
- 11.2. Market Analysis, Insights and Forecast - by Types
- 11.2.1. Single Phase Meter
- 11.2.2. Three Phase Meter
- 11.1. Market Analysis, Insights and Forecast - by Application
- 12. Competitive Analysis
- 12.1. Company Profiles
- 12.1.1 Landis+Gyr
- 12.1.1.1. Company Overview
- 12.1.1.2. Products
- 12.1.1.3. Company Financials
- 12.1.1.4. SWOT Analysis
- 12.1.2 Itron
- 12.1.2.1. Company Overview
- 12.1.2.2. Products
- 12.1.2.3. Company Financials
- 12.1.2.4. SWOT Analysis
- 12.1.3 GE Digital Energy
- 12.1.3.1. Company Overview
- 12.1.3.2. Products
- 12.1.3.3. Company Financials
- 12.1.3.4. SWOT Analysis
- 12.1.4 Siemens
- 12.1.4.1. Company Overview
- 12.1.4.2. Products
- 12.1.4.3. Company Financials
- 12.1.4.4. SWOT Analysis
- 12.1.5 Kamstrup
- 12.1.5.1. Company Overview
- 12.1.5.2. Products
- 12.1.5.3. Company Financials
- 12.1.5.4. SWOT Analysis
- 12.1.6 Sensus
- 12.1.6.1. Company Overview
- 12.1.6.2. Products
- 12.1.6.3. Company Financials
- 12.1.6.4. SWOT Analysis
- 12.1.7 Elster Group
- 12.1.7.1. Company Overview
- 12.1.7.2. Products
- 12.1.7.3. Company Financials
- 12.1.7.4. SWOT Analysis
- 12.1.8 Silver Spring Networks
- 12.1.8.1. Company Overview
- 12.1.8.2. Products
- 12.1.8.3. Company Financials
- 12.1.8.4. SWOT Analysis
- 12.1.9 Aclara
- 12.1.9.1. Company Overview
- 12.1.9.2. Products
- 12.1.9.3. Company Financials
- 12.1.9.4. SWOT Analysis
- 12.1.10 Nuri Telecom
- 12.1.10.1. Company Overview
- 12.1.10.2. Products
- 12.1.10.3. Company Financials
- 12.1.10.4. SWOT Analysis
- 12.1.11 Sagemcom
- 12.1.11.1. Company Overview
- 12.1.11.2. Products
- 12.1.11.3. Company Financials
- 12.1.11.4. SWOT Analysis
- 12.1.12 Trilliant
- 12.1.12.1. Company Overview
- 12.1.12.2. Products
- 12.1.12.3. Company Financials
- 12.1.12.4. SWOT Analysis
- 12.1.13 Iskraemeco
- 12.1.13.1. Company Overview
- 12.1.13.2. Products
- 12.1.13.3. Company Financials
- 12.1.13.4. SWOT Analysis
- 12.1.14 Echelon
- 12.1.14.1. Company Overview
- 12.1.14.2. Products
- 12.1.14.3. Company Financials
- 12.1.14.4. SWOT Analysis
- 12.1.15 Tantalus Systems
- 12.1.15.1. Company Overview
- 12.1.15.2. Products
- 12.1.15.3. Company Financials
- 12.1.15.4. SWOT Analysis
- 12.1.16 ZIV
- 12.1.16.1. Company Overview
- 12.1.16.2. Products
- 12.1.16.3. Company Financials
- 12.1.16.4. SWOT Analysis
- 12.1.17 Sanxing
- 12.1.17.1. Company Overview
- 12.1.17.2. Products
- 12.1.17.3. Company Financials
- 12.1.17.4. SWOT Analysis
- 12.1.18 Linyang Electronics
- 12.1.18.1. Company Overview
- 12.1.18.2. Products
- 12.1.18.3. Company Financials
- 12.1.18.4. SWOT Analysis
- 12.1.19 Wasion Group
- 12.1.19.1. Company Overview
- 12.1.19.2. Products
- 12.1.19.3. Company Financials
- 12.1.19.4. SWOT Analysis
- 12.1.20 Haixing Electrical
- 12.1.20.1. Company Overview
- 12.1.20.2. Products
- 12.1.20.3. Company Financials
- 12.1.20.4. SWOT Analysis
- 12.1.1 Landis+Gyr
- 12.2. Market Entropy
- 12.2.1 Company's Key Areas Served
- 12.2.2 Recent Developments
- 12.3. Company Market Share Analysis 2025
- 12.3.1 Top 5 Companies Market Share Analysis
- 12.3.2 Top 3 Companies Market Share Analysis
- 12.4. List of Potential Customers
- 13. Research Methodology
List of Figures
- Figure 1: Global NB-IoT Smart Meter Revenue Breakdown (undefined, %) by Region 2025 & 2033
- Figure 2: Global NB-IoT Smart Meter Volume Breakdown (K, %) by Region 2025 & 2033
- Figure 3: North America NB-IoT Smart Meter Revenue (undefined), by Application 2025 & 2033
- Figure 4: North America NB-IoT Smart Meter Volume (K), by Application 2025 & 2033
- Figure 5: North America NB-IoT Smart Meter Revenue Share (%), by Application 2025 & 2033
- Figure 6: North America NB-IoT Smart Meter Volume Share (%), by Application 2025 & 2033
- Figure 7: North America NB-IoT Smart Meter Revenue (undefined), by Types 2025 & 2033
- Figure 8: North America NB-IoT Smart Meter Volume (K), by Types 2025 & 2033
- Figure 9: North America NB-IoT Smart Meter Revenue Share (%), by Types 2025 & 2033
- Figure 10: North America NB-IoT Smart Meter Volume Share (%), by Types 2025 & 2033
- Figure 11: North America NB-IoT Smart Meter Revenue (undefined), by Country 2025 & 2033
- Figure 12: North America NB-IoT Smart Meter Volume (K), by Country 2025 & 2033
- Figure 13: North America NB-IoT Smart Meter Revenue Share (%), by Country 2025 & 2033
- Figure 14: North America NB-IoT Smart Meter Volume Share (%), by Country 2025 & 2033
- Figure 15: South America NB-IoT Smart Meter Revenue (undefined), by Application 2025 & 2033
- Figure 16: South America NB-IoT Smart Meter Volume (K), by Application 2025 & 2033
- Figure 17: South America NB-IoT Smart Meter Revenue Share (%), by Application 2025 & 2033
- Figure 18: South America NB-IoT Smart Meter Volume Share (%), by Application 2025 & 2033
- Figure 19: South America NB-IoT Smart Meter Revenue (undefined), by Types 2025 & 2033
- Figure 20: South America NB-IoT Smart Meter Volume (K), by Types 2025 & 2033
- Figure 21: South America NB-IoT Smart Meter Revenue Share (%), by Types 2025 & 2033
- Figure 22: South America NB-IoT Smart Meter Volume Share (%), by Types 2025 & 2033
- Figure 23: South America NB-IoT Smart Meter Revenue (undefined), by Country 2025 & 2033
- Figure 24: South America NB-IoT Smart Meter Volume (K), by Country 2025 & 2033
- Figure 25: South America NB-IoT Smart Meter Revenue Share (%), by Country 2025 & 2033
- Figure 26: South America NB-IoT Smart Meter Volume Share (%), by Country 2025 & 2033
- Figure 27: Europe NB-IoT Smart Meter Revenue (undefined), by Application 2025 & 2033
- Figure 28: Europe NB-IoT Smart Meter Volume (K), by Application 2025 & 2033
- Figure 29: Europe NB-IoT Smart Meter Revenue Share (%), by Application 2025 & 2033
- Figure 30: Europe NB-IoT Smart Meter Volume Share (%), by Application 2025 & 2033
- Figure 31: Europe NB-IoT Smart Meter Revenue (undefined), by Types 2025 & 2033
- Figure 32: Europe NB-IoT Smart Meter Volume (K), by Types 2025 & 2033
- Figure 33: Europe NB-IoT Smart Meter Revenue Share (%), by Types 2025 & 2033
- Figure 34: Europe NB-IoT Smart Meter Volume Share (%), by Types 2025 & 2033
- Figure 35: Europe NB-IoT Smart Meter Revenue (undefined), by Country 2025 & 2033
- Figure 36: Europe NB-IoT Smart Meter Volume (K), by Country 2025 & 2033
- Figure 37: Europe NB-IoT Smart Meter Revenue Share (%), by Country 2025 & 2033
- Figure 38: Europe NB-IoT Smart Meter Volume Share (%), by Country 2025 & 2033
- Figure 39: Middle East & Africa NB-IoT Smart Meter Revenue (undefined), by Application 2025 & 2033
- Figure 40: Middle East & Africa NB-IoT Smart Meter Volume (K), by Application 2025 & 2033
- Figure 41: Middle East & Africa NB-IoT Smart Meter Revenue Share (%), by Application 2025 & 2033
- Figure 42: Middle East & Africa NB-IoT Smart Meter Volume Share (%), by Application 2025 & 2033
- Figure 43: Middle East & Africa NB-IoT Smart Meter Revenue (undefined), by Types 2025 & 2033
- Figure 44: Middle East & Africa NB-IoT Smart Meter Volume (K), by Types 2025 & 2033
- Figure 45: Middle East & Africa NB-IoT Smart Meter Revenue Share (%), by Types 2025 & 2033
- Figure 46: Middle East & Africa NB-IoT Smart Meter Volume Share (%), by Types 2025 & 2033
- Figure 47: Middle East & Africa NB-IoT Smart Meter Revenue (undefined), by Country 2025 & 2033
- Figure 48: Middle East & Africa NB-IoT Smart Meter Volume (K), by Country 2025 & 2033
- Figure 49: Middle East & Africa NB-IoT Smart Meter Revenue Share (%), by Country 2025 & 2033
- Figure 50: Middle East & Africa NB-IoT Smart Meter Volume Share (%), by Country 2025 & 2033
- Figure 51: Asia Pacific NB-IoT Smart Meter Revenue (undefined), by Application 2025 & 2033
- Figure 52: Asia Pacific NB-IoT Smart Meter Volume (K), by Application 2025 & 2033
- Figure 53: Asia Pacific NB-IoT Smart Meter Revenue Share (%), by Application 2025 & 2033
- Figure 54: Asia Pacific NB-IoT Smart Meter Volume Share (%), by Application 2025 & 2033
- Figure 55: Asia Pacific NB-IoT Smart Meter Revenue (undefined), by Types 2025 & 2033
- Figure 56: Asia Pacific NB-IoT Smart Meter Volume (K), by Types 2025 & 2033
- Figure 57: Asia Pacific NB-IoT Smart Meter Revenue Share (%), by Types 2025 & 2033
- Figure 58: Asia Pacific NB-IoT Smart Meter Volume Share (%), by Types 2025 & 2033
- Figure 59: Asia Pacific NB-IoT Smart Meter Revenue (undefined), by Country 2025 & 2033
- Figure 60: Asia Pacific NB-IoT Smart Meter Volume (K), by Country 2025 & 2033
- Figure 61: Asia Pacific NB-IoT Smart Meter Revenue Share (%), by Country 2025 & 2033
- Figure 62: Asia Pacific NB-IoT Smart Meter Volume Share (%), by Country 2025 & 2033
List of Tables
- Table 1: Global NB-IoT Smart Meter Revenue undefined Forecast, by Application 2020 & 2033
- Table 2: Global NB-IoT Smart Meter Volume K Forecast, by Application 2020 & 2033
- Table 3: Global NB-IoT Smart Meter Revenue undefined Forecast, by Types 2020 & 2033
- Table 4: Global NB-IoT Smart Meter Volume K Forecast, by Types 2020 & 2033
- Table 5: Global NB-IoT Smart Meter Revenue undefined Forecast, by Region 2020 & 2033
- Table 6: Global NB-IoT Smart Meter Volume K Forecast, by Region 2020 & 2033
- Table 7: Global NB-IoT Smart Meter Revenue undefined Forecast, by Application 2020 & 2033
- Table 8: Global NB-IoT Smart Meter Volume K Forecast, by Application 2020 & 2033
- Table 9: Global NB-IoT Smart Meter Revenue undefined Forecast, by Types 2020 & 2033
- Table 10: Global NB-IoT Smart Meter Volume K Forecast, by Types 2020 & 2033
- Table 11: Global NB-IoT Smart Meter Revenue undefined Forecast, by Country 2020 & 2033
- Table 12: Global NB-IoT Smart Meter Volume K Forecast, by Country 2020 & 2033
- Table 13: United States NB-IoT Smart Meter Revenue (undefined) Forecast, by Application 2020 & 2033
- Table 14: United States NB-IoT Smart Meter Volume (K) Forecast, by Application 2020 & 2033
- Table 15: Canada NB-IoT Smart Meter Revenue (undefined) Forecast, by Application 2020 & 2033
- Table 16: Canada NB-IoT Smart Meter Volume (K) Forecast, by Application 2020 & 2033
- Table 17: Mexico NB-IoT Smart Meter Revenue (undefined) Forecast, by Application 2020 & 2033
- Table 18: Mexico NB-IoT Smart Meter Volume (K) Forecast, by Application 2020 & 2033
- Table 19: Global NB-IoT Smart Meter Revenue undefined Forecast, by Application 2020 & 2033
- Table 20: Global NB-IoT Smart Meter Volume K Forecast, by Application 2020 & 2033
- Table 21: Global NB-IoT Smart Meter Revenue undefined Forecast, by Types 2020 & 2033
- Table 22: Global NB-IoT Smart Meter Volume K Forecast, by Types 2020 & 2033
- Table 23: Global NB-IoT Smart Meter Revenue undefined Forecast, by Country 2020 & 2033
- Table 24: Global NB-IoT Smart Meter Volume K Forecast, by Country 2020 & 2033
- Table 25: Brazil NB-IoT Smart Meter Revenue (undefined) Forecast, by Application 2020 & 2033
- Table 26: Brazil NB-IoT Smart Meter Volume (K) Forecast, by Application 2020 & 2033
- Table 27: Argentina NB-IoT Smart Meter Revenue (undefined) Forecast, by Application 2020 & 2033
- Table 28: Argentina NB-IoT Smart Meter Volume (K) Forecast, by Application 2020 & 2033
- Table 29: Rest of South America NB-IoT Smart Meter Revenue (undefined) Forecast, by Application 2020 & 2033
- Table 30: Rest of South America NB-IoT Smart Meter Volume (K) Forecast, by Application 2020 & 2033
- Table 31: Global NB-IoT Smart Meter Revenue undefined Forecast, by Application 2020 & 2033
- Table 32: Global NB-IoT Smart Meter Volume K Forecast, by Application 2020 & 2033
- Table 33: Global NB-IoT Smart Meter Revenue undefined Forecast, by Types 2020 & 2033
- Table 34: Global NB-IoT Smart Meter Volume K Forecast, by Types 2020 & 2033
- Table 35: Global NB-IoT Smart Meter Revenue undefined Forecast, by Country 2020 & 2033
- Table 36: Global NB-IoT Smart Meter Volume K Forecast, by Country 2020 & 2033
- Table 37: United Kingdom NB-IoT Smart Meter Revenue (undefined) Forecast, by Application 2020 & 2033
- Table 38: United Kingdom NB-IoT Smart Meter Volume (K) Forecast, by Application 2020 & 2033
- Table 39: Germany NB-IoT Smart Meter Revenue (undefined) Forecast, by Application 2020 & 2033
- Table 40: Germany NB-IoT Smart Meter Volume (K) Forecast, by Application 2020 & 2033
- Table 41: France NB-IoT Smart Meter Revenue (undefined) Forecast, by Application 2020 & 2033
- Table 42: France NB-IoT Smart Meter Volume (K) Forecast, by Application 2020 & 2033
- Table 43: Italy NB-IoT Smart Meter Revenue (undefined) Forecast, by Application 2020 & 2033
- Table 44: Italy NB-IoT Smart Meter Volume (K) Forecast, by Application 2020 & 2033
- Table 45: Spain NB-IoT Smart Meter Revenue (undefined) Forecast, by Application 2020 & 2033
- Table 46: Spain NB-IoT Smart Meter Volume (K) Forecast, by Application 2020 & 2033
- Table 47: Russia NB-IoT Smart Meter Revenue (undefined) Forecast, by Application 2020 & 2033
- Table 48: Russia NB-IoT Smart Meter Volume (K) Forecast, by Application 2020 & 2033
- Table 49: Benelux NB-IoT Smart Meter Revenue (undefined) Forecast, by Application 2020 & 2033
- Table 50: Benelux NB-IoT Smart Meter Volume (K) Forecast, by Application 2020 & 2033
- Table 51: Nordics NB-IoT Smart Meter Revenue (undefined) Forecast, by Application 2020 & 2033
- Table 52: Nordics NB-IoT Smart Meter Volume (K) Forecast, by Application 2020 & 2033
- Table 53: Rest of Europe NB-IoT Smart Meter Revenue (undefined) Forecast, by Application 2020 & 2033
- Table 54: Rest of Europe NB-IoT Smart Meter Volume (K) Forecast, by Application 2020 & 2033
- Table 55: Global NB-IoT Smart Meter Revenue undefined Forecast, by Application 2020 & 2033
- Table 56: Global NB-IoT Smart Meter Volume K Forecast, by Application 2020 & 2033
- Table 57: Global NB-IoT Smart Meter Revenue undefined Forecast, by Types 2020 & 2033
- Table 58: Global NB-IoT Smart Meter Volume K Forecast, by Types 2020 & 2033
- Table 59: Global NB-IoT Smart Meter Revenue undefined Forecast, by Country 2020 & 2033
- Table 60: Global NB-IoT Smart Meter Volume K Forecast, by Country 2020 & 2033
- Table 61: Turkey NB-IoT Smart Meter Revenue (undefined) Forecast, by Application 2020 & 2033
- Table 62: Turkey NB-IoT Smart Meter Volume (K) Forecast, by Application 2020 & 2033
- Table 63: Israel NB-IoT Smart Meter Revenue (undefined) Forecast, by Application 2020 & 2033
- Table 64: Israel NB-IoT Smart Meter Volume (K) Forecast, by Application 2020 & 2033
- Table 65: GCC NB-IoT Smart Meter Revenue (undefined) Forecast, by Application 2020 & 2033
- Table 66: GCC NB-IoT Smart Meter Volume (K) Forecast, by Application 2020 & 2033
- Table 67: North Africa NB-IoT Smart Meter Revenue (undefined) Forecast, by Application 2020 & 2033
- Table 68: North Africa NB-IoT Smart Meter Volume (K) Forecast, by Application 2020 & 2033
- Table 69: South Africa NB-IoT Smart Meter Revenue (undefined) Forecast, by Application 2020 & 2033
- Table 70: South Africa NB-IoT Smart Meter Volume (K) Forecast, by Application 2020 & 2033
- Table 71: Rest of Middle East & Africa NB-IoT Smart Meter Revenue (undefined) Forecast, by Application 2020 & 2033
- Table 72: Rest of Middle East & Africa NB-IoT Smart Meter Volume (K) Forecast, by Application 2020 & 2033
- Table 73: Global NB-IoT Smart Meter Revenue undefined Forecast, by Application 2020 & 2033
- Table 74: Global NB-IoT Smart Meter Volume K Forecast, by Application 2020 & 2033
- Table 75: Global NB-IoT Smart Meter Revenue undefined Forecast, by Types 2020 & 2033
- Table 76: Global NB-IoT Smart Meter Volume K Forecast, by Types 2020 & 2033
- Table 77: Global NB-IoT Smart Meter Revenue undefined Forecast, by Country 2020 & 2033
- Table 78: Global NB-IoT Smart Meter Volume K Forecast, by Country 2020 & 2033
- Table 79: China NB-IoT Smart Meter Revenue (undefined) Forecast, by Application 2020 & 2033
- Table 80: China NB-IoT Smart Meter Volume (K) Forecast, by Application 2020 & 2033
- Table 81: India NB-IoT Smart Meter Revenue (undefined) Forecast, by Application 2020 & 2033
- Table 82: India NB-IoT Smart Meter Volume (K) Forecast, by Application 2020 & 2033
- Table 83: Japan NB-IoT Smart Meter Revenue (undefined) Forecast, by Application 2020 & 2033
- Table 84: Japan NB-IoT Smart Meter Volume (K) Forecast, by Application 2020 & 2033
- Table 85: South Korea NB-IoT Smart Meter Revenue (undefined) Forecast, by Application 2020 & 2033
- Table 86: South Korea NB-IoT Smart Meter Volume (K) Forecast, by Application 2020 & 2033
- Table 87: ASEAN NB-IoT Smart Meter Revenue (undefined) Forecast, by Application 2020 & 2033
- Table 88: ASEAN NB-IoT Smart Meter Volume (K) Forecast, by Application 2020 & 2033
- Table 89: Oceania NB-IoT Smart Meter Revenue (undefined) Forecast, by Application 2020 & 2033
- Table 90: Oceania NB-IoT Smart Meter Volume (K) Forecast, by Application 2020 & 2033
- Table 91: Rest of Asia Pacific NB-IoT Smart Meter Revenue (undefined) Forecast, by Application 2020 & 2033
- Table 92: Rest of Asia Pacific NB-IoT Smart Meter Volume (K) Forecast, by Application 2020 & 2033
Frequently Asked Questions
1. What is the projected Compound Annual Growth Rate (CAGR) of the NB-IoT Smart Meter?
The projected CAGR is approximately 13.2%.
2. Which companies are prominent players in the NB-IoT Smart Meter?
Key companies in the market include Landis+Gyr, Itron, GE Digital Energy, Siemens, Kamstrup, Sensus, Elster Group, Silver Spring Networks, Aclara, Nuri Telecom, Sagemcom, Trilliant, Iskraemeco, Echelon, Tantalus Systems, ZIV, Sanxing, Linyang Electronics, Wasion Group, Haixing Electrical.
3. What are the main segments of the NB-IoT Smart Meter?
The market segments include Application, Types.
4. Can you provide details about the market size?
The market size is estimated to be USD XXX N/A as of 2022.
5. What are some drivers contributing to market growth?
N/A
6. What are the notable trends driving market growth?
N/A
7. Are there any restraints impacting market growth?
N/A
8. Can you provide examples of recent developments in the market?
N/A
9. What pricing options are available for accessing the report?
Pricing options include single-user, multi-user, and enterprise licenses priced at USD 3350.00, USD 5025.00, and USD 6700.00 respectively.
10. Is the market size provided in terms of value or volume?
The market size is provided in terms of value, measured in N/A and volume, measured in K.
11. Are there any specific market keywords associated with the report?
Yes, the market keyword associated with the report is "NB-IoT Smart Meter," which aids in identifying and referencing the specific market segment covered.
12. How do I determine which pricing option suits my needs best?
The pricing options vary based on user requirements and access needs. Individual users may opt for single-user licenses, while businesses requiring broader access may choose multi-user or enterprise licenses for cost-effective access to the report.
13. Are there any additional resources or data provided in the NB-IoT Smart Meter report?
While the report offers comprehensive insights, it's advisable to review the specific contents or supplementary materials provided to ascertain if additional resources or data are available.
14. How can I stay updated on further developments or reports in the NB-IoT Smart Meter?
To stay informed about further developments, trends, and reports in the NB-IoT Smart Meter, consider subscribing to industry newsletters, following relevant companies and organizations, or regularly checking reputable industry news sources and publications.
Methodology
Step 1 - Identification of Relevant Samples Size from Population Database


Step 2 - Approaches for Defining Global Market Size (Value, Volume* & Price*)

Note*: In applicable scenarios
Step 3 - Data Sources
Primary Research
- Web Analytics
- Survey Reports
- Research Institute
- Latest Research Reports
- Opinion Leaders
Secondary Research
- Annual Reports
- White Paper
- Latest Press Release
- Industry Association
- Paid Database
- Investor Presentations

Step 4 - Data Triangulation
Involves using different sources of information in order to increase the validity of a study
These sources are likely to be stakeholders in a program - participants, other researchers, program staff, other community members, and so on.
Then we put all data in single framework & apply various statistical tools to find out the dynamic on the market.
During the analysis stage, feedback from the stakeholder groups would be compared to determine areas of agreement as well as areas of divergence