

Key Insights
The North Sea Offshore Support Vessels (OSV) industry, while facing cyclical headwinds, exhibits a robust growth trajectory, projected to maintain a CAGR exceeding 2% from 2025 to 2033. This growth is primarily fueled by increasing offshore energy exploration and production activities, particularly driven by the ongoing transition to renewable energy sources like offshore wind farms. The significant investment in offshore wind infrastructure across the North Sea region necessitates specialized vessels for installation, maintenance, and support, significantly boosting demand. Furthermore, the persistent need for oil and gas extraction, albeit declining, continues to contribute to the market. Segmentally, the demand for OSVs from the renewable energy sector is rapidly outpacing traditional oil and gas, indicating a shift in industry dynamics. While the impact of global economic fluctuations and potential regulatory changes pose some restraints, the long-term prospects for the North Sea OSV market remain positive, underpinned by consistent investment in energy infrastructure and the growing need for specialized support services. The key players, including Bourbon Offshore, DOF Subsea, Solstad Offshore, Wagenborg, and North Star Shipping, are strategically positioning themselves to capitalize on these trends through fleet modernization and diversification of services. Geographical analysis reveals that the North Sea region, encompassing the UK, Norway, and other countries, will be the primary growth driver due to the high concentration of offshore energy projects.
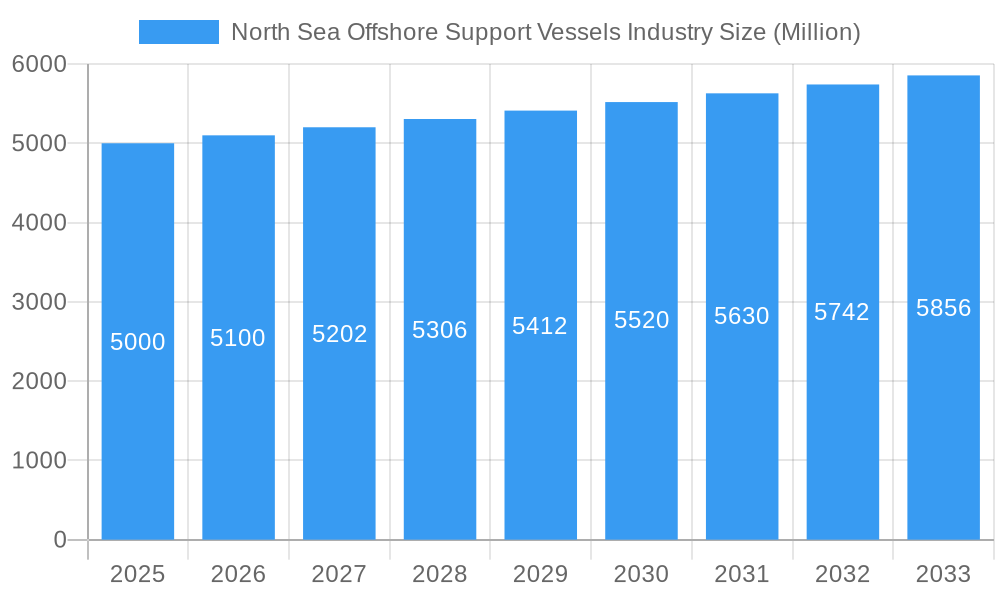
North Sea Offshore Support Vessels Industry Market Size (In Billion)
The competitive landscape is characterized by a mix of large international players and regional operators. The industry is consolidating, with mergers and acquisitions becoming increasingly common as companies strive for economies of scale and enhanced market share. Technological advancements, including the integration of automation and digitalization in OSV operations, are driving efficiency improvements and reducing operational costs. However, the industry faces challenges in attracting and retaining skilled personnel, and maintaining a balance between maximizing operational efficiency and ensuring environmental sustainability is an ongoing concern. The future growth trajectory hinges on the successful execution of offshore energy projects, sustained investment in renewable energy infrastructure, and the ability of OSV providers to adapt to the evolving regulatory landscape and technological advancements. A conservative estimate suggests that the market size in 2025 could be around 5 billion USD based on global market trends and the concentration of activity in the North Sea.
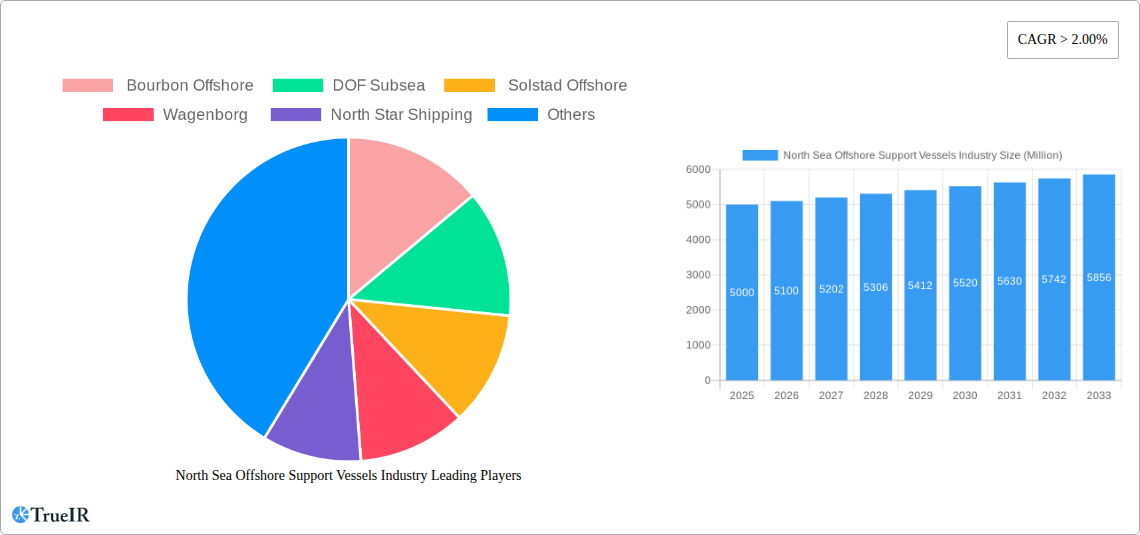
North Sea Offshore Support Vessels Industry Company Market Share
North Sea Offshore Support Vessels Industry Report: 2019-2033 Forecast
This comprehensive report provides a detailed analysis of the North Sea Offshore Support Vessels (OSV) industry, offering invaluable insights for investors, industry professionals, and strategic decision-makers. The study covers the period 2019-2033, with a focus on the base year 2025 and a forecast period extending to 2033. The report reveals a market valued at XX Million in 2025, projected to reach XX Million by 2033, exhibiting a robust Compound Annual Growth Rate (CAGR) of XX%. Key players like Bourbon Offshore, DOF Subsea, Solstad Offshore, Wagenborg, and North Star Shipping are analyzed extensively.
North Sea Offshore Support Vessels Industry Market Structure & Competitive Landscape
The North Sea OSV market exhibits a moderately concentrated structure, with a Herfindahl-Hirschman Index (HHI) of approximately xx in 2025. Key players such as Bourbon Offshore, DOF Subsea, and Solstad Offshore hold significant market share, driving innovation and shaping competitive dynamics. Regulatory changes, particularly concerning environmental regulations and safety standards, are major influences. Substitutes, such as remotely operated vehicles (ROVs) and autonomous underwater vehicles (AUVs), are gradually impacting the market, although traditional OSVs maintain a dominant position due to their versatility and handling of complex tasks. End-user segmentation is dominated by the oil and gas sector, with growing contributions from the renewable energy sector. The historical period (2019-2024) witnessed several mergers and acquisitions (M&A) totaling approximately xx Million, reflecting consolidation within the industry. Future M&A activity is anticipated, driven by the need for economies of scale and technological upgrades.
- Market Concentration: HHI of approximately xx in 2025.
- Innovation Drivers: Technological advancements in vessel design, automation, and environmental compliance.
- Regulatory Impacts: Stringent safety and environmental regulations shaping market dynamics.
- Product Substitutes: Increasing adoption of ROVs and AUVs, but traditional OSVs remain dominant.
- End-User Segmentation: Primarily Oil & Gas, increasing participation from Renewables.
- M&A Trends: xx Million in M&A activity (2019-2024), with further consolidation expected.
North Sea Offshore Support Vessels Industry Market Trends & Opportunities
The North Sea OSV market is experiencing significant growth fueled by increasing offshore energy exploration and production activities. The market size is projected to expand at a CAGR of XX% during the forecast period (2025-2033), driven by rising demand for support vessels in oil & gas and the burgeoning renewable energy sector. Technological advancements, such as the adoption of advanced automation and remote operation capabilities, are enhancing operational efficiency and safety. The preference for environmentally friendly vessels is also gaining momentum. The competitive landscape is intensifying with new entrants and existing players focusing on strategic partnerships and technological innovation to gain a competitive edge. Market penetration rates are expected to increase significantly, particularly in the renewable energy segment. Further exploration of undersea resources, particularly within the context of offshore wind farms, also represents a significant opportunity for OSV operators.
Dominant Markets & Segments in North Sea Offshore Support Vessels Industry
The dominant segment within the North Sea OSV market is the Oil & Gas sector, specifically focusing on the Natural Gas and Oil generation sources. The UK and Norway are leading countries within the North Sea region.
- Key Growth Drivers in Oil & Gas:
- Continued exploration and production activities.
- Increasing offshore infrastructure development.
- Government support for energy security.
- Key Growth Drivers in Renewables:
- Expansion of offshore wind farms.
- Growing demand for subsea cable installation and maintenance support.
- Government incentives and subsidies for renewable energy projects.
- Dominant End-User: Oil & Gas (Industrial) represents the largest end-user segment. However, the Commercial and Industrial sectors related to offshore wind farms are exhibiting rapid growth.
North Sea Offshore Support Vessels Industry Product Analysis
The North Sea OSV market features a diverse range of vessels, each tailored to specific tasks. Innovation focuses on enhanced capabilities in areas such as DP (dynamic positioning), improved fuel efficiency, and environmental compliance. Key innovations include advanced automation systems, reducing reliance on crew and boosting safety. The market fit is driven by operational requirements, regulatory compliance, and cost-effectiveness. These advancements enhance operational efficiency and competitiveness within the industry.
Key Drivers, Barriers & Challenges in North Sea Offshore Support Vessels Industry
Key Drivers: Increased offshore energy exploration, particularly in oil and gas and renewables; demand for specialized vessels for complex subsea operations; government initiatives supporting the energy sector.
Key Challenges: Fluctuating oil and gas prices; stringent environmental regulations increasing operational costs; intense competition amongst OSV providers; potential supply chain disruptions impacting vessel availability and maintenance; securing skilled labor.
Growth Drivers in the North Sea Offshore Support Vessels Industry Market
The growth of the North Sea OSV market is primarily fueled by the ongoing exploration and expansion of offshore energy resources, especially within the renewable energy sector. Government support and investment in offshore wind farms are significant contributors. Technological advancements, leading to more efficient and environmentally friendly vessels, also represent a key driver.
Challenges Impacting North Sea Offshore Support Vessels Industry Growth
The industry faces challenges from volatile oil prices, affecting profitability and investment decisions. Strict environmental regulations impose high compliance costs, impacting operational margins. The competitive landscape is intense, necessitating continuous innovation to maintain market share. Supply chain disruptions can impact vessel maintenance and availability, resulting in operational delays and increased costs.
Key Players Shaping the North Sea Offshore Support Vessels Industry Market
- Bourbon Offshore
- DOF Subsea
- Solstad Offshore
- Wagenborg
- North Star Shipping
Significant North Sea Offshore Support Vessels Industry Industry Milestones
- 2021: Introduction of new emission reduction standards for OSVs in the North Sea.
- 2022: Successful completion of the first large-scale offshore wind farm installation using advanced OSV technology.
- 2023: Merger between two major OSV operators, leading to increased market consolidation.
- 2024: Several significant contracts awarded to OSV operators for supporting offshore wind projects.
Future Outlook for North Sea Offshore Support Vessels Industry Market
The North Sea OSV market is poised for sustained growth driven by the energy transition towards renewables and continued investment in oil & gas exploration. Strategic opportunities exist in expanding capacity for supporting offshore wind installations and embracing new technologies like autonomous vessels. The market holds significant potential for companies that can adapt to evolving regulatory landscapes and embrace sustainable practices.
North Sea Offshore Support Vessels Industry Segmentation
- 1. Production Analysis
- 2. Consumption Analysis
- 3. Import Market Analysis (Value & Volume)
- 4. Export Market Analysis (Value & Volume)
- 5. Price Trend Analysis
North Sea Offshore Support Vessels Industry Segmentation By Geography
- 1. United Kingdom
- 2. Norway
- 3. Denmark
- 4. Germany
- 5. Rest of North Sea
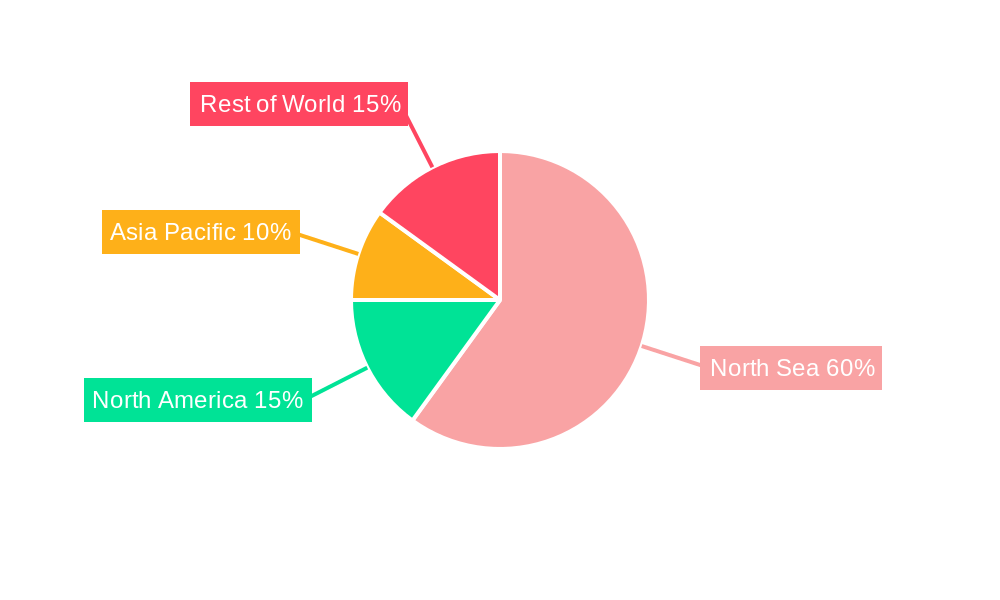
North Sea Offshore Support Vessels Industry Regional Market Share
Geographic Coverage of North Sea Offshore Support Vessels Industry
North Sea Offshore Support Vessels Industry REPORT HIGHLIGHTS
| Aspects | Details |
|---|---|
| Study Period | 2020-2034 |
| Base Year | 2025 |
| Estimated Year | 2026 |
| Forecast Period | 2026-2034 |
| Historical Period | 2020-2025 |
| Growth Rate | CAGR of > 2.00% from 2020-2034 |
| Segmentation |
|
Table of Contents
- 1. Introduction
- 1.1. Research Scope
- 1.2. Market Segmentation
- 1.3. Research Objective
- 1.4. Definitions and Assumptions
- 2. Executive Summary
- 2.1. Market Snapshot
- 3. Market Dynamics
- 3.1. Market Drivers
- 3.2. Market Restrains
- 3.3. Market Trends
- 3.4. Market Opportunities
- 4. Market Factor Analysis
- 4.1. Porters Five Forces
- 4.1.1. Bargaining Power of Suppliers
- 4.1.2. Bargaining Power of Buyers
- 4.1.3. Threat of New Entrants
- 4.1.4. Threat of Substitutes
- 4.1.5. Competitive Rivalry
- 4.2. PESTEL analysis
- 4.3. BCG Analysis
- 4.3.1. Stars (High Growth, High Market Share)
- 4.3.2. Cash Cows (Low Growth, High Market Share)
- 4.3.3. Question Mark (High Growth, Low Market Share)
- 4.3.4. Dogs (Low Growth, Low Market Share)
- 4.4. Ansoff Matrix Analysis
- 4.5. Supply Chain Analysis
- 4.6. Regulatory Landscape
- 4.7. Current Market Potential and Opportunity Assessment (TAM–SAM–SOM Framework)
- 4.8. TIR Analyst Note
- 4.1. Porters Five Forces
- 5. Market Analysis, Insights and Forecast 2021-2033
- 5.1. Market Analysis, Insights and Forecast - by Production Analysis
- 5.2. Market Analysis, Insights and Forecast - by Consumption Analysis
- 5.3. Market Analysis, Insights and Forecast - by Import Market Analysis (Value & Volume)
- 5.4. Market Analysis, Insights and Forecast - by Export Market Analysis (Value & Volume)
- 5.5. Market Analysis, Insights and Forecast - by Price Trend Analysis
- 5.6. Market Analysis, Insights and Forecast - by Region
- 5.6.1. United Kingdom
- 5.6.2. Norway
- 5.6.3. Denmark
- 5.6.4. Germany
- 5.6.5. Rest of North Sea
- 6. Global North Sea Offshore Support Vessels Industry Analysis, Insights and Forecast, 2021-2033
- 6.1. Market Analysis, Insights and Forecast - by Production Analysis
- 6.2. Market Analysis, Insights and Forecast - by Consumption Analysis
- 6.3. Market Analysis, Insights and Forecast - by Import Market Analysis (Value & Volume)
- 6.4. Market Analysis, Insights and Forecast - by Export Market Analysis (Value & Volume)
- 6.5. Market Analysis, Insights and Forecast - by Price Trend Analysis
- 7. United Kingdom North Sea Offshore Support Vessels Industry Analysis, Insights and Forecast, 2020-2032
- 7.1. Market Analysis, Insights and Forecast - by Production Analysis
- 7.2. Market Analysis, Insights and Forecast - by Consumption Analysis
- 7.3. Market Analysis, Insights and Forecast - by Import Market Analysis (Value & Volume)
- 7.4. Market Analysis, Insights and Forecast - by Export Market Analysis (Value & Volume)
- 7.5. Market Analysis, Insights and Forecast - by Price Trend Analysis
- 8. Norway North Sea Offshore Support Vessels Industry Analysis, Insights and Forecast, 2020-2032
- 8.1. Market Analysis, Insights and Forecast - by Production Analysis
- 8.2. Market Analysis, Insights and Forecast - by Consumption Analysis
- 8.3. Market Analysis, Insights and Forecast - by Import Market Analysis (Value & Volume)
- 8.4. Market Analysis, Insights and Forecast - by Export Market Analysis (Value & Volume)
- 8.5. Market Analysis, Insights and Forecast - by Price Trend Analysis
- 9. Denmark North Sea Offshore Support Vessels Industry Analysis, Insights and Forecast, 2020-2032
- 9.1. Market Analysis, Insights and Forecast - by Production Analysis
- 9.2. Market Analysis, Insights and Forecast - by Consumption Analysis
- 9.3. Market Analysis, Insights and Forecast - by Import Market Analysis (Value & Volume)
- 9.4. Market Analysis, Insights and Forecast - by Export Market Analysis (Value & Volume)
- 9.5. Market Analysis, Insights and Forecast - by Price Trend Analysis
- 10. Germany North Sea Offshore Support Vessels Industry Analysis, Insights and Forecast, 2020-2032
- 10.1. Market Analysis, Insights and Forecast - by Production Analysis
- 10.2. Market Analysis, Insights and Forecast - by Consumption Analysis
- 10.3. Market Analysis, Insights and Forecast - by Import Market Analysis (Value & Volume)
- 10.4. Market Analysis, Insights and Forecast - by Export Market Analysis (Value & Volume)
- 10.5. Market Analysis, Insights and Forecast - by Price Trend Analysis
- 11. Rest of North Sea North Sea Offshore Support Vessels Industry Analysis, Insights and Forecast, 2020-2032
- 11.1. Market Analysis, Insights and Forecast - by Production Analysis
- 11.2. Market Analysis, Insights and Forecast - by Consumption Analysis
- 11.3. Market Analysis, Insights and Forecast - by Import Market Analysis (Value & Volume)
- 11.4. Market Analysis, Insights and Forecast - by Export Market Analysis (Value & Volume)
- 11.5. Market Analysis, Insights and Forecast - by Price Trend Analysis
- 12. Competitive Analysis
- 12.1. Company Profiles
- 12.1.1 Bourbon Offshore
- 12.1.1.1. Company Overview
- 12.1.1.2. Products
- 12.1.1.3. Company Financials
- 12.1.1.4. SWOT Analysis
- 12.1.2 DOF Subsea
- 12.1.2.1. Company Overview
- 12.1.2.2. Products
- 12.1.2.3. Company Financials
- 12.1.2.4. SWOT Analysis
- 12.1.3 Solstad Offshore
- 12.1.3.1. Company Overview
- 12.1.3.2. Products
- 12.1.3.3. Company Financials
- 12.1.3.4. SWOT Analysis
- 12.1.4 Wagenborg
- 12.1.4.1. Company Overview
- 12.1.4.2. Products
- 12.1.4.3. Company Financials
- 12.1.4.4. SWOT Analysis
- 12.1.5 North Star Shipping
- 12.1.5.1. Company Overview
- 12.1.5.2. Products
- 12.1.5.3. Company Financials
- 12.1.5.4. SWOT Analysis
- 12.1.1 Bourbon Offshore
- 12.2. Market Entropy
- 12.2.1 Company's Key Areas Served
- 12.2.2 Recent Developments
- 12.3. Company Market Share Analysis 2025
- 12.3.1 Top 5 Companies Market Share Analysis
- 12.3.2 Top 3 Companies Market Share Analysis
- 12.4. List of Potential Customers
- 13. Research Methodology
List of Figures
- Figure 1: Global North Sea Offshore Support Vessels Industry Revenue Breakdown (Million, %) by Region 2025 & 2033
- Figure 2: United Kingdom North Sea Offshore Support Vessels Industry Revenue (Million), by Production Analysis 2025 & 2033
- Figure 3: United Kingdom North Sea Offshore Support Vessels Industry Revenue Share (%), by Production Analysis 2025 & 2033
- Figure 4: United Kingdom North Sea Offshore Support Vessels Industry Revenue (Million), by Consumption Analysis 2025 & 2033
- Figure 5: United Kingdom North Sea Offshore Support Vessels Industry Revenue Share (%), by Consumption Analysis 2025 & 2033
- Figure 6: United Kingdom North Sea Offshore Support Vessels Industry Revenue (Million), by Import Market Analysis (Value & Volume) 2025 & 2033
- Figure 7: United Kingdom North Sea Offshore Support Vessels Industry Revenue Share (%), by Import Market Analysis (Value & Volume) 2025 & 2033
- Figure 8: United Kingdom North Sea Offshore Support Vessels Industry Revenue (Million), by Export Market Analysis (Value & Volume) 2025 & 2033
- Figure 9: United Kingdom North Sea Offshore Support Vessels Industry Revenue Share (%), by Export Market Analysis (Value & Volume) 2025 & 2033
- Figure 10: United Kingdom North Sea Offshore Support Vessels Industry Revenue (Million), by Price Trend Analysis 2025 & 2033
- Figure 11: United Kingdom North Sea Offshore Support Vessels Industry Revenue Share (%), by Price Trend Analysis 2025 & 2033
- Figure 12: United Kingdom North Sea Offshore Support Vessels Industry Revenue (Million), by Country 2025 & 2033
- Figure 13: United Kingdom North Sea Offshore Support Vessels Industry Revenue Share (%), by Country 2025 & 2033
- Figure 14: Norway North Sea Offshore Support Vessels Industry Revenue (Million), by Production Analysis 2025 & 2033
- Figure 15: Norway North Sea Offshore Support Vessels Industry Revenue Share (%), by Production Analysis 2025 & 2033
- Figure 16: Norway North Sea Offshore Support Vessels Industry Revenue (Million), by Consumption Analysis 2025 & 2033
- Figure 17: Norway North Sea Offshore Support Vessels Industry Revenue Share (%), by Consumption Analysis 2025 & 2033
- Figure 18: Norway North Sea Offshore Support Vessels Industry Revenue (Million), by Import Market Analysis (Value & Volume) 2025 & 2033
- Figure 19: Norway North Sea Offshore Support Vessels Industry Revenue Share (%), by Import Market Analysis (Value & Volume) 2025 & 2033
- Figure 20: Norway North Sea Offshore Support Vessels Industry Revenue (Million), by Export Market Analysis (Value & Volume) 2025 & 2033
- Figure 21: Norway North Sea Offshore Support Vessels Industry Revenue Share (%), by Export Market Analysis (Value & Volume) 2025 & 2033
- Figure 22: Norway North Sea Offshore Support Vessels Industry Revenue (Million), by Price Trend Analysis 2025 & 2033
- Figure 23: Norway North Sea Offshore Support Vessels Industry Revenue Share (%), by Price Trend Analysis 2025 & 2033
- Figure 24: Norway North Sea Offshore Support Vessels Industry Revenue (Million), by Country 2025 & 2033
- Figure 25: Norway North Sea Offshore Support Vessels Industry Revenue Share (%), by Country 2025 & 2033
- Figure 26: Denmark North Sea Offshore Support Vessels Industry Revenue (Million), by Production Analysis 2025 & 2033
- Figure 27: Denmark North Sea Offshore Support Vessels Industry Revenue Share (%), by Production Analysis 2025 & 2033
- Figure 28: Denmark North Sea Offshore Support Vessels Industry Revenue (Million), by Consumption Analysis 2025 & 2033
- Figure 29: Denmark North Sea Offshore Support Vessels Industry Revenue Share (%), by Consumption Analysis 2025 & 2033
- Figure 30: Denmark North Sea Offshore Support Vessels Industry Revenue (Million), by Import Market Analysis (Value & Volume) 2025 & 2033
- Figure 31: Denmark North Sea Offshore Support Vessels Industry Revenue Share (%), by Import Market Analysis (Value & Volume) 2025 & 2033
- Figure 32: Denmark North Sea Offshore Support Vessels Industry Revenue (Million), by Export Market Analysis (Value & Volume) 2025 & 2033
- Figure 33: Denmark North Sea Offshore Support Vessels Industry Revenue Share (%), by Export Market Analysis (Value & Volume) 2025 & 2033
- Figure 34: Denmark North Sea Offshore Support Vessels Industry Revenue (Million), by Price Trend Analysis 2025 & 2033
- Figure 35: Denmark North Sea Offshore Support Vessels Industry Revenue Share (%), by Price Trend Analysis 2025 & 2033
- Figure 36: Denmark North Sea Offshore Support Vessels Industry Revenue (Million), by Country 2025 & 2033
- Figure 37: Denmark North Sea Offshore Support Vessels Industry Revenue Share (%), by Country 2025 & 2033
- Figure 38: Germany North Sea Offshore Support Vessels Industry Revenue (Million), by Production Analysis 2025 & 2033
- Figure 39: Germany North Sea Offshore Support Vessels Industry Revenue Share (%), by Production Analysis 2025 & 2033
- Figure 40: Germany North Sea Offshore Support Vessels Industry Revenue (Million), by Consumption Analysis 2025 & 2033
- Figure 41: Germany North Sea Offshore Support Vessels Industry Revenue Share (%), by Consumption Analysis 2025 & 2033
- Figure 42: Germany North Sea Offshore Support Vessels Industry Revenue (Million), by Import Market Analysis (Value & Volume) 2025 & 2033
- Figure 43: Germany North Sea Offshore Support Vessels Industry Revenue Share (%), by Import Market Analysis (Value & Volume) 2025 & 2033
- Figure 44: Germany North Sea Offshore Support Vessels Industry Revenue (Million), by Export Market Analysis (Value & Volume) 2025 & 2033
- Figure 45: Germany North Sea Offshore Support Vessels Industry Revenue Share (%), by Export Market Analysis (Value & Volume) 2025 & 2033
- Figure 46: Germany North Sea Offshore Support Vessels Industry Revenue (Million), by Price Trend Analysis 2025 & 2033
- Figure 47: Germany North Sea Offshore Support Vessels Industry Revenue Share (%), by Price Trend Analysis 2025 & 2033
- Figure 48: Germany North Sea Offshore Support Vessels Industry Revenue (Million), by Country 2025 & 2033
- Figure 49: Germany North Sea Offshore Support Vessels Industry Revenue Share (%), by Country 2025 & 2033
- Figure 50: Rest of North Sea North Sea Offshore Support Vessels Industry Revenue (Million), by Production Analysis 2025 & 2033
- Figure 51: Rest of North Sea North Sea Offshore Support Vessels Industry Revenue Share (%), by Production Analysis 2025 & 2033
- Figure 52: Rest of North Sea North Sea Offshore Support Vessels Industry Revenue (Million), by Consumption Analysis 2025 & 2033
- Figure 53: Rest of North Sea North Sea Offshore Support Vessels Industry Revenue Share (%), by Consumption Analysis 2025 & 2033
- Figure 54: Rest of North Sea North Sea Offshore Support Vessels Industry Revenue (Million), by Import Market Analysis (Value & Volume) 2025 & 2033
- Figure 55: Rest of North Sea North Sea Offshore Support Vessels Industry Revenue Share (%), by Import Market Analysis (Value & Volume) 2025 & 2033
- Figure 56: Rest of North Sea North Sea Offshore Support Vessels Industry Revenue (Million), by Export Market Analysis (Value & Volume) 2025 & 2033
- Figure 57: Rest of North Sea North Sea Offshore Support Vessels Industry Revenue Share (%), by Export Market Analysis (Value & Volume) 2025 & 2033
- Figure 58: Rest of North Sea North Sea Offshore Support Vessels Industry Revenue (Million), by Price Trend Analysis 2025 & 2033
- Figure 59: Rest of North Sea North Sea Offshore Support Vessels Industry Revenue Share (%), by Price Trend Analysis 2025 & 2033
- Figure 60: Rest of North Sea North Sea Offshore Support Vessels Industry Revenue (Million), by Country 2025 & 2033
- Figure 61: Rest of North Sea North Sea Offshore Support Vessels Industry Revenue Share (%), by Country 2025 & 2033
List of Tables
- Table 1: Global North Sea Offshore Support Vessels Industry Revenue Million Forecast, by Production Analysis 2020 & 2033
- Table 2: Global North Sea Offshore Support Vessels Industry Revenue Million Forecast, by Consumption Analysis 2020 & 2033
- Table 3: Global North Sea Offshore Support Vessels Industry Revenue Million Forecast, by Import Market Analysis (Value & Volume) 2020 & 2033
- Table 4: Global North Sea Offshore Support Vessels Industry Revenue Million Forecast, by Export Market Analysis (Value & Volume) 2020 & 2033
- Table 5: Global North Sea Offshore Support Vessels Industry Revenue Million Forecast, by Price Trend Analysis 2020 & 2033
- Table 6: Global North Sea Offshore Support Vessels Industry Revenue Million Forecast, by Region 2020 & 2033
- Table 7: Global North Sea Offshore Support Vessels Industry Revenue Million Forecast, by Production Analysis 2020 & 2033
- Table 8: Global North Sea Offshore Support Vessels Industry Revenue Million Forecast, by Consumption Analysis 2020 & 2033
- Table 9: Global North Sea Offshore Support Vessels Industry Revenue Million Forecast, by Import Market Analysis (Value & Volume) 2020 & 2033
- Table 10: Global North Sea Offshore Support Vessels Industry Revenue Million Forecast, by Export Market Analysis (Value & Volume) 2020 & 2033
- Table 11: Global North Sea Offshore Support Vessels Industry Revenue Million Forecast, by Price Trend Analysis 2020 & 2033
- Table 12: Global North Sea Offshore Support Vessels Industry Revenue Million Forecast, by Country 2020 & 2033
- Table 13: Global North Sea Offshore Support Vessels Industry Revenue Million Forecast, by Production Analysis 2020 & 2033
- Table 14: Global North Sea Offshore Support Vessels Industry Revenue Million Forecast, by Consumption Analysis 2020 & 2033
- Table 15: Global North Sea Offshore Support Vessels Industry Revenue Million Forecast, by Import Market Analysis (Value & Volume) 2020 & 2033
- Table 16: Global North Sea Offshore Support Vessels Industry Revenue Million Forecast, by Export Market Analysis (Value & Volume) 2020 & 2033
- Table 17: Global North Sea Offshore Support Vessels Industry Revenue Million Forecast, by Price Trend Analysis 2020 & 2033
- Table 18: Global North Sea Offshore Support Vessels Industry Revenue Million Forecast, by Country 2020 & 2033
- Table 19: Global North Sea Offshore Support Vessels Industry Revenue Million Forecast, by Production Analysis 2020 & 2033
- Table 20: Global North Sea Offshore Support Vessels Industry Revenue Million Forecast, by Consumption Analysis 2020 & 2033
- Table 21: Global North Sea Offshore Support Vessels Industry Revenue Million Forecast, by Import Market Analysis (Value & Volume) 2020 & 2033
- Table 22: Global North Sea Offshore Support Vessels Industry Revenue Million Forecast, by Export Market Analysis (Value & Volume) 2020 & 2033
- Table 23: Global North Sea Offshore Support Vessels Industry Revenue Million Forecast, by Price Trend Analysis 2020 & 2033
- Table 24: Global North Sea Offshore Support Vessels Industry Revenue Million Forecast, by Country 2020 & 2033
- Table 25: Global North Sea Offshore Support Vessels Industry Revenue Million Forecast, by Production Analysis 2020 & 2033
- Table 26: Global North Sea Offshore Support Vessels Industry Revenue Million Forecast, by Consumption Analysis 2020 & 2033
- Table 27: Global North Sea Offshore Support Vessels Industry Revenue Million Forecast, by Import Market Analysis (Value & Volume) 2020 & 2033
- Table 28: Global North Sea Offshore Support Vessels Industry Revenue Million Forecast, by Export Market Analysis (Value & Volume) 2020 & 2033
- Table 29: Global North Sea Offshore Support Vessels Industry Revenue Million Forecast, by Price Trend Analysis 2020 & 2033
- Table 30: Global North Sea Offshore Support Vessels Industry Revenue Million Forecast, by Country 2020 & 2033
- Table 31: Global North Sea Offshore Support Vessels Industry Revenue Million Forecast, by Production Analysis 2020 & 2033
- Table 32: Global North Sea Offshore Support Vessels Industry Revenue Million Forecast, by Consumption Analysis 2020 & 2033
- Table 33: Global North Sea Offshore Support Vessels Industry Revenue Million Forecast, by Import Market Analysis (Value & Volume) 2020 & 2033
- Table 34: Global North Sea Offshore Support Vessels Industry Revenue Million Forecast, by Export Market Analysis (Value & Volume) 2020 & 2033
- Table 35: Global North Sea Offshore Support Vessels Industry Revenue Million Forecast, by Price Trend Analysis 2020 & 2033
- Table 36: Global North Sea Offshore Support Vessels Industry Revenue Million Forecast, by Country 2020 & 2033
Frequently Asked Questions
1. What is the projected Compound Annual Growth Rate (CAGR) of the North Sea Offshore Support Vessels Industry?
The projected CAGR is approximately > 2.00%.
2. Which companies are prominent players in the North Sea Offshore Support Vessels Industry?
Key companies in the market include Bourbon Offshore , DOF Subsea , Solstad Offshore , Wagenborg , North Star Shipping.
3. What are the main segments of the North Sea Offshore Support Vessels Industry?
The market segments include Production Analysis, Consumption Analysis, Import Market Analysis (Value & Volume), Export Market Analysis (Value & Volume), Price Trend Analysis.
4. Can you provide details about the market size?
The market size is estimated to be USD XX Million as of 2022.
5. What are some drivers contributing to market growth?
4.; Growing Power Demand4.; Growth of Renewables.
6. What are the notable trends driving market growth?
Increasing Demand for Platform Supply Vessels (PSVs).
7. Are there any restraints impacting market growth?
4.; Unstable Political Scenario of the Country.
8. Can you provide examples of recent developments in the market?
N/A
9. What pricing options are available for accessing the report?
Pricing options include single-user, multi-user, and enterprise licenses priced at USD 4750, USD 5250, and USD 8750 respectively.
10. Is the market size provided in terms of value or volume?
The market size is provided in terms of value, measured in Million.
11. Are there any specific market keywords associated with the report?
Yes, the market keyword associated with the report is "North Sea Offshore Support Vessels Industry," which aids in identifying and referencing the specific market segment covered.
12. How do I determine which pricing option suits my needs best?
The pricing options vary based on user requirements and access needs. Individual users may opt for single-user licenses, while businesses requiring broader access may choose multi-user or enterprise licenses for cost-effective access to the report.
13. Are there any additional resources or data provided in the North Sea Offshore Support Vessels Industry report?
While the report offers comprehensive insights, it's advisable to review the specific contents or supplementary materials provided to ascertain if additional resources or data are available.
14. How can I stay updated on further developments or reports in the North Sea Offshore Support Vessels Industry?
To stay informed about further developments, trends, and reports in the North Sea Offshore Support Vessels Industry, consider subscribing to industry newsletters, following relevant companies and organizations, or regularly checking reputable industry news sources and publications.
Methodology
Step 1 - Identification of Relevant Samples Size from Population Database


Step 2 - Approaches for Defining Global Market Size (Value, Volume* & Price*)

Note*: In applicable scenarios
Step 3 - Data Sources
Primary Research
- Web Analytics
- Survey Reports
- Research Institute
- Latest Research Reports
- Opinion Leaders
Secondary Research
- Annual Reports
- White Paper
- Latest Press Release
- Industry Association
- Paid Database
- Investor Presentations

Step 4 - Data Triangulation
Involves using different sources of information in order to increase the validity of a study
These sources are likely to be stakeholders in a program - participants, other researchers, program staff, other community members, and so on.
Then we put all data in single framework & apply various statistical tools to find out the dynamic on the market.
During the analysis stage, feedback from the stakeholder groups would be compared to determine areas of agreement as well as areas of divergence