

Key Insights
The global Nuclear Power Reactor Decommissioning market is poised for substantial expansion, driven by an aging nuclear fleet and evolving regulatory landscapes mandating safe and effective plant retirement. The market, valued at $8170.1 million in 2023, is projected to grow at a Compound Annual Growth Rate (CAGR) of 4% through 2033. This growth trajectory is underpinned by the increasing number of reactors reaching their end-of-service life, particularly in established nuclear power regions. Advancements in decommissioning technologies, including robotics and remote systems, are enhancing operational efficiency and cost-effectiveness, further stimulating market development. Key challenges include the significant capital investment required, the complexities of radioactive waste management, and navigating regulatory frameworks. The market is segmented by reactor type (e.g., Pressurized Water Reactor), application (e.g., Commercial Power Reactor), and capacity (e.g., 100-1000 MW), presenting targeted opportunities for specialized service providers. Leading industry players such as Aecom, Orano Group, and Westinghouse Electric Company underscore the market's maturity and competitive dynamics. Geographic expansion is anticipated, with the Asia Pacific region emerging as a key growth area due to a rising number of aging reactors and expanding nuclear energy programs.
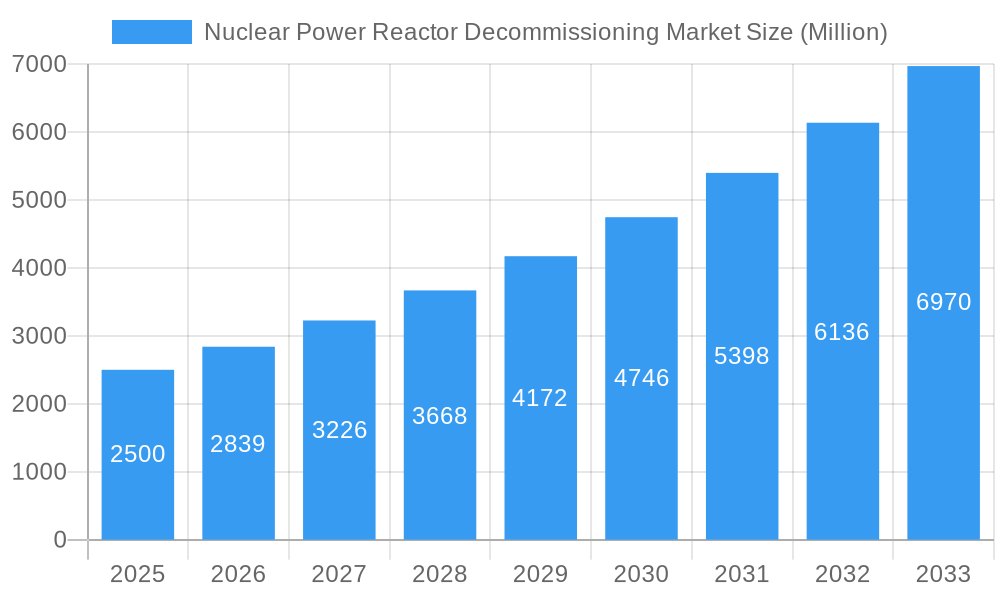
Nuclear Power Reactor Decommissioning Market Market Size (In Billion)
Market segmentation offers detailed insights into growth potential. The Pressurized Water Reactor (PWR) segment is expected to lead due to the global prevalence of PWRs nearing retirement. The Commercial Power Reactor application segment commands the largest share, reflecting the extensive number of commercial facilities requiring decommissioning. Within capacity segments, the 100-1000 MW range is anticipated to exhibit strong growth, aligning with the most common reactor capacities. While North America and Europe currently lead decommissioning activities, the Asia Pacific region is projected for significant future growth, driven by aging reactors in countries like Japan, South Korea, and China. This dynamic presents a compelling and expanding market with considerable prospects for both established and emerging companies in the Nuclear Power Reactor Decommissioning sector.
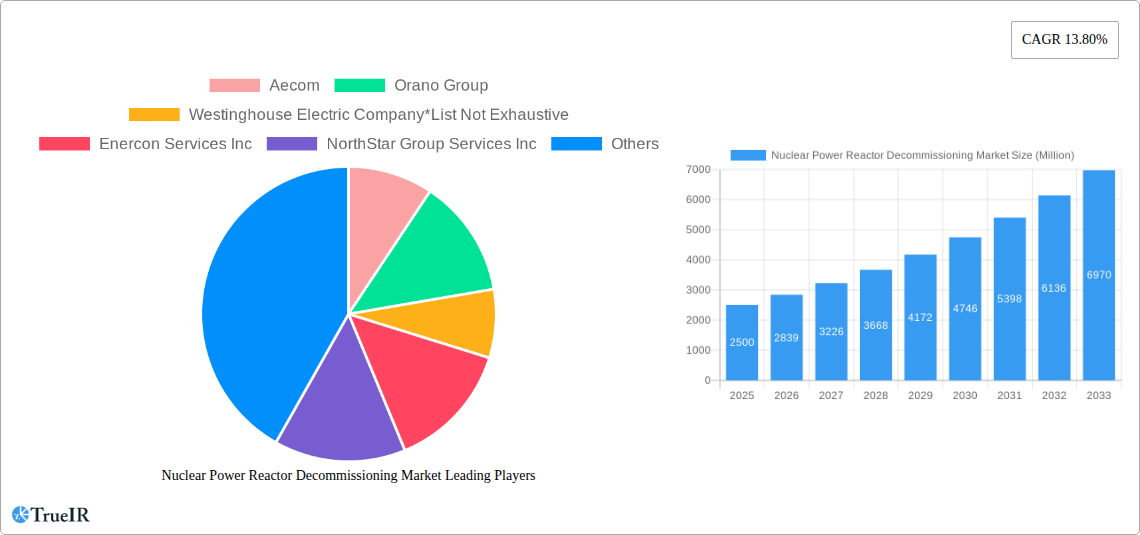
Nuclear Power Reactor Decommissioning Market Company Market Share
Nuclear Power Reactor Decommissioning Market: A Comprehensive Report (2019-2033)
This in-depth report provides a comprehensive analysis of the global Nuclear Power Reactor Decommissioning market, offering valuable insights for stakeholders across the nuclear energy sector. Covering the period from 2019 to 2033, with a focus on 2025, this report meticulously examines market dynamics, competitive landscapes, and future growth prospects. The market is projected to reach xx Million by 2033, exhibiting a CAGR of xx% during the forecast period (2025-2033).
Nuclear Power Reactor Decommissioning Market Structure & Competitive Landscape
The nuclear power reactor decommissioning market is characterized by a moderately concentrated competitive landscape. Key players, including AECOM, Orano Group, Westinghouse Electric Company, Enercon Services Inc, NorthStar Group Services Inc, GE Hitachi Nuclear Services, James Fisher & Sons PLC, Bechtel Group Inc, Fluor Corporation, Babcock International Group PLC, and Studsvik AB, hold significant market share. However, the market also accommodates several smaller, specialized firms. The Herfindahl-Hirschman Index (HHI) for the market in 2024 was estimated at xx, suggesting a moderately concentrated structure.
- Innovation Drivers: Advancements in robotics, AI-powered decommissioning techniques, and improved waste management solutions are driving market innovation.
- Regulatory Impacts: Stringent safety regulations and evolving international nuclear safety standards significantly influence market growth and operational practices. Changes in regulatory frameworks in key markets like the EU and the US are expected to create both opportunities and challenges.
- Product Substitutes: While no direct substitutes exist for the specialized services involved in nuclear reactor decommissioning, cost-optimization strategies and alternative waste management techniques exert indirect competitive pressure.
- End-User Segmentation: The market primarily serves commercial power reactor operators, research institutions, and government agencies involved in managing nuclear facilities.
- M&A Trends: The past five years have witnessed xx M&A deals in the sector, primarily focused on consolidation and expansion into new geographical markets. This trend is likely to continue, driven by the need for specialized expertise and economies of scale.
Nuclear Power Reactor Decommissioning Market Trends & Opportunities
The global nuclear power reactor decommissioning market is experiencing robust growth, driven by the aging global nuclear power plant fleet. An increasing number of reactors are nearing the end of their operational lifespan, creating a substantial demand for decommissioning services. This trend is further amplified by stricter regulatory requirements for safe and environmentally sound decommissioning processes. Technological advancements, including automation and robotics, are improving decommissioning efficiency and reducing associated costs, opening up significant opportunities for market participants. The market's growth is also fueled by rising government investments in nuclear waste management infrastructure and the adoption of innovative dismantling techniques. The market size is projected to grow from xx Million in 2024 to xx Million in 2033, exhibiting a CAGR of xx%. Market penetration rates vary significantly across regions, with developed economies showing higher adoption rates compared to emerging markets.
Dominant Markets & Segments in Nuclear Power Reactor Decommissioning Market
The North American market continues to be a powerhouse in the global nuclear power reactor decommissioning landscape. This dominance is largely attributed to a substantial fleet of aging reactors nearing the end of their operational lifespan and the presence of well-established and rigorous regulatory frameworks that mandate comprehensive decommissioning plans. Following closely, the European market exhibits significant and ongoing decommissioning activity, particularly in nations such as France, Germany, and the United Kingdom, each with its unique set of policy drivers and historical nuclear presence. The Asia-Pacific region is emerging as a market with rapidly growing demand, primarily propelled by the extensive aging reactor infrastructure in key countries like Japan and South Korea, which are actively pursuing large-scale decommissioning projects.
- By Reactor Type: Pressurized Water Reactors (PWRs) command the largest market share. This is a direct reflection of their widespread global adoption and the sheer volume of PWRs that have been and will be brought offline for decommissioning.
- By Application: Commercial Power Reactors represent the most substantial segment of the market. The vast number of these operational facilities that are reaching retirement age and require meticulous decommissioning procedures underscores their leading position.
- By Capacity: The 100-1000 MW capacity segment currently dominates. This reflects the prevalence of nuclear power plants within this operational capacity range that are now entering their decommissioning phases.
Key Growth Drivers:
- The globally aging nuclear reactor fleet, with many plants approaching their planned shutdown dates.
- Increasingly stringent regulatory compliance requirements and a focus on safety and environmental protection throughout the decommissioning process.
- Growing government commitment and allocation of funding for dedicated decommissioning initiatives and research.
- Continuous technological advancements and innovations in decommissioning methodologies, robotics, and waste management solutions, leading to more efficient and cost-effective approaches.
- The growing need for specialized expertise and skilled personnel to manage complex decommissioning projects.
- The development and adoption of sustainable and environmentally responsible decommissioning practices.
Nuclear Power Reactor Decommissioning Market Product Analysis
Technological advancements in robotics, remote handling systems, and advanced waste management technologies are revolutionizing the nuclear reactor decommissioning process. These innovations are leading to increased efficiency, reduced costs, and enhanced worker safety. The market is also seeing a shift towards integrated solutions that combine various decommissioning services, enabling a more streamlined and cost-effective approach. This focus on integrated solutions and technological advancement is driving the competitiveness within the market.
Key Drivers, Barriers & Challenges in Nuclear Power Reactor Decommissioning Market
Key Drivers:
- The aging global nuclear power plant fleet necessitates large-scale decommissioning efforts.
- Stringent environmental regulations and safety standards are driving demand for specialized services.
- Government funding and policy support are promoting the adoption of advanced decommissioning technologies.
Key Challenges & Restraints:
- The high cost of decommissioning represents a significant barrier for many operators. This is estimated to restrict market expansion by approximately xx% by 2030.
- The complex regulatory landscape and lengthy approval processes can delay projects significantly.
- Supply chain limitations for specialized equipment and skilled labor can pose operational challenges.
Growth Drivers in the Nuclear Power Reactor Decommissioning Market Market
The primary growth drivers include the increasing number of reactors reaching the end of their operational life, stricter regulatory standards for nuclear waste management, and ongoing technological advancements that enhance efficiency and reduce costs. Government policies promoting the safe decommissioning of nuclear facilities and investments in research and development further fuel market expansion.
Challenges Impacting Nuclear Power Reactor Decommissioning Market Growth
Significant challenges include the high capital expenditure required for decommissioning projects, complexities in obtaining regulatory approvals, and the specialized nature of the workforce needed for safe and efficient operation. Supply chain disruptions and potential fluctuations in material costs also contribute to market uncertainties.
Key Players Shaping the Nuclear Power Reactor Decommissioning Market Market
- Aecom
- Orano Group
- Westinghouse Electric Company
- Enercon Services Inc.
- NorthStar Group Services Inc.
- GE Hitachi Nuclear Energy
- James Fisher & Sons PLC
- Bechtel Group Inc.
- Fluor Corporation
- Babcock International Group PLC
- Studsvik AB
- Kiewit Corporation
- Jacobs Engineering Group
- EnergySolutions
Significant Nuclear Power Reactor Decommissioning Market Industry Milestones
- 2022: Orano Group successfully completed the decommissioning of a PWR reactor in France, showcasing advanced dismantling techniques.
- 2021: Westinghouse secured a major decommissioning contract for a BWR reactor in the United States, highlighting the company's market leadership.
- 2020: A significant investment in robotic technology was announced by several key players, accelerating the automation of decommissioning processes.
Future Outlook for Nuclear Power Reactor Decommissioning Market Market
The future outlook for the nuclear power reactor decommissioning market is decidedly positive and poised for substantial growth. This optimism is largely underpinned by the continuing trend of aging nuclear power plants worldwide, many of which are entering their final operational stages and thus requiring extensive decommissioning. The industry's trajectory will be significantly shaped by strategic collaborations between industry leaders, ongoing technological innovation, and sustained governmental and regulatory support. The successful development, deployment, and scaling of advanced decommissioning technologies, coupled with robust and efficient waste management strategies, will be critical determinants of future market expansion. Furthermore, proactive policy frameworks and continued investment in key global markets will foster a conducive environment for growth. The increasing demand for highly skilled labor and the imperative to develop sustainable, environmentally conscious decommissioning solutions are expected to present significant and lucrative investment opportunities for stakeholders across the value chain.
Nuclear Power Reactor Decommissioning Market Segmentation
-
1. Reactor Type
- 1.1. Pressurized Water Reactor
- 1.2. Pressurized Heavy Water Reactor
- 1.3. Boiling Water Reactor
- 1.4. High-temperature Gas-cooled Reactor
- 1.5. Liquid Metal Fast Breeder Reactor
- 1.6. Other Reactor Types
-
2. Application
- 2.1. Commercial Power Reactor
- 2.2. Prototype Power Reactor
- 2.3. Research Reactor
-
3. Capacity
- 3.1. Below 100 MW
- 3.2. 100-1000 MW
- 3.3. Above 1000 MW
Nuclear Power Reactor Decommissioning Market Segmentation By Geography
- 1. North America
- 2. Asia Pacific
- 3. Europe
- 4. South America
- 5. Middle East and Africa
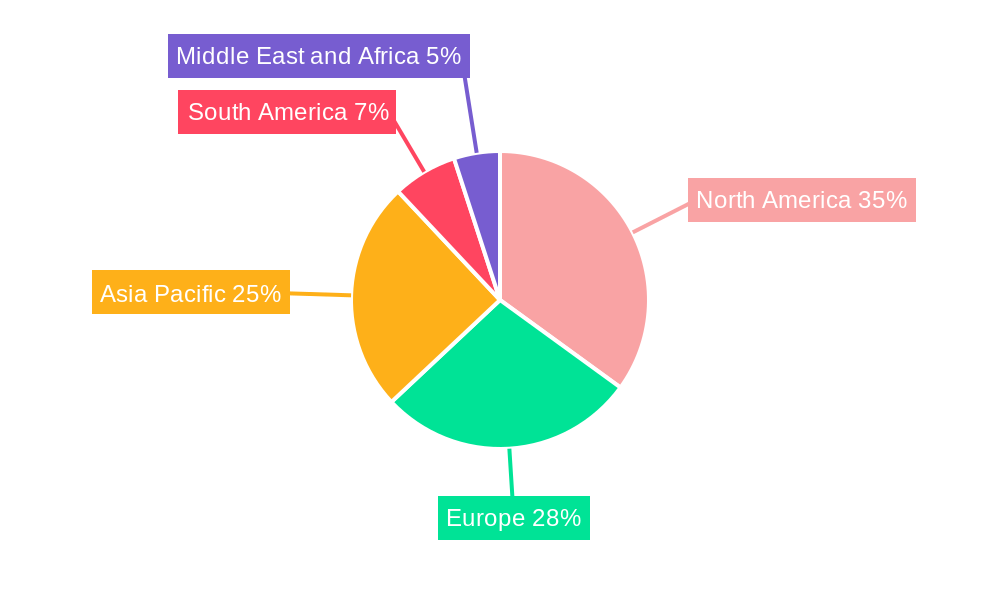
Nuclear Power Reactor Decommissioning Market Regional Market Share
Geographic Coverage of Nuclear Power Reactor Decommissioning Market
Nuclear Power Reactor Decommissioning Market REPORT HIGHLIGHTS
| Aspects | Details |
|---|---|
| Study Period | 2020-2034 |
| Base Year | 2025 |
| Estimated Year | 2026 |
| Forecast Period | 2026-2034 |
| Historical Period | 2020-2025 |
| Growth Rate | CAGR of 4% from 2020-2034 |
| Segmentation |
|
Table of Contents
- 1. Introduction
- 1.1. Research Scope
- 1.2. Market Segmentation
- 1.3. Research Objective
- 1.4. Definitions and Assumptions
- 2. Executive Summary
- 2.1. Market Snapshot
- 3. Market Dynamics
- 3.1. Market Drivers
- 3.2. Market Restrains
- 3.3. Market Trends
- 3.4. Market Opportunities
- 4. Market Factor Analysis
- 4.1. Porters Five Forces
- 4.1.1. Bargaining Power of Suppliers
- 4.1.2. Bargaining Power of Buyers
- 4.1.3. Threat of New Entrants
- 4.1.4. Threat of Substitutes
- 4.1.5. Competitive Rivalry
- 4.2. PESTEL analysis
- 4.3. BCG Analysis
- 4.3.1. Stars (High Growth, High Market Share)
- 4.3.2. Cash Cows (Low Growth, High Market Share)
- 4.3.3. Question Mark (High Growth, Low Market Share)
- 4.3.4. Dogs (Low Growth, Low Market Share)
- 4.4. Ansoff Matrix Analysis
- 4.5. Supply Chain Analysis
- 4.6. Regulatory Landscape
- 4.7. Current Market Potential and Opportunity Assessment (TAM–SAM–SOM Framework)
- 4.8. TIR Analyst Note
- 4.1. Porters Five Forces
- 5. Market Analysis, Insights and Forecast 2021-2033
- 5.1. Market Analysis, Insights and Forecast - by Reactor Type
- 5.1.1. Pressurized Water Reactor
- 5.1.2. Pressurized Heavy Water Reactor
- 5.1.3. Boiling Water Reactor
- 5.1.4. High-temperature Gas-cooled Reactor
- 5.1.5. Liquid Metal Fast Breeder Reactor
- 5.1.6. Other Reactor Types
- 5.2. Market Analysis, Insights and Forecast - by Application
- 5.2.1. Commercial Power Reactor
- 5.2.2. Prototype Power Reactor
- 5.2.3. Research Reactor
- 5.3. Market Analysis, Insights and Forecast - by Capacity
- 5.3.1. Below 100 MW
- 5.3.2. 100-1000 MW
- 5.3.3. Above 1000 MW
- 5.4. Market Analysis, Insights and Forecast - by Region
- 5.4.1. North America
- 5.4.2. Asia Pacific
- 5.4.3. Europe
- 5.4.4. South America
- 5.4.5. Middle East and Africa
- 5.1. Market Analysis, Insights and Forecast - by Reactor Type
- 6. Global Nuclear Power Reactor Decommissioning Market Analysis, Insights and Forecast, 2021-2033
- 6.1. Market Analysis, Insights and Forecast - by Reactor Type
- 6.1.1. Pressurized Water Reactor
- 6.1.2. Pressurized Heavy Water Reactor
- 6.1.3. Boiling Water Reactor
- 6.1.4. High-temperature Gas-cooled Reactor
- 6.1.5. Liquid Metal Fast Breeder Reactor
- 6.1.6. Other Reactor Types
- 6.2. Market Analysis, Insights and Forecast - by Application
- 6.2.1. Commercial Power Reactor
- 6.2.2. Prototype Power Reactor
- 6.2.3. Research Reactor
- 6.3. Market Analysis, Insights and Forecast - by Capacity
- 6.3.1. Below 100 MW
- 6.3.2. 100-1000 MW
- 6.3.3. Above 1000 MW
- 6.1. Market Analysis, Insights and Forecast - by Reactor Type
- 7. North America Nuclear Power Reactor Decommissioning Market Analysis, Insights and Forecast, 2020-2032
- 7.1. Market Analysis, Insights and Forecast - by Reactor Type
- 7.1.1. Pressurized Water Reactor
- 7.1.2. Pressurized Heavy Water Reactor
- 7.1.3. Boiling Water Reactor
- 7.1.4. High-temperature Gas-cooled Reactor
- 7.1.5. Liquid Metal Fast Breeder Reactor
- 7.1.6. Other Reactor Types
- 7.2. Market Analysis, Insights and Forecast - by Application
- 7.2.1. Commercial Power Reactor
- 7.2.2. Prototype Power Reactor
- 7.2.3. Research Reactor
- 7.3. Market Analysis, Insights and Forecast - by Capacity
- 7.3.1. Below 100 MW
- 7.3.2. 100-1000 MW
- 7.3.3. Above 1000 MW
- 7.1. Market Analysis, Insights and Forecast - by Reactor Type
- 8. Asia Pacific Nuclear Power Reactor Decommissioning Market Analysis, Insights and Forecast, 2020-2032
- 8.1. Market Analysis, Insights and Forecast - by Reactor Type
- 8.1.1. Pressurized Water Reactor
- 8.1.2. Pressurized Heavy Water Reactor
- 8.1.3. Boiling Water Reactor
- 8.1.4. High-temperature Gas-cooled Reactor
- 8.1.5. Liquid Metal Fast Breeder Reactor
- 8.1.6. Other Reactor Types
- 8.2. Market Analysis, Insights and Forecast - by Application
- 8.2.1. Commercial Power Reactor
- 8.2.2. Prototype Power Reactor
- 8.2.3. Research Reactor
- 8.3. Market Analysis, Insights and Forecast - by Capacity
- 8.3.1. Below 100 MW
- 8.3.2. 100-1000 MW
- 8.3.3. Above 1000 MW
- 8.1. Market Analysis, Insights and Forecast - by Reactor Type
- 9. Europe Nuclear Power Reactor Decommissioning Market Analysis, Insights and Forecast, 2020-2032
- 9.1. Market Analysis, Insights and Forecast - by Reactor Type
- 9.1.1. Pressurized Water Reactor
- 9.1.2. Pressurized Heavy Water Reactor
- 9.1.3. Boiling Water Reactor
- 9.1.4. High-temperature Gas-cooled Reactor
- 9.1.5. Liquid Metal Fast Breeder Reactor
- 9.1.6. Other Reactor Types
- 9.2. Market Analysis, Insights and Forecast - by Application
- 9.2.1. Commercial Power Reactor
- 9.2.2. Prototype Power Reactor
- 9.2.3. Research Reactor
- 9.3. Market Analysis, Insights and Forecast - by Capacity
- 9.3.1. Below 100 MW
- 9.3.2. 100-1000 MW
- 9.3.3. Above 1000 MW
- 9.1. Market Analysis, Insights and Forecast - by Reactor Type
- 10. South America Nuclear Power Reactor Decommissioning Market Analysis, Insights and Forecast, 2020-2032
- 10.1. Market Analysis, Insights and Forecast - by Reactor Type
- 10.1.1. Pressurized Water Reactor
- 10.1.2. Pressurized Heavy Water Reactor
- 10.1.3. Boiling Water Reactor
- 10.1.4. High-temperature Gas-cooled Reactor
- 10.1.5. Liquid Metal Fast Breeder Reactor
- 10.1.6. Other Reactor Types
- 10.2. Market Analysis, Insights and Forecast - by Application
- 10.2.1. Commercial Power Reactor
- 10.2.2. Prototype Power Reactor
- 10.2.3. Research Reactor
- 10.3. Market Analysis, Insights and Forecast - by Capacity
- 10.3.1. Below 100 MW
- 10.3.2. 100-1000 MW
- 10.3.3. Above 1000 MW
- 10.1. Market Analysis, Insights and Forecast - by Reactor Type
- 11. Middle East and Africa Nuclear Power Reactor Decommissioning Market Analysis, Insights and Forecast, 2020-2032
- 11.1. Market Analysis, Insights and Forecast - by Reactor Type
- 11.1.1. Pressurized Water Reactor
- 11.1.2. Pressurized Heavy Water Reactor
- 11.1.3. Boiling Water Reactor
- 11.1.4. High-temperature Gas-cooled Reactor
- 11.1.5. Liquid Metal Fast Breeder Reactor
- 11.1.6. Other Reactor Types
- 11.2. Market Analysis, Insights and Forecast - by Application
- 11.2.1. Commercial Power Reactor
- 11.2.2. Prototype Power Reactor
- 11.2.3. Research Reactor
- 11.3. Market Analysis, Insights and Forecast - by Capacity
- 11.3.1. Below 100 MW
- 11.3.2. 100-1000 MW
- 11.3.3. Above 1000 MW
- 11.1. Market Analysis, Insights and Forecast - by Reactor Type
- 12. Competitive Analysis
- 12.1. Company Profiles
- 12.1.1 Aecom
- 12.1.1.1. Company Overview
- 12.1.1.2. Products
- 12.1.1.3. Company Financials
- 12.1.1.4. SWOT Analysis
- 12.1.2 Orano Group
- 12.1.2.1. Company Overview
- 12.1.2.2. Products
- 12.1.2.3. Company Financials
- 12.1.2.4. SWOT Analysis
- 12.1.3 Westinghouse Electric Company*List Not Exhaustive
- 12.1.3.1. Company Overview
- 12.1.3.2. Products
- 12.1.3.3. Company Financials
- 12.1.3.4. SWOT Analysis
- 12.1.4 Enercon Services Inc
- 12.1.4.1. Company Overview
- 12.1.4.2. Products
- 12.1.4.3. Company Financials
- 12.1.4.4. SWOT Analysis
- 12.1.5 NorthStar Group Services Inc
- 12.1.5.1. Company Overview
- 12.1.5.2. Products
- 12.1.5.3. Company Financials
- 12.1.5.4. SWOT Analysis
- 12.1.6 GE Hitachi Nuclear Services
- 12.1.6.1. Company Overview
- 12.1.6.2. Products
- 12.1.6.3. Company Financials
- 12.1.6.4. SWOT Analysis
- 12.1.7 James Fisher & Sons PLC
- 12.1.7.1. Company Overview
- 12.1.7.2. Products
- 12.1.7.3. Company Financials
- 12.1.7.4. SWOT Analysis
- 12.1.8 Bechtel Group Inc
- 12.1.8.1. Company Overview
- 12.1.8.2. Products
- 12.1.8.3. Company Financials
- 12.1.8.4. SWOT Analysis
- 12.1.9 Fluor Corporation
- 12.1.9.1. Company Overview
- 12.1.9.2. Products
- 12.1.9.3. Company Financials
- 12.1.9.4. SWOT Analysis
- 12.1.10 Babcock International Group PLC
- 12.1.10.1. Company Overview
- 12.1.10.2. Products
- 12.1.10.3. Company Financials
- 12.1.10.4. SWOT Analysis
- 12.1.11 Studsvik AB
- 12.1.11.1. Company Overview
- 12.1.11.2. Products
- 12.1.11.3. Company Financials
- 12.1.11.4. SWOT Analysis
- 12.1.1 Aecom
- 12.2. Market Entropy
- 12.2.1 Company's Key Areas Served
- 12.2.2 Recent Developments
- 12.3. Company Market Share Analysis 2025
- 12.3.1 Top 5 Companies Market Share Analysis
- 12.3.2 Top 3 Companies Market Share Analysis
- 12.4. List of Potential Customers
- 13. Research Methodology
List of Figures
- Figure 1: Global Nuclear Power Reactor Decommissioning Market Revenue Breakdown (million, %) by Region 2025 & 2033
- Figure 2: North America Nuclear Power Reactor Decommissioning Market Revenue (million), by Reactor Type 2025 & 2033
- Figure 3: North America Nuclear Power Reactor Decommissioning Market Revenue Share (%), by Reactor Type 2025 & 2033
- Figure 4: North America Nuclear Power Reactor Decommissioning Market Revenue (million), by Application 2025 & 2033
- Figure 5: North America Nuclear Power Reactor Decommissioning Market Revenue Share (%), by Application 2025 & 2033
- Figure 6: North America Nuclear Power Reactor Decommissioning Market Revenue (million), by Capacity 2025 & 2033
- Figure 7: North America Nuclear Power Reactor Decommissioning Market Revenue Share (%), by Capacity 2025 & 2033
- Figure 8: North America Nuclear Power Reactor Decommissioning Market Revenue (million), by Country 2025 & 2033
- Figure 9: North America Nuclear Power Reactor Decommissioning Market Revenue Share (%), by Country 2025 & 2033
- Figure 10: Asia Pacific Nuclear Power Reactor Decommissioning Market Revenue (million), by Reactor Type 2025 & 2033
- Figure 11: Asia Pacific Nuclear Power Reactor Decommissioning Market Revenue Share (%), by Reactor Type 2025 & 2033
- Figure 12: Asia Pacific Nuclear Power Reactor Decommissioning Market Revenue (million), by Application 2025 & 2033
- Figure 13: Asia Pacific Nuclear Power Reactor Decommissioning Market Revenue Share (%), by Application 2025 & 2033
- Figure 14: Asia Pacific Nuclear Power Reactor Decommissioning Market Revenue (million), by Capacity 2025 & 2033
- Figure 15: Asia Pacific Nuclear Power Reactor Decommissioning Market Revenue Share (%), by Capacity 2025 & 2033
- Figure 16: Asia Pacific Nuclear Power Reactor Decommissioning Market Revenue (million), by Country 2025 & 2033
- Figure 17: Asia Pacific Nuclear Power Reactor Decommissioning Market Revenue Share (%), by Country 2025 & 2033
- Figure 18: Europe Nuclear Power Reactor Decommissioning Market Revenue (million), by Reactor Type 2025 & 2033
- Figure 19: Europe Nuclear Power Reactor Decommissioning Market Revenue Share (%), by Reactor Type 2025 & 2033
- Figure 20: Europe Nuclear Power Reactor Decommissioning Market Revenue (million), by Application 2025 & 2033
- Figure 21: Europe Nuclear Power Reactor Decommissioning Market Revenue Share (%), by Application 2025 & 2033
- Figure 22: Europe Nuclear Power Reactor Decommissioning Market Revenue (million), by Capacity 2025 & 2033
- Figure 23: Europe Nuclear Power Reactor Decommissioning Market Revenue Share (%), by Capacity 2025 & 2033
- Figure 24: Europe Nuclear Power Reactor Decommissioning Market Revenue (million), by Country 2025 & 2033
- Figure 25: Europe Nuclear Power Reactor Decommissioning Market Revenue Share (%), by Country 2025 & 2033
- Figure 26: South America Nuclear Power Reactor Decommissioning Market Revenue (million), by Reactor Type 2025 & 2033
- Figure 27: South America Nuclear Power Reactor Decommissioning Market Revenue Share (%), by Reactor Type 2025 & 2033
- Figure 28: South America Nuclear Power Reactor Decommissioning Market Revenue (million), by Application 2025 & 2033
- Figure 29: South America Nuclear Power Reactor Decommissioning Market Revenue Share (%), by Application 2025 & 2033
- Figure 30: South America Nuclear Power Reactor Decommissioning Market Revenue (million), by Capacity 2025 & 2033
- Figure 31: South America Nuclear Power Reactor Decommissioning Market Revenue Share (%), by Capacity 2025 & 2033
- Figure 32: South America Nuclear Power Reactor Decommissioning Market Revenue (million), by Country 2025 & 2033
- Figure 33: South America Nuclear Power Reactor Decommissioning Market Revenue Share (%), by Country 2025 & 2033
- Figure 34: Middle East and Africa Nuclear Power Reactor Decommissioning Market Revenue (million), by Reactor Type 2025 & 2033
- Figure 35: Middle East and Africa Nuclear Power Reactor Decommissioning Market Revenue Share (%), by Reactor Type 2025 & 2033
- Figure 36: Middle East and Africa Nuclear Power Reactor Decommissioning Market Revenue (million), by Application 2025 & 2033
- Figure 37: Middle East and Africa Nuclear Power Reactor Decommissioning Market Revenue Share (%), by Application 2025 & 2033
- Figure 38: Middle East and Africa Nuclear Power Reactor Decommissioning Market Revenue (million), by Capacity 2025 & 2033
- Figure 39: Middle East and Africa Nuclear Power Reactor Decommissioning Market Revenue Share (%), by Capacity 2025 & 2033
- Figure 40: Middle East and Africa Nuclear Power Reactor Decommissioning Market Revenue (million), by Country 2025 & 2033
- Figure 41: Middle East and Africa Nuclear Power Reactor Decommissioning Market Revenue Share (%), by Country 2025 & 2033
List of Tables
- Table 1: Global Nuclear Power Reactor Decommissioning Market Revenue million Forecast, by Reactor Type 2020 & 2033
- Table 2: Global Nuclear Power Reactor Decommissioning Market Revenue million Forecast, by Application 2020 & 2033
- Table 3: Global Nuclear Power Reactor Decommissioning Market Revenue million Forecast, by Capacity 2020 & 2033
- Table 4: Global Nuclear Power Reactor Decommissioning Market Revenue million Forecast, by Region 2020 & 2033
- Table 5: Global Nuclear Power Reactor Decommissioning Market Revenue million Forecast, by Reactor Type 2020 & 2033
- Table 6: Global Nuclear Power Reactor Decommissioning Market Revenue million Forecast, by Application 2020 & 2033
- Table 7: Global Nuclear Power Reactor Decommissioning Market Revenue million Forecast, by Capacity 2020 & 2033
- Table 8: Global Nuclear Power Reactor Decommissioning Market Revenue million Forecast, by Country 2020 & 2033
- Table 9: Global Nuclear Power Reactor Decommissioning Market Revenue million Forecast, by Reactor Type 2020 & 2033
- Table 10: Global Nuclear Power Reactor Decommissioning Market Revenue million Forecast, by Application 2020 & 2033
- Table 11: Global Nuclear Power Reactor Decommissioning Market Revenue million Forecast, by Capacity 2020 & 2033
- Table 12: Global Nuclear Power Reactor Decommissioning Market Revenue million Forecast, by Country 2020 & 2033
- Table 13: Global Nuclear Power Reactor Decommissioning Market Revenue million Forecast, by Reactor Type 2020 & 2033
- Table 14: Global Nuclear Power Reactor Decommissioning Market Revenue million Forecast, by Application 2020 & 2033
- Table 15: Global Nuclear Power Reactor Decommissioning Market Revenue million Forecast, by Capacity 2020 & 2033
- Table 16: Global Nuclear Power Reactor Decommissioning Market Revenue million Forecast, by Country 2020 & 2033
- Table 17: Global Nuclear Power Reactor Decommissioning Market Revenue million Forecast, by Reactor Type 2020 & 2033
- Table 18: Global Nuclear Power Reactor Decommissioning Market Revenue million Forecast, by Application 2020 & 2033
- Table 19: Global Nuclear Power Reactor Decommissioning Market Revenue million Forecast, by Capacity 2020 & 2033
- Table 20: Global Nuclear Power Reactor Decommissioning Market Revenue million Forecast, by Country 2020 & 2033
- Table 21: Global Nuclear Power Reactor Decommissioning Market Revenue million Forecast, by Reactor Type 2020 & 2033
- Table 22: Global Nuclear Power Reactor Decommissioning Market Revenue million Forecast, by Application 2020 & 2033
- Table 23: Global Nuclear Power Reactor Decommissioning Market Revenue million Forecast, by Capacity 2020 & 2033
- Table 24: Global Nuclear Power Reactor Decommissioning Market Revenue million Forecast, by Country 2020 & 2033
Frequently Asked Questions
1. What is the projected Compound Annual Growth Rate (CAGR) of the Nuclear Power Reactor Decommissioning Market?
The projected CAGR is approximately 4%.
2. Which companies are prominent players in the Nuclear Power Reactor Decommissioning Market?
Key companies in the market include Aecom, Orano Group, Westinghouse Electric Company*List Not Exhaustive, Enercon Services Inc, NorthStar Group Services Inc, GE Hitachi Nuclear Services, James Fisher & Sons PLC, Bechtel Group Inc, Fluor Corporation, Babcock International Group PLC, Studsvik AB.
3. What are the main segments of the Nuclear Power Reactor Decommissioning Market?
The market segments include Reactor Type, Application, Capacity.
4. Can you provide details about the market size?
The market size is estimated to be USD 8170.1 million as of 2022.
5. What are some drivers contributing to market growth?
4.; Presence of Strict Government Regulations to Control Air Pollution.
6. What are the notable trends driving market growth?
Commercial Reactors Segment is Expected to Dominate the Market.
7. Are there any restraints impacting market growth?
4.; Increasing Adoption of Renewable Energy.
8. Can you provide examples of recent developments in the market?
N/A
9. What pricing options are available for accessing the report?
Pricing options include single-user, multi-user, and enterprise licenses priced at USD 4750, USD 5250, and USD 8750 respectively.
10. Is the market size provided in terms of value or volume?
The market size is provided in terms of value, measured in million.
11. Are there any specific market keywords associated with the report?
Yes, the market keyword associated with the report is "Nuclear Power Reactor Decommissioning Market," which aids in identifying and referencing the specific market segment covered.
12. How do I determine which pricing option suits my needs best?
The pricing options vary based on user requirements and access needs. Individual users may opt for single-user licenses, while businesses requiring broader access may choose multi-user or enterprise licenses for cost-effective access to the report.
13. Are there any additional resources or data provided in the Nuclear Power Reactor Decommissioning Market report?
While the report offers comprehensive insights, it's advisable to review the specific contents or supplementary materials provided to ascertain if additional resources or data are available.
14. How can I stay updated on further developments or reports in the Nuclear Power Reactor Decommissioning Market?
To stay informed about further developments, trends, and reports in the Nuclear Power Reactor Decommissioning Market, consider subscribing to industry newsletters, following relevant companies and organizations, or regularly checking reputable industry news sources and publications.
Methodology
Step 1 - Identification of Relevant Samples Size from Population Database


Step 2 - Approaches for Defining Global Market Size (Value, Volume* & Price*)

Note*: In applicable scenarios
Step 3 - Data Sources
Primary Research
- Web Analytics
- Survey Reports
- Research Institute
- Latest Research Reports
- Opinion Leaders
Secondary Research
- Annual Reports
- White Paper
- Latest Press Release
- Industry Association
- Paid Database
- Investor Presentations

Step 4 - Data Triangulation
Involves using different sources of information in order to increase the validity of a study
These sources are likely to be stakeholders in a program - participants, other researchers, program staff, other community members, and so on.
Then we put all data in single framework & apply various statistical tools to find out the dynamic on the market.
During the analysis stage, feedback from the stakeholder groups would be compared to determine areas of agreement as well as areas of divergence