

Key Insights
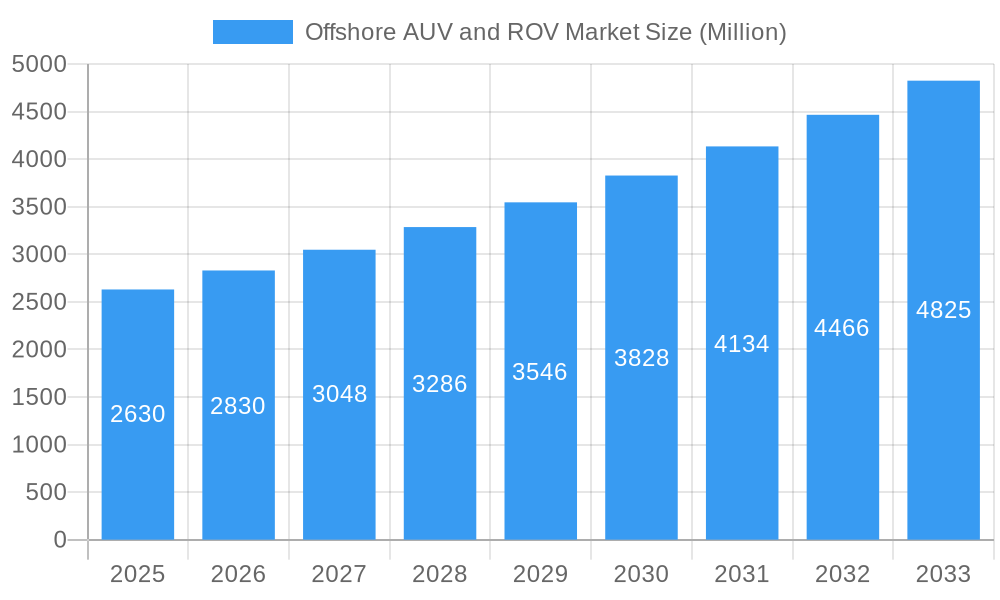
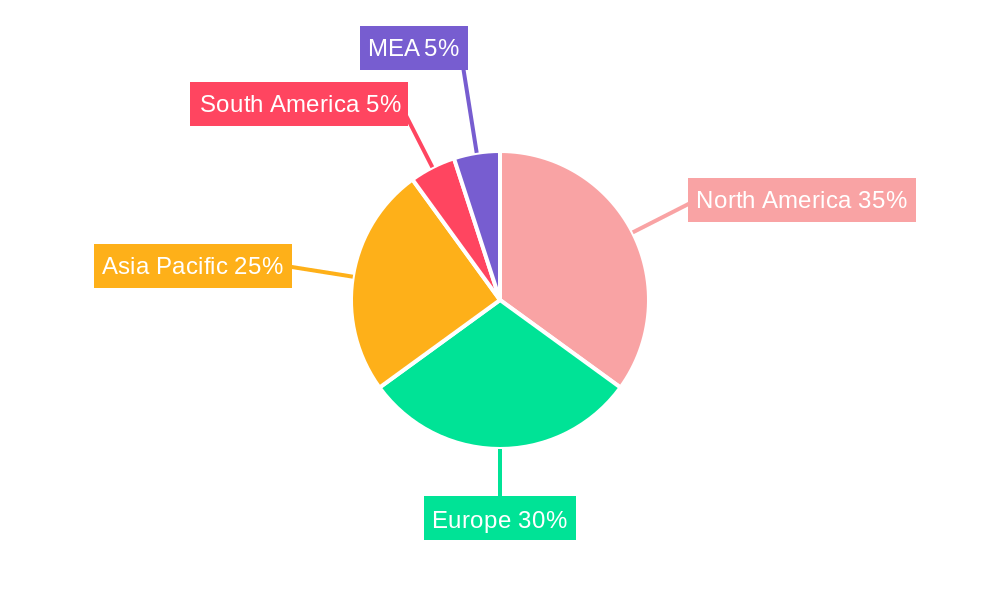
The offshore Autonomous Underwater Vehicle (AUV) and Remotely Operated Vehicle (ROV) market is experiencing robust growth, projected to reach \$2.63 billion in 2025 and maintain a Compound Annual Growth Rate (CAGR) of 7.69% from 2025 to 2033. This expansion is fueled by several key factors. The increasing demand for subsea operations in the oil and gas industry, driven by the exploration of deeper waters and the need for efficient infrastructure maintenance, is a primary driver. Furthermore, the growing adoption of AUVs and ROVs in defense and research applications, particularly for underwater surveillance and scientific exploration, significantly contributes to market growth. Technological advancements, including improved sensor capabilities, enhanced navigation systems, and the development of more robust and versatile vehicles, are also key catalysts. The market is segmented by vehicle type (AUV and ROV), vehicle class (work-class, heavy work-class, observatory-class), end-user application (oil and gas, defense, research, others), and activity (drilling, construction, inspection, repair, maintenance, decommissioning, others). North America and Europe currently hold significant market shares, but the Asia-Pacific region is expected to witness substantial growth driven by increasing offshore energy exploration and infrastructure development.
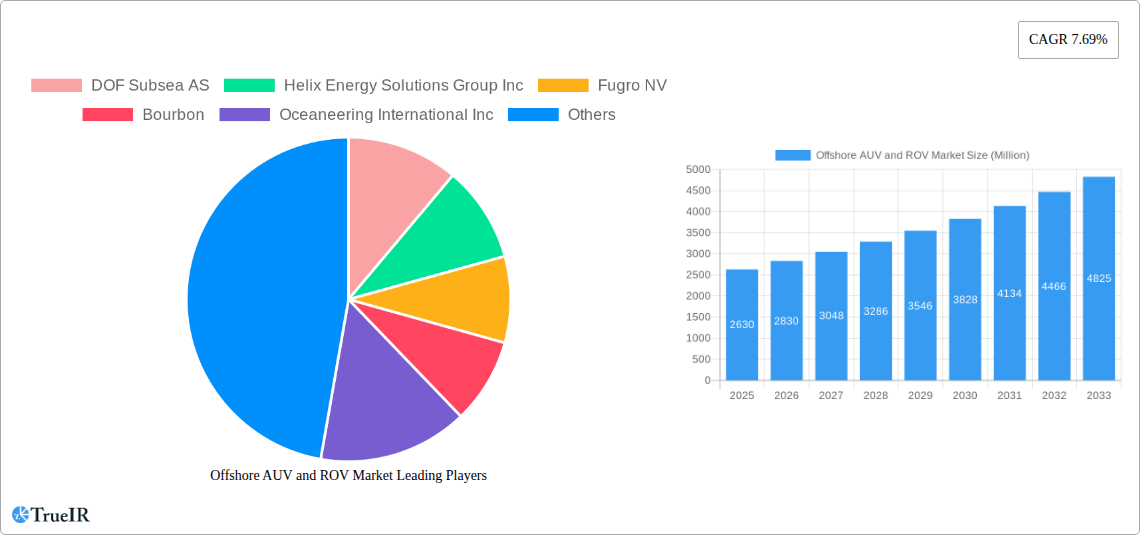
Offshore AUV and ROV Market Market Size (In Billion)
The market's growth trajectory, however, is not without challenges. High initial investment costs associated with acquiring and maintaining these sophisticated underwater vehicles can pose a significant barrier to entry for smaller players. Furthermore, the regulatory environment surrounding subsea operations and the need for skilled personnel to operate and maintain these systems present potential restraints. Nevertheless, the ongoing technological advancements and the increasing demand for efficient and cost-effective solutions for subsea operations are expected to overcome these challenges and ensure continued market expansion throughout the forecast period. The leading companies in this market, including DOF Subsea AS, Helix Energy Solutions Group Inc., Fugro NV, and Oceaneering International Inc., are actively investing in research and development to maintain their competitive edge and cater to the evolving demands of the industry.
Offshore AUV and ROV Market Company Market Share
Dive Deep into the Dynamic Offshore AUV and ROV Market: A Comprehensive Market Report (2019-2033)
This comprehensive report provides an in-depth analysis of the global Offshore AUV and ROV market, offering invaluable insights for stakeholders across the industry. From market size and segmentation to competitive dynamics and future projections, this report unveils the key trends shaping this rapidly evolving sector. With a detailed study period spanning 2019-2033, a base year of 2025, and a forecast period of 2025-2033, this report is your essential guide to navigating the complexities of the Offshore AUV and ROV landscape. The market is expected to reach xx Million by 2033, showcasing significant growth potential.
Offshore AUV and ROV Market Market Structure & Competitive Landscape
The Offshore AUV and ROV market exhibits a moderately concentrated structure, with several major players holding significant market share. However, the market is also characterized by a dynamic competitive landscape with ongoing innovation and mergers & acquisitions (M&A) activity. Key players include DOF Subsea AS, Helix Energy Solutions Group Inc, Fugro NV, Bourbon, Oceaneering International Inc, Saipem SpA, DeepOcean AS, Subsea 7 SA, Teledyne Technologies Incorporated, and TechnipFMC PLC. The list is not exhaustive. The market concentration ratio (CR4) for 2024 is estimated at xx%, reflecting a blend of established players and emerging entrants.
- Innovation Drivers: Technological advancements in AUV and ROV capabilities, such as improved sensor technology, autonomous navigation systems, and enhanced manipulation tools, are driving market growth.
- Regulatory Impacts: Stringent safety regulations and environmental protection standards influence operational practices and technology adoption. This is driving the development of more sophisticated, environmentally friendly AUV and ROV systems.
- Product Substitutes: While limited, alternative technologies for subsea inspection and intervention may indirectly influence market dynamics.
- End-User Segmentation: The market is diverse, serving the Oil and Gas, Defense, Research, and Other End-user Applications sectors, each with unique operational needs.
- M&A Trends: The past five years have witnessed xx M&A deals in the sector, indicating consolidation and strategic expansion by leading players. This trend is anticipated to continue, shaping the market structure.
Offshore AUV and ROV Market Market Trends & Opportunities
The global Offshore AUV and ROV market is experiencing robust growth, driven by several factors. The market size is projected to reach xx Million by 2025 and expand at a Compound Annual Growth Rate (CAGR) of xx% during the forecast period (2025-2033). This expansion is fueled by increasing offshore exploration and production activities, particularly in deepwater environments. The demand for subsea inspection, repair, and maintenance (IRM) services is also a primary driver, alongside growing interest in autonomous operations and data-driven solutions. Technological advancements, particularly in AI-powered autonomous systems, are transforming operational efficiency and safety standards. Emerging applications in the defense and research sectors contribute to expanding market opportunities. Furthermore, the market penetration rate for advanced AUV and ROV systems is steadily increasing, particularly in regions with significant offshore energy infrastructure. Competitive dynamics are marked by technological innovation, strategic partnerships, and M&A activity. The oil and gas industry's continued reliance on offshore activities presents sustained opportunities, while emerging markets and research applications represent long-term growth drivers.
Dominant Markets & Segments in Offshore AUV and ROV Market
The Offshore AUV and ROV market is geographically diverse, with significant presence across various regions. However, certain segments exhibit stronger growth trajectories.
- Leading Region/Country: The North Sea and the Gulf of Mexico remain dominant regions, owing to robust oil and gas exploration and production activity and established offshore infrastructure. Asia-Pacific is also experiencing substantial growth, fueled by increased investment in offshore renewable energy projects.
- Vehicle Type: ROVs currently dominate the market, owing to their versatility and established applications across various subsea activities. However, AUVs are gaining traction due to their cost-effectiveness for certain tasks and autonomous capabilities.
- Vehicle Class: Work-class ROVs constitute a substantial portion of the market due to their widespread adoption for IRM tasks. Heavy work-class ROVs cater to complex and high-intensity subsea operations. The observatory-class vehicle segment is experiencing slower growth but holds long-term potential for specialized research applications.
- End-user Application: The Oil and Gas sector remains the primary end-user, followed by the Defense and Research sectors. Growth in offshore wind power and other renewable energy developments is expanding the market.
- Activity: Inspection, Repair, and Maintenance (IRM) represents a dominant application segment, driven by the need to maintain and prolong the lifespan of existing offshore infrastructure. Drilling and development activities, and decommissioning also contribute significantly to the market's growth.
Key Growth Drivers:
- Increasing demand for subsea inspection, repair, and maintenance (IRM) services.
- Growing investments in offshore oil & gas exploration and production.
- Rise in adoption of autonomous underwater vehicles (AUVs) in several applications.
- Increasing government funding towards the research and development of innovative underwater technologies.
- Development of underwater infrastructure for the deployment of renewable energy resources and other strategic industries.
Offshore AUV and ROV Market Product Analysis
Technological advancements in AUV and ROV design, including improved sensors, autonomous navigation systems, and enhanced manipulation tools are driving product innovation. These advancements are leading to more efficient, reliable, and cost-effective subsea operations. The market is witnessing a shift towards autonomous systems, enhancing safety and efficiency while reducing operational costs. Companies are focusing on developing specialized vehicles tailored to particular applications, optimizing their capabilities for specific tasks.
Key Drivers, Barriers & Challenges in Offshore AUV and ROV Market
Key Drivers:
Technological advancements in autonomous navigation, sensor technology, and manipulation systems are propelling market growth. Increasing demand for subsea inspection, repair, and maintenance services, coupled with expansion in offshore oil & gas exploration and renewable energy activities, provide a strong impetus for market growth. Government initiatives and research funding in various countries also fuel this growth.
Challenges:
High initial investment costs, stringent safety regulations, and potential supply chain disruptions pose significant challenges. Furthermore, competition from alternative technologies and the need for skilled personnel to operate and maintain these sophisticated systems add layers of complexity. The need to balance the high cost of advanced technology with the need for improved safety and environmental standards represents a substantial market challenge.
Growth Drivers in the Offshore AUV and ROV Market Market
The Offshore AUV and ROV market is fueled by technological advancements, including AI-powered autonomous systems and improved sensor technologies. Increased demand for subsea IRM services in the oil and gas sector, coupled with expanding investments in renewable energy infrastructure, drive substantial growth. Furthermore, government support for research and development, alongside favorable regulatory frameworks, stimulate market expansion.
Challenges Impacting Offshore AUV and ROV Market Growth
High initial capital expenditure, complex regulatory environments, and the need for specialized skilled labor hinder market growth. Supply chain vulnerabilities and potential disruptions also pose challenges. Intense competition and the need for continuous technological innovation add to the complexities of this dynamic sector.
Key Players Shaping the Offshore AUV and ROV Market Market
Significant Offshore AUV and ROV Market Industry Milestones
- Jan 2024: DeepTech secures a three-year contract with BP Plc for ROV services in the West Nile Delta, Egypt, highlighting growing demand for work-class ROVs in drilling and subsea operations.
- Oct 2022: Oceaneering's Subsea Robotics division wins USD 300 Million in contracts for ROV and AUV services, showcasing strong market demand for subsea intervention and construction support.
- May 2022: Gujarat Police's adoption of ROVs for underwater recovery operations demonstrates the technology's expanding applications beyond traditional offshore energy sectors.
Future Outlook for Offshore AUV and ROV Market Market
The Offshore AUV and ROV market is poised for significant growth, driven by sustained demand for subsea services in the energy sector and the increasing adoption of AUVs in various applications. Strategic partnerships and technological innovations will further enhance market expansion. The burgeoning renewable energy sector and rising interest in deep-sea exploration present substantial growth opportunities. The market anticipates a continued increase in adoption of autonomous systems and the development of more sophisticated technologies, driving operational efficiency and market expansion.
Offshore AUV and ROV Market Segmentation
-
1. Vehicle Type
- 1.1. ROV
- 1.2. AUV
-
2. Vehicle Class
-
2.1. Work-class Vehicle
- 2.1.1. Light Work-class Vehicle
- 2.1.2. Medium Work-class Vehicle
- 2.1.3. Heavy Work-class Vehicle
- 2.2. Observatory-class Vehicles
-
2.1. Work-class Vehicle
-
3. End-user Application
- 3.1. Oil and Gas
- 3.2. Defense
- 3.3. Research
- 3.4. Other End-user Applications
-
4. Activity
- 4.1. Drilling and Development
- 4.2. Construction
- 4.3. Inspection, Repair, and Maintenance
- 4.4. Decommissioning
- 4.5. Other Activities
Offshore AUV and ROV Market Segmentation By Geography
-
1. North America
- 1.1. United States
- 1.2. Canada
- 1.3. Mexico
-
2. Europe
- 2.1. Germany
- 2.2. United Kingdom
- 2.3. Denmark
- 2.4. Norway
- 2.5. Russia
- 2.6. France
- 2.7. Rest of Europe
-
3. Asia Pacific
- 3.1. China
- 3.2. India
- 3.3. ASEAN Countries
- 3.4. Rest of Asia Pacific
-
4. South America
- 4.1. Brazil
- 4.2. Venezuela
- 4.3. Argentina
- 4.4. Colombia
- 4.5. Rest of South America
-
5. Middle East and Africa
- 5.1. Saudi Arabia
- 5.2. United Arab Emirates
- 5.3. Qatar
- 5.4. Nigeria
- 5.5. Rest of Middle East and Africa
Offshore AUV and ROV Market Regional Market Share
Geographic Coverage of Offshore AUV and ROV Market
Offshore AUV and ROV Market REPORT HIGHLIGHTS
| Aspects | Details |
|---|---|
| Study Period | 2020-2034 |
| Base Year | 2025 |
| Estimated Year | 2026 |
| Forecast Period | 2026-2034 |
| Historical Period | 2020-2025 |
| Growth Rate | CAGR of 7.69% from 2020-2034 |
| Segmentation |
|
Table of Contents
- 1. Introduction
- 1.1. Research Scope
- 1.2. Market Segmentation
- 1.3. Research Objective
- 1.4. Definitions and Assumptions
- 2. Executive Summary
- 2.1. Market Snapshot
- 3. Market Dynamics
- 3.1. Market Drivers
- 3.2. Market Restrains
- 3.3. Market Trends
- 3.4. Market Opportunities
- 4. Market Factor Analysis
- 4.1. Porters Five Forces
- 4.1.1. Bargaining Power of Suppliers
- 4.1.2. Bargaining Power of Buyers
- 4.1.3. Threat of New Entrants
- 4.1.4. Threat of Substitutes
- 4.1.5. Competitive Rivalry
- 4.2. PESTEL analysis
- 4.3. BCG Analysis
- 4.3.1. Stars (High Growth, High Market Share)
- 4.3.2. Cash Cows (Low Growth, High Market Share)
- 4.3.3. Question Mark (High Growth, Low Market Share)
- 4.3.4. Dogs (Low Growth, Low Market Share)
- 4.4. Ansoff Matrix Analysis
- 4.5. Supply Chain Analysis
- 4.6. Regulatory Landscape
- 4.7. Current Market Potential and Opportunity Assessment (TAM–SAM–SOM Framework)
- 4.8. TIR Analyst Note
- 4.1. Porters Five Forces
- 5. Market Analysis, Insights and Forecast 2021-2033
- 5.1. Market Analysis, Insights and Forecast - by Vehicle Type
- 5.1.1. ROV
- 5.1.2. AUV
- 5.2. Market Analysis, Insights and Forecast - by Vehicle Class
- 5.2.1. Work-class Vehicle
- 5.2.1.1. Light Work-class Vehicle
- 5.2.1.2. Medium Work-class Vehicle
- 5.2.1.3. Heavy Work-class Vehicle
- 5.2.2. Observatory-class Vehicles
- 5.2.1. Work-class Vehicle
- 5.3. Market Analysis, Insights and Forecast - by End-user Application
- 5.3.1. Oil and Gas
- 5.3.2. Defense
- 5.3.3. Research
- 5.3.4. Other End-user Applications
- 5.4. Market Analysis, Insights and Forecast - by Activity
- 5.4.1. Drilling and Development
- 5.4.2. Construction
- 5.4.3. Inspection, Repair, and Maintenance
- 5.4.4. Decommissioning
- 5.4.5. Other Activities
- 5.5. Market Analysis, Insights and Forecast - by Region
- 5.5.1. North America
- 5.5.2. Europe
- 5.5.3. Asia Pacific
- 5.5.4. South America
- 5.5.5. Middle East and Africa
- 5.1. Market Analysis, Insights and Forecast - by Vehicle Type
- 6. Global Offshore AUV and ROV Market Analysis, Insights and Forecast, 2021-2033
- 6.1. Market Analysis, Insights and Forecast - by Vehicle Type
- 6.1.1. ROV
- 6.1.2. AUV
- 6.2. Market Analysis, Insights and Forecast - by Vehicle Class
- 6.2.1. Work-class Vehicle
- 6.2.1.1. Light Work-class Vehicle
- 6.2.1.2. Medium Work-class Vehicle
- 6.2.1.3. Heavy Work-class Vehicle
- 6.2.2. Observatory-class Vehicles
- 6.2.1. Work-class Vehicle
- 6.3. Market Analysis, Insights and Forecast - by End-user Application
- 6.3.1. Oil and Gas
- 6.3.2. Defense
- 6.3.3. Research
- 6.3.4. Other End-user Applications
- 6.4. Market Analysis, Insights and Forecast - by Activity
- 6.4.1. Drilling and Development
- 6.4.2. Construction
- 6.4.3. Inspection, Repair, and Maintenance
- 6.4.4. Decommissioning
- 6.4.5. Other Activities
- 6.1. Market Analysis, Insights and Forecast - by Vehicle Type
- 7. North America Offshore AUV and ROV Market Analysis, Insights and Forecast, 2020-2032
- 7.1. Market Analysis, Insights and Forecast - by Vehicle Type
- 7.1.1. ROV
- 7.1.2. AUV
- 7.2. Market Analysis, Insights and Forecast - by Vehicle Class
- 7.2.1. Work-class Vehicle
- 7.2.1.1. Light Work-class Vehicle
- 7.2.1.2. Medium Work-class Vehicle
- 7.2.1.3. Heavy Work-class Vehicle
- 7.2.2. Observatory-class Vehicles
- 7.2.1. Work-class Vehicle
- 7.3. Market Analysis, Insights and Forecast - by End-user Application
- 7.3.1. Oil and Gas
- 7.3.2. Defense
- 7.3.3. Research
- 7.3.4. Other End-user Applications
- 7.4. Market Analysis, Insights and Forecast - by Activity
- 7.4.1. Drilling and Development
- 7.4.2. Construction
- 7.4.3. Inspection, Repair, and Maintenance
- 7.4.4. Decommissioning
- 7.4.5. Other Activities
- 7.1. Market Analysis, Insights and Forecast - by Vehicle Type
- 8. Europe Offshore AUV and ROV Market Analysis, Insights and Forecast, 2020-2032
- 8.1. Market Analysis, Insights and Forecast - by Vehicle Type
- 8.1.1. ROV
- 8.1.2. AUV
- 8.2. Market Analysis, Insights and Forecast - by Vehicle Class
- 8.2.1. Work-class Vehicle
- 8.2.1.1. Light Work-class Vehicle
- 8.2.1.2. Medium Work-class Vehicle
- 8.2.1.3. Heavy Work-class Vehicle
- 8.2.2. Observatory-class Vehicles
- 8.2.1. Work-class Vehicle
- 8.3. Market Analysis, Insights and Forecast - by End-user Application
- 8.3.1. Oil and Gas
- 8.3.2. Defense
- 8.3.3. Research
- 8.3.4. Other End-user Applications
- 8.4. Market Analysis, Insights and Forecast - by Activity
- 8.4.1. Drilling and Development
- 8.4.2. Construction
- 8.4.3. Inspection, Repair, and Maintenance
- 8.4.4. Decommissioning
- 8.4.5. Other Activities
- 8.1. Market Analysis, Insights and Forecast - by Vehicle Type
- 9. Asia Pacific Offshore AUV and ROV Market Analysis, Insights and Forecast, 2020-2032
- 9.1. Market Analysis, Insights and Forecast - by Vehicle Type
- 9.1.1. ROV
- 9.1.2. AUV
- 9.2. Market Analysis, Insights and Forecast - by Vehicle Class
- 9.2.1. Work-class Vehicle
- 9.2.1.1. Light Work-class Vehicle
- 9.2.1.2. Medium Work-class Vehicle
- 9.2.1.3. Heavy Work-class Vehicle
- 9.2.2. Observatory-class Vehicles
- 9.2.1. Work-class Vehicle
- 9.3. Market Analysis, Insights and Forecast - by End-user Application
- 9.3.1. Oil and Gas
- 9.3.2. Defense
- 9.3.3. Research
- 9.3.4. Other End-user Applications
- 9.4. Market Analysis, Insights and Forecast - by Activity
- 9.4.1. Drilling and Development
- 9.4.2. Construction
- 9.4.3. Inspection, Repair, and Maintenance
- 9.4.4. Decommissioning
- 9.4.5. Other Activities
- 9.1. Market Analysis, Insights and Forecast - by Vehicle Type
- 10. South America Offshore AUV and ROV Market Analysis, Insights and Forecast, 2020-2032
- 10.1. Market Analysis, Insights and Forecast - by Vehicle Type
- 10.1.1. ROV
- 10.1.2. AUV
- 10.2. Market Analysis, Insights and Forecast - by Vehicle Class
- 10.2.1. Work-class Vehicle
- 10.2.1.1. Light Work-class Vehicle
- 10.2.1.2. Medium Work-class Vehicle
- 10.2.1.3. Heavy Work-class Vehicle
- 10.2.2. Observatory-class Vehicles
- 10.2.1. Work-class Vehicle
- 10.3. Market Analysis, Insights and Forecast - by End-user Application
- 10.3.1. Oil and Gas
- 10.3.2. Defense
- 10.3.3. Research
- 10.3.4. Other End-user Applications
- 10.4. Market Analysis, Insights and Forecast - by Activity
- 10.4.1. Drilling and Development
- 10.4.2. Construction
- 10.4.3. Inspection, Repair, and Maintenance
- 10.4.4. Decommissioning
- 10.4.5. Other Activities
- 10.1. Market Analysis, Insights and Forecast - by Vehicle Type
- 11. Middle East and Africa Offshore AUV and ROV Market Analysis, Insights and Forecast, 2020-2032
- 11.1. Market Analysis, Insights and Forecast - by Vehicle Type
- 11.1.1. ROV
- 11.1.2. AUV
- 11.2. Market Analysis, Insights and Forecast - by Vehicle Class
- 11.2.1. Work-class Vehicle
- 11.2.1.1. Light Work-class Vehicle
- 11.2.1.2. Medium Work-class Vehicle
- 11.2.1.3. Heavy Work-class Vehicle
- 11.2.2. Observatory-class Vehicles
- 11.2.1. Work-class Vehicle
- 11.3. Market Analysis, Insights and Forecast - by End-user Application
- 11.3.1. Oil and Gas
- 11.3.2. Defense
- 11.3.3. Research
- 11.3.4. Other End-user Applications
- 11.4. Market Analysis, Insights and Forecast - by Activity
- 11.4.1. Drilling and Development
- 11.4.2. Construction
- 11.4.3. Inspection, Repair, and Maintenance
- 11.4.4. Decommissioning
- 11.4.5. Other Activities
- 11.1. Market Analysis, Insights and Forecast - by Vehicle Type
- 12. Competitive Analysis
- 12.1. Company Profiles
- 12.1.1 DOF Subsea AS
- 12.1.1.1. Company Overview
- 12.1.1.2. Products
- 12.1.1.3. Company Financials
- 12.1.1.4. SWOT Analysis
- 12.1.2 Helix Energy Solutions Group Inc
- 12.1.2.1. Company Overview
- 12.1.2.2. Products
- 12.1.2.3. Company Financials
- 12.1.2.4. SWOT Analysis
- 12.1.3 Fugro NV
- 12.1.3.1. Company Overview
- 12.1.3.2. Products
- 12.1.3.3. Company Financials
- 12.1.3.4. SWOT Analysis
- 12.1.4 Bourbon
- 12.1.4.1. Company Overview
- 12.1.4.2. Products
- 12.1.4.3. Company Financials
- 12.1.4.4. SWOT Analysis
- 12.1.5 Oceaneering International Inc
- 12.1.5.1. Company Overview
- 12.1.5.2. Products
- 12.1.5.3. Company Financials
- 12.1.5.4. SWOT Analysis
- 12.1.6 Saipem SpA
- 12.1.6.1. Company Overview
- 12.1.6.2. Products
- 12.1.6.3. Company Financials
- 12.1.6.4. SWOT Analysis
- 12.1.7 DeepOcean AS
- 12.1.7.1. Company Overview
- 12.1.7.2. Products
- 12.1.7.3. Company Financials
- 12.1.7.4. SWOT Analysis
- 12.1.8 Subsea 7 SA
- 12.1.8.1. Company Overview
- 12.1.8.2. Products
- 12.1.8.3. Company Financials
- 12.1.8.4. SWOT Analysis
- 12.1.9 Teledyne Technologies Incorporated*List Not Exhaustive
- 12.1.9.1. Company Overview
- 12.1.9.2. Products
- 12.1.9.3. Company Financials
- 12.1.9.4. SWOT Analysis
- 12.1.10 TechnipFMC PLC
- 12.1.10.1. Company Overview
- 12.1.10.2. Products
- 12.1.10.3. Company Financials
- 12.1.10.4. SWOT Analysis
- 12.1.1 DOF Subsea AS
- 12.2. Market Entropy
- 12.2.1 Company's Key Areas Served
- 12.2.2 Recent Developments
- 12.3. Company Market Share Analysis 2025
- 12.3.1 Top 5 Companies Market Share Analysis
- 12.3.2 Top 3 Companies Market Share Analysis
- 12.4. List of Potential Customers
- 13. Research Methodology
List of Figures
- Figure 1: Global Offshore AUV and ROV Market Revenue Breakdown (Million, %) by Region 2025 & 2033
- Figure 2: Global Offshore AUV and ROV Market Volume Breakdown (K Unit, %) by Region 2025 & 2033
- Figure 3: North America Offshore AUV and ROV Market Revenue (Million), by Vehicle Type 2025 & 2033
- Figure 4: North America Offshore AUV and ROV Market Volume (K Unit), by Vehicle Type 2025 & 2033
- Figure 5: North America Offshore AUV and ROV Market Revenue Share (%), by Vehicle Type 2025 & 2033
- Figure 6: North America Offshore AUV and ROV Market Volume Share (%), by Vehicle Type 2025 & 2033
- Figure 7: North America Offshore AUV and ROV Market Revenue (Million), by Vehicle Class 2025 & 2033
- Figure 8: North America Offshore AUV and ROV Market Volume (K Unit), by Vehicle Class 2025 & 2033
- Figure 9: North America Offshore AUV and ROV Market Revenue Share (%), by Vehicle Class 2025 & 2033
- Figure 10: North America Offshore AUV and ROV Market Volume Share (%), by Vehicle Class 2025 & 2033
- Figure 11: North America Offshore AUV and ROV Market Revenue (Million), by End-user Application 2025 & 2033
- Figure 12: North America Offshore AUV and ROV Market Volume (K Unit), by End-user Application 2025 & 2033
- Figure 13: North America Offshore AUV and ROV Market Revenue Share (%), by End-user Application 2025 & 2033
- Figure 14: North America Offshore AUV and ROV Market Volume Share (%), by End-user Application 2025 & 2033
- Figure 15: North America Offshore AUV and ROV Market Revenue (Million), by Activity 2025 & 2033
- Figure 16: North America Offshore AUV and ROV Market Volume (K Unit), by Activity 2025 & 2033
- Figure 17: North America Offshore AUV and ROV Market Revenue Share (%), by Activity 2025 & 2033
- Figure 18: North America Offshore AUV and ROV Market Volume Share (%), by Activity 2025 & 2033
- Figure 19: North America Offshore AUV and ROV Market Revenue (Million), by Country 2025 & 2033
- Figure 20: North America Offshore AUV and ROV Market Volume (K Unit), by Country 2025 & 2033
- Figure 21: North America Offshore AUV and ROV Market Revenue Share (%), by Country 2025 & 2033
- Figure 22: North America Offshore AUV and ROV Market Volume Share (%), by Country 2025 & 2033
- Figure 23: Europe Offshore AUV and ROV Market Revenue (Million), by Vehicle Type 2025 & 2033
- Figure 24: Europe Offshore AUV and ROV Market Volume (K Unit), by Vehicle Type 2025 & 2033
- Figure 25: Europe Offshore AUV and ROV Market Revenue Share (%), by Vehicle Type 2025 & 2033
- Figure 26: Europe Offshore AUV and ROV Market Volume Share (%), by Vehicle Type 2025 & 2033
- Figure 27: Europe Offshore AUV and ROV Market Revenue (Million), by Vehicle Class 2025 & 2033
- Figure 28: Europe Offshore AUV and ROV Market Volume (K Unit), by Vehicle Class 2025 & 2033
- Figure 29: Europe Offshore AUV and ROV Market Revenue Share (%), by Vehicle Class 2025 & 2033
- Figure 30: Europe Offshore AUV and ROV Market Volume Share (%), by Vehicle Class 2025 & 2033
- Figure 31: Europe Offshore AUV and ROV Market Revenue (Million), by End-user Application 2025 & 2033
- Figure 32: Europe Offshore AUV and ROV Market Volume (K Unit), by End-user Application 2025 & 2033
- Figure 33: Europe Offshore AUV and ROV Market Revenue Share (%), by End-user Application 2025 & 2033
- Figure 34: Europe Offshore AUV and ROV Market Volume Share (%), by End-user Application 2025 & 2033
- Figure 35: Europe Offshore AUV and ROV Market Revenue (Million), by Activity 2025 & 2033
- Figure 36: Europe Offshore AUV and ROV Market Volume (K Unit), by Activity 2025 & 2033
- Figure 37: Europe Offshore AUV and ROV Market Revenue Share (%), by Activity 2025 & 2033
- Figure 38: Europe Offshore AUV and ROV Market Volume Share (%), by Activity 2025 & 2033
- Figure 39: Europe Offshore AUV and ROV Market Revenue (Million), by Country 2025 & 2033
- Figure 40: Europe Offshore AUV and ROV Market Volume (K Unit), by Country 2025 & 2033
- Figure 41: Europe Offshore AUV and ROV Market Revenue Share (%), by Country 2025 & 2033
- Figure 42: Europe Offshore AUV and ROV Market Volume Share (%), by Country 2025 & 2033
- Figure 43: Asia Pacific Offshore AUV and ROV Market Revenue (Million), by Vehicle Type 2025 & 2033
- Figure 44: Asia Pacific Offshore AUV and ROV Market Volume (K Unit), by Vehicle Type 2025 & 2033
- Figure 45: Asia Pacific Offshore AUV and ROV Market Revenue Share (%), by Vehicle Type 2025 & 2033
- Figure 46: Asia Pacific Offshore AUV and ROV Market Volume Share (%), by Vehicle Type 2025 & 2033
- Figure 47: Asia Pacific Offshore AUV and ROV Market Revenue (Million), by Vehicle Class 2025 & 2033
- Figure 48: Asia Pacific Offshore AUV and ROV Market Volume (K Unit), by Vehicle Class 2025 & 2033
- Figure 49: Asia Pacific Offshore AUV and ROV Market Revenue Share (%), by Vehicle Class 2025 & 2033
- Figure 50: Asia Pacific Offshore AUV and ROV Market Volume Share (%), by Vehicle Class 2025 & 2033
- Figure 51: Asia Pacific Offshore AUV and ROV Market Revenue (Million), by End-user Application 2025 & 2033
- Figure 52: Asia Pacific Offshore AUV and ROV Market Volume (K Unit), by End-user Application 2025 & 2033
- Figure 53: Asia Pacific Offshore AUV and ROV Market Revenue Share (%), by End-user Application 2025 & 2033
- Figure 54: Asia Pacific Offshore AUV and ROV Market Volume Share (%), by End-user Application 2025 & 2033
- Figure 55: Asia Pacific Offshore AUV and ROV Market Revenue (Million), by Activity 2025 & 2033
- Figure 56: Asia Pacific Offshore AUV and ROV Market Volume (K Unit), by Activity 2025 & 2033
- Figure 57: Asia Pacific Offshore AUV and ROV Market Revenue Share (%), by Activity 2025 & 2033
- Figure 58: Asia Pacific Offshore AUV and ROV Market Volume Share (%), by Activity 2025 & 2033
- Figure 59: Asia Pacific Offshore AUV and ROV Market Revenue (Million), by Country 2025 & 2033
- Figure 60: Asia Pacific Offshore AUV and ROV Market Volume (K Unit), by Country 2025 & 2033
- Figure 61: Asia Pacific Offshore AUV and ROV Market Revenue Share (%), by Country 2025 & 2033
- Figure 62: Asia Pacific Offshore AUV and ROV Market Volume Share (%), by Country 2025 & 2033
- Figure 63: South America Offshore AUV and ROV Market Revenue (Million), by Vehicle Type 2025 & 2033
- Figure 64: South America Offshore AUV and ROV Market Volume (K Unit), by Vehicle Type 2025 & 2033
- Figure 65: South America Offshore AUV and ROV Market Revenue Share (%), by Vehicle Type 2025 & 2033
- Figure 66: South America Offshore AUV and ROV Market Volume Share (%), by Vehicle Type 2025 & 2033
- Figure 67: South America Offshore AUV and ROV Market Revenue (Million), by Vehicle Class 2025 & 2033
- Figure 68: South America Offshore AUV and ROV Market Volume (K Unit), by Vehicle Class 2025 & 2033
- Figure 69: South America Offshore AUV and ROV Market Revenue Share (%), by Vehicle Class 2025 & 2033
- Figure 70: South America Offshore AUV and ROV Market Volume Share (%), by Vehicle Class 2025 & 2033
- Figure 71: South America Offshore AUV and ROV Market Revenue (Million), by End-user Application 2025 & 2033
- Figure 72: South America Offshore AUV and ROV Market Volume (K Unit), by End-user Application 2025 & 2033
- Figure 73: South America Offshore AUV and ROV Market Revenue Share (%), by End-user Application 2025 & 2033
- Figure 74: South America Offshore AUV and ROV Market Volume Share (%), by End-user Application 2025 & 2033
- Figure 75: South America Offshore AUV and ROV Market Revenue (Million), by Activity 2025 & 2033
- Figure 76: South America Offshore AUV and ROV Market Volume (K Unit), by Activity 2025 & 2033
- Figure 77: South America Offshore AUV and ROV Market Revenue Share (%), by Activity 2025 & 2033
- Figure 78: South America Offshore AUV and ROV Market Volume Share (%), by Activity 2025 & 2033
- Figure 79: South America Offshore AUV and ROV Market Revenue (Million), by Country 2025 & 2033
- Figure 80: South America Offshore AUV and ROV Market Volume (K Unit), by Country 2025 & 2033
- Figure 81: South America Offshore AUV and ROV Market Revenue Share (%), by Country 2025 & 2033
- Figure 82: South America Offshore AUV and ROV Market Volume Share (%), by Country 2025 & 2033
- Figure 83: Middle East and Africa Offshore AUV and ROV Market Revenue (Million), by Vehicle Type 2025 & 2033
- Figure 84: Middle East and Africa Offshore AUV and ROV Market Volume (K Unit), by Vehicle Type 2025 & 2033
- Figure 85: Middle East and Africa Offshore AUV and ROV Market Revenue Share (%), by Vehicle Type 2025 & 2033
- Figure 86: Middle East and Africa Offshore AUV and ROV Market Volume Share (%), by Vehicle Type 2025 & 2033
- Figure 87: Middle East and Africa Offshore AUV and ROV Market Revenue (Million), by Vehicle Class 2025 & 2033
- Figure 88: Middle East and Africa Offshore AUV and ROV Market Volume (K Unit), by Vehicle Class 2025 & 2033
- Figure 89: Middle East and Africa Offshore AUV and ROV Market Revenue Share (%), by Vehicle Class 2025 & 2033
- Figure 90: Middle East and Africa Offshore AUV and ROV Market Volume Share (%), by Vehicle Class 2025 & 2033
- Figure 91: Middle East and Africa Offshore AUV and ROV Market Revenue (Million), by End-user Application 2025 & 2033
- Figure 92: Middle East and Africa Offshore AUV and ROV Market Volume (K Unit), by End-user Application 2025 & 2033
- Figure 93: Middle East and Africa Offshore AUV and ROV Market Revenue Share (%), by End-user Application 2025 & 2033
- Figure 94: Middle East and Africa Offshore AUV and ROV Market Volume Share (%), by End-user Application 2025 & 2033
- Figure 95: Middle East and Africa Offshore AUV and ROV Market Revenue (Million), by Activity 2025 & 2033
- Figure 96: Middle East and Africa Offshore AUV and ROV Market Volume (K Unit), by Activity 2025 & 2033
- Figure 97: Middle East and Africa Offshore AUV and ROV Market Revenue Share (%), by Activity 2025 & 2033
- Figure 98: Middle East and Africa Offshore AUV and ROV Market Volume Share (%), by Activity 2025 & 2033
- Figure 99: Middle East and Africa Offshore AUV and ROV Market Revenue (Million), by Country 2025 & 2033
- Figure 100: Middle East and Africa Offshore AUV and ROV Market Volume (K Unit), by Country 2025 & 2033
- Figure 101: Middle East and Africa Offshore AUV and ROV Market Revenue Share (%), by Country 2025 & 2033
- Figure 102: Middle East and Africa Offshore AUV and ROV Market Volume Share (%), by Country 2025 & 2033
List of Tables
- Table 1: Global Offshore AUV and ROV Market Revenue Million Forecast, by Vehicle Type 2020 & 2033
- Table 2: Global Offshore AUV and ROV Market Volume K Unit Forecast, by Vehicle Type 2020 & 2033
- Table 3: Global Offshore AUV and ROV Market Revenue Million Forecast, by Vehicle Class 2020 & 2033
- Table 4: Global Offshore AUV and ROV Market Volume K Unit Forecast, by Vehicle Class 2020 & 2033
- Table 5: Global Offshore AUV and ROV Market Revenue Million Forecast, by End-user Application 2020 & 2033
- Table 6: Global Offshore AUV and ROV Market Volume K Unit Forecast, by End-user Application 2020 & 2033
- Table 7: Global Offshore AUV and ROV Market Revenue Million Forecast, by Activity 2020 & 2033
- Table 8: Global Offshore AUV and ROV Market Volume K Unit Forecast, by Activity 2020 & 2033
- Table 9: Global Offshore AUV and ROV Market Revenue Million Forecast, by Region 2020 & 2033
- Table 10: Global Offshore AUV and ROV Market Volume K Unit Forecast, by Region 2020 & 2033
- Table 11: Global Offshore AUV and ROV Market Revenue Million Forecast, by Vehicle Type 2020 & 2033
- Table 12: Global Offshore AUV and ROV Market Volume K Unit Forecast, by Vehicle Type 2020 & 2033
- Table 13: Global Offshore AUV and ROV Market Revenue Million Forecast, by Vehicle Class 2020 & 2033
- Table 14: Global Offshore AUV and ROV Market Volume K Unit Forecast, by Vehicle Class 2020 & 2033
- Table 15: Global Offshore AUV and ROV Market Revenue Million Forecast, by End-user Application 2020 & 2033
- Table 16: Global Offshore AUV and ROV Market Volume K Unit Forecast, by End-user Application 2020 & 2033
- Table 17: Global Offshore AUV and ROV Market Revenue Million Forecast, by Activity 2020 & 2033
- Table 18: Global Offshore AUV and ROV Market Volume K Unit Forecast, by Activity 2020 & 2033
- Table 19: Global Offshore AUV and ROV Market Revenue Million Forecast, by Country 2020 & 2033
- Table 20: Global Offshore AUV and ROV Market Volume K Unit Forecast, by Country 2020 & 2033
- Table 21: United States Offshore AUV and ROV Market Revenue (Million) Forecast, by Application 2020 & 2033
- Table 22: United States Offshore AUV and ROV Market Volume (K Unit) Forecast, by Application 2020 & 2033
- Table 23: Canada Offshore AUV and ROV Market Revenue (Million) Forecast, by Application 2020 & 2033
- Table 24: Canada Offshore AUV and ROV Market Volume (K Unit) Forecast, by Application 2020 & 2033
- Table 25: Mexico Offshore AUV and ROV Market Revenue (Million) Forecast, by Application 2020 & 2033
- Table 26: Mexico Offshore AUV and ROV Market Volume (K Unit) Forecast, by Application 2020 & 2033
- Table 27: Global Offshore AUV and ROV Market Revenue Million Forecast, by Vehicle Type 2020 & 2033
- Table 28: Global Offshore AUV and ROV Market Volume K Unit Forecast, by Vehicle Type 2020 & 2033
- Table 29: Global Offshore AUV and ROV Market Revenue Million Forecast, by Vehicle Class 2020 & 2033
- Table 30: Global Offshore AUV and ROV Market Volume K Unit Forecast, by Vehicle Class 2020 & 2033
- Table 31: Global Offshore AUV and ROV Market Revenue Million Forecast, by End-user Application 2020 & 2033
- Table 32: Global Offshore AUV and ROV Market Volume K Unit Forecast, by End-user Application 2020 & 2033
- Table 33: Global Offshore AUV and ROV Market Revenue Million Forecast, by Activity 2020 & 2033
- Table 34: Global Offshore AUV and ROV Market Volume K Unit Forecast, by Activity 2020 & 2033
- Table 35: Global Offshore AUV and ROV Market Revenue Million Forecast, by Country 2020 & 2033
- Table 36: Global Offshore AUV and ROV Market Volume K Unit Forecast, by Country 2020 & 2033
- Table 37: Germany Offshore AUV and ROV Market Revenue (Million) Forecast, by Application 2020 & 2033
- Table 38: Germany Offshore AUV and ROV Market Volume (K Unit) Forecast, by Application 2020 & 2033
- Table 39: United Kingdom Offshore AUV and ROV Market Revenue (Million) Forecast, by Application 2020 & 2033
- Table 40: United Kingdom Offshore AUV and ROV Market Volume (K Unit) Forecast, by Application 2020 & 2033
- Table 41: Denmark Offshore AUV and ROV Market Revenue (Million) Forecast, by Application 2020 & 2033
- Table 42: Denmark Offshore AUV and ROV Market Volume (K Unit) Forecast, by Application 2020 & 2033
- Table 43: Norway Offshore AUV and ROV Market Revenue (Million) Forecast, by Application 2020 & 2033
- Table 44: Norway Offshore AUV and ROV Market Volume (K Unit) Forecast, by Application 2020 & 2033
- Table 45: Russia Offshore AUV and ROV Market Revenue (Million) Forecast, by Application 2020 & 2033
- Table 46: Russia Offshore AUV and ROV Market Volume (K Unit) Forecast, by Application 2020 & 2033
- Table 47: France Offshore AUV and ROV Market Revenue (Million) Forecast, by Application 2020 & 2033
- Table 48: France Offshore AUV and ROV Market Volume (K Unit) Forecast, by Application 2020 & 2033
- Table 49: Rest of Europe Offshore AUV and ROV Market Revenue (Million) Forecast, by Application 2020 & 2033
- Table 50: Rest of Europe Offshore AUV and ROV Market Volume (K Unit) Forecast, by Application 2020 & 2033
- Table 51: Global Offshore AUV and ROV Market Revenue Million Forecast, by Vehicle Type 2020 & 2033
- Table 52: Global Offshore AUV and ROV Market Volume K Unit Forecast, by Vehicle Type 2020 & 2033
- Table 53: Global Offshore AUV and ROV Market Revenue Million Forecast, by Vehicle Class 2020 & 2033
- Table 54: Global Offshore AUV and ROV Market Volume K Unit Forecast, by Vehicle Class 2020 & 2033
- Table 55: Global Offshore AUV and ROV Market Revenue Million Forecast, by End-user Application 2020 & 2033
- Table 56: Global Offshore AUV and ROV Market Volume K Unit Forecast, by End-user Application 2020 & 2033
- Table 57: Global Offshore AUV and ROV Market Revenue Million Forecast, by Activity 2020 & 2033
- Table 58: Global Offshore AUV and ROV Market Volume K Unit Forecast, by Activity 2020 & 2033
- Table 59: Global Offshore AUV and ROV Market Revenue Million Forecast, by Country 2020 & 2033
- Table 60: Global Offshore AUV and ROV Market Volume K Unit Forecast, by Country 2020 & 2033
- Table 61: China Offshore AUV and ROV Market Revenue (Million) Forecast, by Application 2020 & 2033
- Table 62: China Offshore AUV and ROV Market Volume (K Unit) Forecast, by Application 2020 & 2033
- Table 63: India Offshore AUV and ROV Market Revenue (Million) Forecast, by Application 2020 & 2033
- Table 64: India Offshore AUV and ROV Market Volume (K Unit) Forecast, by Application 2020 & 2033
- Table 65: ASEAN Countries Offshore AUV and ROV Market Revenue (Million) Forecast, by Application 2020 & 2033
- Table 66: ASEAN Countries Offshore AUV and ROV Market Volume (K Unit) Forecast, by Application 2020 & 2033
- Table 67: Rest of Asia Pacific Offshore AUV and ROV Market Revenue (Million) Forecast, by Application 2020 & 2033
- Table 68: Rest of Asia Pacific Offshore AUV and ROV Market Volume (K Unit) Forecast, by Application 2020 & 2033
- Table 69: Global Offshore AUV and ROV Market Revenue Million Forecast, by Vehicle Type 2020 & 2033
- Table 70: Global Offshore AUV and ROV Market Volume K Unit Forecast, by Vehicle Type 2020 & 2033
- Table 71: Global Offshore AUV and ROV Market Revenue Million Forecast, by Vehicle Class 2020 & 2033
- Table 72: Global Offshore AUV and ROV Market Volume K Unit Forecast, by Vehicle Class 2020 & 2033
- Table 73: Global Offshore AUV and ROV Market Revenue Million Forecast, by End-user Application 2020 & 2033
- Table 74: Global Offshore AUV and ROV Market Volume K Unit Forecast, by End-user Application 2020 & 2033
- Table 75: Global Offshore AUV and ROV Market Revenue Million Forecast, by Activity 2020 & 2033
- Table 76: Global Offshore AUV and ROV Market Volume K Unit Forecast, by Activity 2020 & 2033
- Table 77: Global Offshore AUV and ROV Market Revenue Million Forecast, by Country 2020 & 2033
- Table 78: Global Offshore AUV and ROV Market Volume K Unit Forecast, by Country 2020 & 2033
- Table 79: Brazil Offshore AUV and ROV Market Revenue (Million) Forecast, by Application 2020 & 2033
- Table 80: Brazil Offshore AUV and ROV Market Volume (K Unit) Forecast, by Application 2020 & 2033
- Table 81: Venezuela Offshore AUV and ROV Market Revenue (Million) Forecast, by Application 2020 & 2033
- Table 82: Venezuela Offshore AUV and ROV Market Volume (K Unit) Forecast, by Application 2020 & 2033
- Table 83: Argentina Offshore AUV and ROV Market Revenue (Million) Forecast, by Application 2020 & 2033
- Table 84: Argentina Offshore AUV and ROV Market Volume (K Unit) Forecast, by Application 2020 & 2033
- Table 85: Colombia Offshore AUV and ROV Market Revenue (Million) Forecast, by Application 2020 & 2033
- Table 86: Colombia Offshore AUV and ROV Market Volume (K Unit) Forecast, by Application 2020 & 2033
- Table 87: Rest of South America Offshore AUV and ROV Market Revenue (Million) Forecast, by Application 2020 & 2033
- Table 88: Rest of South America Offshore AUV and ROV Market Volume (K Unit) Forecast, by Application 2020 & 2033
- Table 89: Global Offshore AUV and ROV Market Revenue Million Forecast, by Vehicle Type 2020 & 2033
- Table 90: Global Offshore AUV and ROV Market Volume K Unit Forecast, by Vehicle Type 2020 & 2033
- Table 91: Global Offshore AUV and ROV Market Revenue Million Forecast, by Vehicle Class 2020 & 2033
- Table 92: Global Offshore AUV and ROV Market Volume K Unit Forecast, by Vehicle Class 2020 & 2033
- Table 93: Global Offshore AUV and ROV Market Revenue Million Forecast, by End-user Application 2020 & 2033
- Table 94: Global Offshore AUV and ROV Market Volume K Unit Forecast, by End-user Application 2020 & 2033
- Table 95: Global Offshore AUV and ROV Market Revenue Million Forecast, by Activity 2020 & 2033
- Table 96: Global Offshore AUV and ROV Market Volume K Unit Forecast, by Activity 2020 & 2033
- Table 97: Global Offshore AUV and ROV Market Revenue Million Forecast, by Country 2020 & 2033
- Table 98: Global Offshore AUV and ROV Market Volume K Unit Forecast, by Country 2020 & 2033
- Table 99: Saudi Arabia Offshore AUV and ROV Market Revenue (Million) Forecast, by Application 2020 & 2033
- Table 100: Saudi Arabia Offshore AUV and ROV Market Volume (K Unit) Forecast, by Application 2020 & 2033
- Table 101: United Arab Emirates Offshore AUV and ROV Market Revenue (Million) Forecast, by Application 2020 & 2033
- Table 102: United Arab Emirates Offshore AUV and ROV Market Volume (K Unit) Forecast, by Application 2020 & 2033
- Table 103: Qatar Offshore AUV and ROV Market Revenue (Million) Forecast, by Application 2020 & 2033
- Table 104: Qatar Offshore AUV and ROV Market Volume (K Unit) Forecast, by Application 2020 & 2033
- Table 105: Nigeria Offshore AUV and ROV Market Revenue (Million) Forecast, by Application 2020 & 2033
- Table 106: Nigeria Offshore AUV and ROV Market Volume (K Unit) Forecast, by Application 2020 & 2033
- Table 107: Rest of Middle East and Africa Offshore AUV and ROV Market Revenue (Million) Forecast, by Application 2020 & 2033
- Table 108: Rest of Middle East and Africa Offshore AUV and ROV Market Volume (K Unit) Forecast, by Application 2020 & 2033
Frequently Asked Questions
1. What is the projected Compound Annual Growth Rate (CAGR) of the Offshore AUV and ROV Market?
The projected CAGR is approximately 7.69%.
2. Which companies are prominent players in the Offshore AUV and ROV Market?
Key companies in the market include DOF Subsea AS, Helix Energy Solutions Group Inc, Fugro NV, Bourbon, Oceaneering International Inc, Saipem SpA, DeepOcean AS, Subsea 7 SA, Teledyne Technologies Incorporated*List Not Exhaustive, TechnipFMC PLC.
3. What are the main segments of the Offshore AUV and ROV Market?
The market segments include Vehicle Type, Vehicle Class, End-user Application, Activity.
4. Can you provide details about the market size?
The market size is estimated to be USD 2.63 Million as of 2022.
5. What are some drivers contributing to market growth?
4.; Increasing Offshore Oil and Gas Exploration Activities in the American. Asia-Pacific. and Middle-East and African Regions4.; Growing Offshore Renewable Technologies.
6. What are the notable trends driving market growth?
Oil and Gas Segment to Dominate the Market.
7. Are there any restraints impacting market growth?
4.; Ban on Offshore Exploration and Production Activities in Multiple Regions.
8. Can you provide examples of recent developments in the market?
Jan 2024: DeepTech won a three-year contract to provide rig support ROV services for BP Plc on the West Nile Delta development offshore Egypt. As part of the contract, two work class ROVs are provided to support the drilling, completion, and subsea activities directly on this long-term contract, which includes an option for further extension.
9. What pricing options are available for accessing the report?
Pricing options include single-user, multi-user, and enterprise licenses priced at USD 4750, USD 5250, and USD 8750 respectively.
10. Is the market size provided in terms of value or volume?
The market size is provided in terms of value, measured in Million and volume, measured in K Unit.
11. Are there any specific market keywords associated with the report?
Yes, the market keyword associated with the report is "Offshore AUV and ROV Market," which aids in identifying and referencing the specific market segment covered.
12. How do I determine which pricing option suits my needs best?
The pricing options vary based on user requirements and access needs. Individual users may opt for single-user licenses, while businesses requiring broader access may choose multi-user or enterprise licenses for cost-effective access to the report.
13. Are there any additional resources or data provided in the Offshore AUV and ROV Market report?
While the report offers comprehensive insights, it's advisable to review the specific contents or supplementary materials provided to ascertain if additional resources or data are available.
14. How can I stay updated on further developments or reports in the Offshore AUV and ROV Market?
To stay informed about further developments, trends, and reports in the Offshore AUV and ROV Market, consider subscribing to industry newsletters, following relevant companies and organizations, or regularly checking reputable industry news sources and publications.
Methodology
Step 1 - Identification of Relevant Samples Size from Population Database


Step 2 - Approaches for Defining Global Market Size (Value, Volume* & Price*)

Note*: In applicable scenarios
Step 3 - Data Sources
Primary Research
- Web Analytics
- Survey Reports
- Research Institute
- Latest Research Reports
- Opinion Leaders
Secondary Research
- Annual Reports
- White Paper
- Latest Press Release
- Industry Association
- Paid Database
- Investor Presentations

Step 4 - Data Triangulation
Involves using different sources of information in order to increase the validity of a study
These sources are likely to be stakeholders in a program - participants, other researchers, program staff, other community members, and so on.
Then we put all data in single framework & apply various statistical tools to find out the dynamic on the market.
During the analysis stage, feedback from the stakeholder groups would be compared to determine areas of agreement as well as areas of divergence