

Key Insights
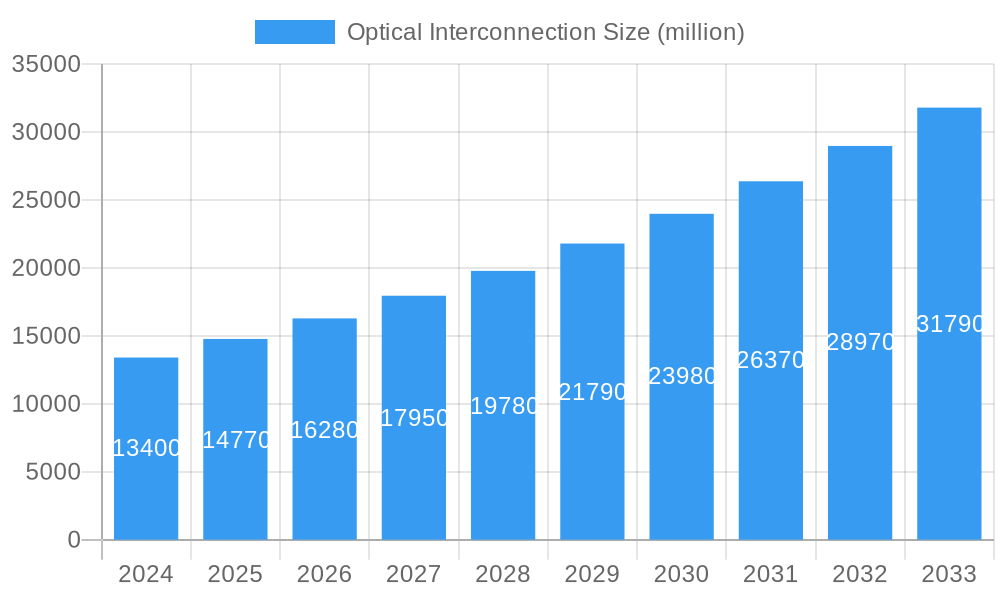
The global Optical Interconnection market is experiencing robust expansion, projected to reach a significant $13.4 billion in 2024. This growth is fueled by the ever-increasing demand for higher bandwidth and faster data transmission across various sectors. The market is set to witness a compound annual growth rate (CAGR) of 10.42% through 2033, indicating sustained and strong upward momentum. Key drivers include the insatiable need for enhanced data communication infrastructure, particularly driven by the proliferation of cloud computing, big data analytics, and the ever-growing volume of internet traffic. The telecommunication sector is a primary beneficiary and contributor to this growth, constantly upgrading its networks to support 5G deployment, fiber-to-the-home initiatives, and advanced network architectures. The market is segmenting effectively, with both Single Mode Fiber (SMF) and Multimode Fiber (MMF) playing crucial roles in diverse applications, from long-haul telecommunications to shorter-reach data center interconnections.
Optical Interconnection Market Size (In Billion)
The competitive landscape features prominent players like Lumentum Operations LLC, Molex, LLC, NVIDIA Corporation, and Broadcom Inc., actively innovating and expanding their product portfolios to meet evolving market needs. Emerging trends such as the development of higher-speed optical transceivers, advancements in photonic integrated circuits (PICs), and the increasing adoption of co-packaged optics are shaping the future of optical interconnections. While the market is characterized by strong growth, potential restraints could emerge from the complexities of supply chain management for advanced optical components and the significant capital investment required for network infrastructure upgrades. However, the overarching trend of digitalization across industries, coupled with the relentless pursuit of faster, more efficient data transfer, positions the optical interconnection market for continued substantial growth and innovation over the forecast period.
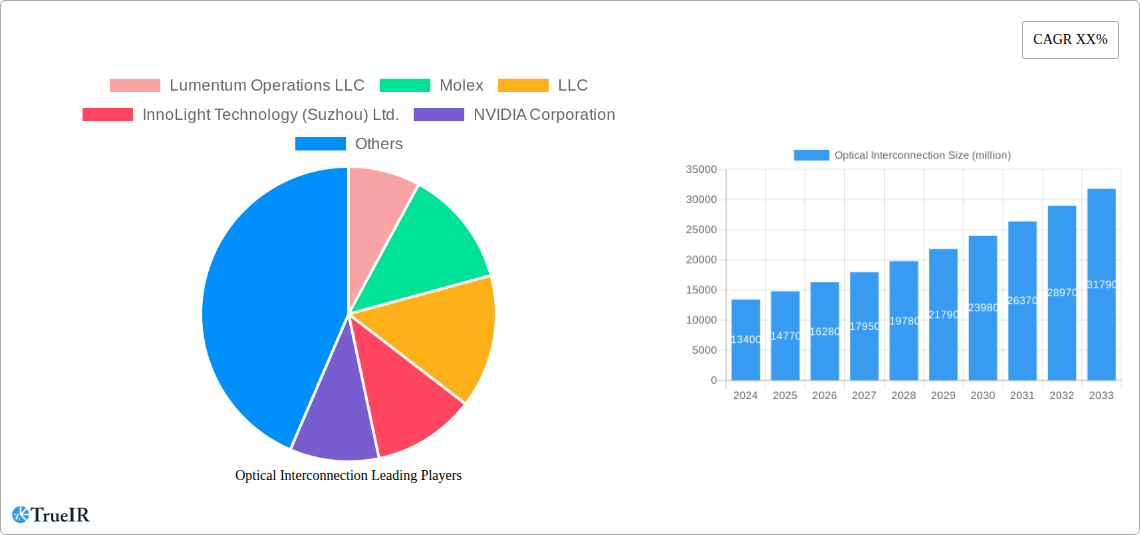
Optical Interconnection Company Market Share
This comprehensive report on the Optical Interconnection market provides an in-depth analysis of its current state and future trajectory, meticulously examining the period from 2019 to 2033. With a base year of 2025 and a forecast period extending through 2033, this research is designed to equip industry stakeholders with actionable insights for strategic decision-making. The report leverages high-volume keywords crucial for SEO, including "optical interconnects," "high-speed data communication," "telecom optical modules," "fiber optic connectivity," and "next-generation networking."
Optical Interconnection Market Structure & Competitive Landscape
The optical interconnection market exhibits a moderately concentrated structure, with several key players dominating a significant portion of market share. In 2025, the top 5 companies are estimated to hold approximately 60 billion USD in combined revenue, with Lumentum Operations LLC, Molex, LLC, InnoLight Technology (Suzhou) Ltd., NVIDIA Corporation, and Broadcom Inc. leading the pack. Innovation drivers are primarily fueled by the relentless demand for increased bandwidth and reduced latency in data centers, telecommunications, and emerging AI workloads. Regulatory impacts, while generally supportive of infrastructure development, can introduce complexities related to trade policies and component sourcing. Product substitutes, such as advanced copper interconnects for shorter reach applications, pose a moderate threat, but the unparalleled performance of optical solutions for high-speed, long-distance communication ensures their continued dominance. End-user segmentation reveals a strong reliance on the data communication segment, accounting for an estimated 70 billion USD in market spend, followed by telecommunication at 30 billion USD. Mergers and acquisitions (M&A) activity has been consistent, with an average of 5 significant deals per year valued at over 1 billion USD each, aimed at consolidating market share, acquiring key technologies, and expanding geographical reach.
Optical Interconnection Market Trends & Opportunities
The global optical interconnection market is poised for substantial growth, projected to reach an estimated 250 billion USD by 2033, exhibiting a compound annual growth rate (CAGR) of approximately 12%. This expansion is primarily driven by the insatiable demand for higher bandwidth stemming from hyperscale data centers, the proliferation of 5G networks, and the burgeoning adoption of artificial intelligence and machine learning. Technological shifts are characterized by the evolution towards higher data rates, with 400GbE, 800GbE, and even 1.6Tbps solutions becoming increasingly prevalent. Furthermore, advancements in silicon photonics and co-packaged optics are enabling more integrated and power-efficient interconnect solutions. Consumer preferences, especially within the enterprise and cloud service provider segments, are leaning towards pluggable modules offering greater flexibility, interoperability, and cost-effectiveness. However, the competitive dynamics are intense, with established giants and agile innovators vying for market leadership. Opportunities abound in the development of advanced optical transceivers, passive optical components, and specialized interconnect solutions for data-intensive applications like high-performance computing and edge computing. The market penetration rate for high-speed optical interconnections within data centers is projected to exceed 80% by 2033. The ongoing digital transformation across industries, coupled with the increasing volume of data generated and processed, creates a fertile ground for innovation and market expansion in optical interconnect technologies.
Dominant Markets & Segments in Optical Interconnection
The Data Communication application segment is the undisputed leader in the optical interconnection market, projected to command an impressive 70% of the total market value, estimated at 175 billion USD by 2033. This dominance is fueled by the explosive growth of hyperscale data centers, cloud computing infrastructure, and the increasing demand for high-speed networking within enterprise environments. Key growth drivers include the exponential rise in data traffic generated by video streaming, online gaming, social media, and the ever-expanding Internet of Things (IoT). The telecommunication segment follows as a significant contributor, with an estimated market value of 75 billion USD by 2033, driven by the global rollout of 5G networks and the upgrade of existing fiber optic infrastructure to support higher bandwidth demands.
Within the types of optical fibers, Single Mode Fiber (SMF) holds a majority share due to its superior bandwidth and reach capabilities, essential for long-haul telecommunications and high-speed data center interconnects. Multimode Fiber (MMF) remains crucial for shorter-reach applications within data centers and enterprise networks, offering a more cost-effective solution for many internal connectivity needs.
Geographically, North America and Asia-Pacific are the dominant regions. North America's leadership is attributed to its mature data center ecosystem, substantial investments in cloud infrastructure, and the presence of major technology companies driving innovation. Asia-Pacific, particularly China, is witnessing rapid growth due to significant government investments in 5G deployment, data center expansion, and the burgeoning digital economy. Countries like Japan and South Korea are also key contributors to this regional dominance, driven by their advanced telecommunication networks and strong manufacturing capabilities.
Optical Interconnection Product Analysis
Optical interconnection products are witnessing rapid innovation focused on higher speeds, increased density, and enhanced power efficiency. The development of 400GbE and 800GbE optical transceivers, leveraging advanced modulation formats and integrated photonics, represents a significant leap in performance. Co-packaged optics (CPO) are emerging as a key innovation, integrating optical engines directly onto or adjacent to high-performance ASICs, reducing power consumption and signal loss for extreme density applications. These advancements offer competitive advantages by enabling data centers to handle ever-increasing traffic volumes with greater efficiency and lower operational costs.
Key Drivers, Barriers & Challenges in Optical Interconnection
Key Drivers:
- Explosive Data Growth: The relentless surge in data traffic from AI, cloud computing, and streaming services necessitates higher bandwidth optical interconnects.
- 5G Network Expansion: The deployment of 5G infrastructure requires vast optical connectivity for backhaul and fronthaul.
- Data Center Modernization: Hyperscale and edge data centers are continuously upgrading to higher speeds and denser interconnect solutions.
- Technological Advancements: Innovations in silicon photonics, co-packaged optics, and advanced modulation schemes are driving performance gains.
Key Barriers & Challenges:
- Supply Chain Volatility: Geopolitical factors and component shortages can impact manufacturing and lead times, with potential cost increases of up to 15%.
- High R&D Costs: Developing cutting-edge optical technologies requires significant and sustained investment.
- Standardization Efforts: The pace of evolving standards can create interoperability challenges and require continuous adaptation.
- Power Consumption Concerns: While improving, power consumption remains a critical factor for large-scale deployments, with ongoing efforts to reduce energy footprints by up to 20% in next-generation solutions.
- Skilled Workforce Shortage: The specialized nature of optical technologies creates a demand for skilled engineers and technicians.
Growth Drivers in the Optical Interconnection Market
The optical interconnection market's growth is primarily propelled by the escalating demand for high-speed data transmission driven by artificial intelligence (AI), machine learning (ML), and the expansion of cloud infrastructure. The global rollout of 5G networks acts as a significant catalyst, requiring robust and high-capacity optical backhaul and fronthaul solutions. Furthermore, the continuous modernization and expansion of hyperscale data centers, coupled with the emergence of edge computing deployments, necessitate advanced optical interconnects to manage increasing data flows. Technological advancements, particularly in silicon photonics and advanced modulation techniques, are enabling more compact, power-efficient, and cost-effective optical solutions, further fueling market expansion. Government initiatives promoting digital transformation and broadband infrastructure development in various regions also contribute to this growth trajectory.
Challenges Impacting Optical Interconnection Growth
Despite robust growth, several challenges temper the expansion of the optical interconnection market. Supply chain disruptions, exacerbated by global events and component shortages, can lead to production delays and increased costs for manufacturers. The high research and development (R&D) expenditures required for cutting-edge optical technologies pose a significant financial hurdle. Evolving industry standards and the need for backward compatibility can create interoperability complexities and necessitate continuous adaptation. Furthermore, while power efficiency is improving, the overall energy consumption of high-density optical systems remains a concern for large-scale data center operations, pushing for further innovation in this area. Competitive pressures among established players and new entrants also drive down margins, requiring a constant focus on innovation and cost optimization.
Key Players Shaping the Optical Interconnection Market
- Lumentum Operations LLC
- Molex, LLC
- InnoLight Technology (Suzhou) Ltd.
- NVIDIA Corporation
- Fujitsu Ltd.
- Sumitomo Electric Industries, Ltd.
- Broadcom Inc.
- TE Connectivity
- Amphenol Corporation
- Accelink Technology Co
Significant Optical Interconnection Industry Milestones
- 2019: Introduction of 400GbE optical transceivers at scale, significantly boosting data center interconnect speeds.
- 2020: Increased adoption of QSFP-DD form factor for high-density applications.
- 2021: Advancements in silicon photonics enabling more integrated and cost-effective optical engines.
- 2022: Growing interest and early deployments of Co-Packaged Optics (CPO) for next-generation high-performance computing.
- 2023: Maturation of 800GbE optical transceiver technology, with initial commercial availability.
- 2024: Focus on developing sustainable and power-efficient optical interconnect solutions to meet environmental goals.
Future Outlook for Optical Interconnection Market
The future outlook for the optical interconnection market is exceptionally bright, driven by sustained demand for higher bandwidth and faster data transfer speeds. Strategic opportunities lie in the continued development and adoption of technologies like 800GbE and the emerging 1.6Tbps solutions, catering to the ever-increasing needs of AI, 5G, and hyperscale data centers. The advancement of Co-Packaged Optics (CPO) holds significant potential to revolutionize data center architectures, offering unprecedented density and power savings. Furthermore, the expansion of optical interconnects into new application areas like automotive and industrial automation will create further growth avenues. The market is expected to witness continued innovation in pluggable module technology, offering enhanced flexibility and interoperability. Overall, the optical interconnection market is poised for robust and sustained growth through the forecast period.
Optical Interconnection Segmentation
-
1. Application
- 1.1. Data Communication
- 1.2. Telecommunication
-
2. Types
- 2.1. Single Mode Fiber
- 2.2. Multimode Fiber
Optical Interconnection Segmentation By Geography
-
1. North America
- 1.1. United States
- 1.2. Canada
- 1.3. Mexico
-
2. South America
- 2.1. Brazil
- 2.2. Argentina
- 2.3. Rest of South America
-
3. Europe
- 3.1. United Kingdom
- 3.2. Germany
- 3.3. France
- 3.4. Italy
- 3.5. Spain
- 3.6. Russia
- 3.7. Benelux
- 3.8. Nordics
- 3.9. Rest of Europe
-
4. Middle East & Africa
- 4.1. Turkey
- 4.2. Israel
- 4.3. GCC
- 4.4. North Africa
- 4.5. South Africa
- 4.6. Rest of Middle East & Africa
-
5. Asia Pacific
- 5.1. China
- 5.2. India
- 5.3. Japan
- 5.4. South Korea
- 5.5. ASEAN
- 5.6. Oceania
- 5.7. Rest of Asia Pacific
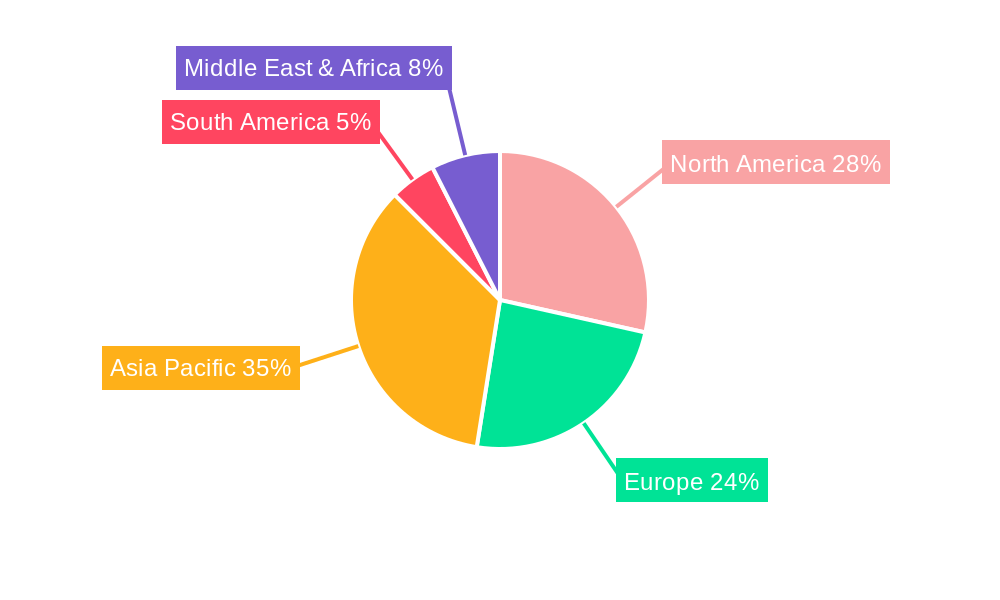
Optical Interconnection Regional Market Share
Geographic Coverage of Optical Interconnection
Optical Interconnection REPORT HIGHLIGHTS
| Aspects | Details |
|---|---|
| Study Period | 2020-2034 |
| Base Year | 2025 |
| Estimated Year | 2026 |
| Forecast Period | 2026-2034 |
| Historical Period | 2020-2025 |
| Growth Rate | CAGR of 10.42% from 2020-2034 |
| Segmentation |
|
Table of Contents
- 1. Introduction
- 1.1. Research Scope
- 1.2. Market Segmentation
- 1.3. Research Objective
- 1.4. Definitions and Assumptions
- 2. Executive Summary
- 2.1. Market Snapshot
- 3. Market Dynamics
- 3.1. Market Drivers
- 3.2. Market Restrains
- 3.3. Market Trends
- 3.4. Market Opportunities
- 4. Market Factor Analysis
- 4.1. Porters Five Forces
- 4.1.1. Bargaining Power of Suppliers
- 4.1.2. Bargaining Power of Buyers
- 4.1.3. Threat of New Entrants
- 4.1.4. Threat of Substitutes
- 4.1.5. Competitive Rivalry
- 4.2. PESTEL analysis
- 4.3. BCG Analysis
- 4.3.1. Stars (High Growth, High Market Share)
- 4.3.2. Cash Cows (Low Growth, High Market Share)
- 4.3.3. Question Mark (High Growth, Low Market Share)
- 4.3.4. Dogs (Low Growth, Low Market Share)
- 4.4. Ansoff Matrix Analysis
- 4.5. Supply Chain Analysis
- 4.6. Regulatory Landscape
- 4.7. Current Market Potential and Opportunity Assessment (TAM–SAM–SOM Framework)
- 4.8. TIR Analyst Note
- 4.1. Porters Five Forces
- 5. Market Analysis, Insights and Forecast 2021-2033
- 5.1. Market Analysis, Insights and Forecast - by Application
- 5.1.1. Data Communication
- 5.1.2. Telecommunication
- 5.2. Market Analysis, Insights and Forecast - by Types
- 5.2.1. Single Mode Fiber
- 5.2.2. Multimode Fiber
- 5.3. Market Analysis, Insights and Forecast - by Region
- 5.3.1. North America
- 5.3.2. South America
- 5.3.3. Europe
- 5.3.4. Middle East & Africa
- 5.3.5. Asia Pacific
- 5.1. Market Analysis, Insights and Forecast - by Application
- 6. Global Optical Interconnection Analysis, Insights and Forecast, 2021-2033
- 6.1. Market Analysis, Insights and Forecast - by Application
- 6.1.1. Data Communication
- 6.1.2. Telecommunication
- 6.2. Market Analysis, Insights and Forecast - by Types
- 6.2.1. Single Mode Fiber
- 6.2.2. Multimode Fiber
- 6.1. Market Analysis, Insights and Forecast - by Application
- 7. North America Optical Interconnection Analysis, Insights and Forecast, 2020-2032
- 7.1. Market Analysis, Insights and Forecast - by Application
- 7.1.1. Data Communication
- 7.1.2. Telecommunication
- 7.2. Market Analysis, Insights and Forecast - by Types
- 7.2.1. Single Mode Fiber
- 7.2.2. Multimode Fiber
- 7.1. Market Analysis, Insights and Forecast - by Application
- 8. South America Optical Interconnection Analysis, Insights and Forecast, 2020-2032
- 8.1. Market Analysis, Insights and Forecast - by Application
- 8.1.1. Data Communication
- 8.1.2. Telecommunication
- 8.2. Market Analysis, Insights and Forecast - by Types
- 8.2.1. Single Mode Fiber
- 8.2.2. Multimode Fiber
- 8.1. Market Analysis, Insights and Forecast - by Application
- 9. Europe Optical Interconnection Analysis, Insights and Forecast, 2020-2032
- 9.1. Market Analysis, Insights and Forecast - by Application
- 9.1.1. Data Communication
- 9.1.2. Telecommunication
- 9.2. Market Analysis, Insights and Forecast - by Types
- 9.2.1. Single Mode Fiber
- 9.2.2. Multimode Fiber
- 9.1. Market Analysis, Insights and Forecast - by Application
- 10. Middle East & Africa Optical Interconnection Analysis, Insights and Forecast, 2020-2032
- 10.1. Market Analysis, Insights and Forecast - by Application
- 10.1.1. Data Communication
- 10.1.2. Telecommunication
- 10.2. Market Analysis, Insights and Forecast - by Types
- 10.2.1. Single Mode Fiber
- 10.2.2. Multimode Fiber
- 10.1. Market Analysis, Insights and Forecast - by Application
- 11. Asia Pacific Optical Interconnection Analysis, Insights and Forecast, 2020-2032
- 11.1. Market Analysis, Insights and Forecast - by Application
- 11.1.1. Data Communication
- 11.1.2. Telecommunication
- 11.2. Market Analysis, Insights and Forecast - by Types
- 11.2.1. Single Mode Fiber
- 11.2.2. Multimode Fiber
- 11.1. Market Analysis, Insights and Forecast - by Application
- 12. Competitive Analysis
- 12.1. Company Profiles
- 12.1.1 Lumentum Operations LLC
- 12.1.1.1. Company Overview
- 12.1.1.2. Products
- 12.1.1.3. Company Financials
- 12.1.1.4. SWOT Analysis
- 12.1.2 Molex
- 12.1.2.1. Company Overview
- 12.1.2.2. Products
- 12.1.2.3. Company Financials
- 12.1.2.4. SWOT Analysis
- 12.1.3 LLC
- 12.1.3.1. Company Overview
- 12.1.3.2. Products
- 12.1.3.3. Company Financials
- 12.1.3.4. SWOT Analysis
- 12.1.4 InnoLight Technology (Suzhou) Ltd.
- 12.1.4.1. Company Overview
- 12.1.4.2. Products
- 12.1.4.3. Company Financials
- 12.1.4.4. SWOT Analysis
- 12.1.5 NVIDIA Corporation
- 12.1.5.1. Company Overview
- 12.1.5.2. Products
- 12.1.5.3. Company Financials
- 12.1.5.4. SWOT Analysis
- 12.1.6 Fujitsu Ltd.
- 12.1.6.1. Company Overview
- 12.1.6.2. Products
- 12.1.6.3. Company Financials
- 12.1.6.4. SWOT Analysis
- 12.1.7 Sumitomo Electric Industries
- 12.1.7.1. Company Overview
- 12.1.7.2. Products
- 12.1.7.3. Company Financials
- 12.1.7.4. SWOT Analysis
- 12.1.8 Ltd.
- 12.1.8.1. Company Overview
- 12.1.8.2. Products
- 12.1.8.3. Company Financials
- 12.1.8.4. SWOT Analysis
- 12.1.9 Broadcom Inc.
- 12.1.9.1. Company Overview
- 12.1.9.2. Products
- 12.1.9.3. Company Financials
- 12.1.9.4. SWOT Analysis
- 12.1.10 TE Connectivity
- 12.1.10.1. Company Overview
- 12.1.10.2. Products
- 12.1.10.3. Company Financials
- 12.1.10.4. SWOT Analysis
- 12.1.11 Amphenol Corporation
- 12.1.11.1. Company Overview
- 12.1.11.2. Products
- 12.1.11.3. Company Financials
- 12.1.11.4. SWOT Analysis
- 12.1.12 Accelink Technology Co
- 12.1.12.1. Company Overview
- 12.1.12.2. Products
- 12.1.12.3. Company Financials
- 12.1.12.4. SWOT Analysis
- 12.1.1 Lumentum Operations LLC
- 12.2. Market Entropy
- 12.2.1 Company's Key Areas Served
- 12.2.2 Recent Developments
- 12.3. Company Market Share Analysis 2025
- 12.3.1 Top 5 Companies Market Share Analysis
- 12.3.2 Top 3 Companies Market Share Analysis
- 12.4. List of Potential Customers
- 13. Research Methodology
List of Figures
- Figure 1: Global Optical Interconnection Revenue Breakdown (undefined, %) by Region 2025 & 2033
- Figure 2: North America Optical Interconnection Revenue (undefined), by Application 2025 & 2033
- Figure 3: North America Optical Interconnection Revenue Share (%), by Application 2025 & 2033
- Figure 4: North America Optical Interconnection Revenue (undefined), by Types 2025 & 2033
- Figure 5: North America Optical Interconnection Revenue Share (%), by Types 2025 & 2033
- Figure 6: North America Optical Interconnection Revenue (undefined), by Country 2025 & 2033
- Figure 7: North America Optical Interconnection Revenue Share (%), by Country 2025 & 2033
- Figure 8: South America Optical Interconnection Revenue (undefined), by Application 2025 & 2033
- Figure 9: South America Optical Interconnection Revenue Share (%), by Application 2025 & 2033
- Figure 10: South America Optical Interconnection Revenue (undefined), by Types 2025 & 2033
- Figure 11: South America Optical Interconnection Revenue Share (%), by Types 2025 & 2033
- Figure 12: South America Optical Interconnection Revenue (undefined), by Country 2025 & 2033
- Figure 13: South America Optical Interconnection Revenue Share (%), by Country 2025 & 2033
- Figure 14: Europe Optical Interconnection Revenue (undefined), by Application 2025 & 2033
- Figure 15: Europe Optical Interconnection Revenue Share (%), by Application 2025 & 2033
- Figure 16: Europe Optical Interconnection Revenue (undefined), by Types 2025 & 2033
- Figure 17: Europe Optical Interconnection Revenue Share (%), by Types 2025 & 2033
- Figure 18: Europe Optical Interconnection Revenue (undefined), by Country 2025 & 2033
- Figure 19: Europe Optical Interconnection Revenue Share (%), by Country 2025 & 2033
- Figure 20: Middle East & Africa Optical Interconnection Revenue (undefined), by Application 2025 & 2033
- Figure 21: Middle East & Africa Optical Interconnection Revenue Share (%), by Application 2025 & 2033
- Figure 22: Middle East & Africa Optical Interconnection Revenue (undefined), by Types 2025 & 2033
- Figure 23: Middle East & Africa Optical Interconnection Revenue Share (%), by Types 2025 & 2033
- Figure 24: Middle East & Africa Optical Interconnection Revenue (undefined), by Country 2025 & 2033
- Figure 25: Middle East & Africa Optical Interconnection Revenue Share (%), by Country 2025 & 2033
- Figure 26: Asia Pacific Optical Interconnection Revenue (undefined), by Application 2025 & 2033
- Figure 27: Asia Pacific Optical Interconnection Revenue Share (%), by Application 2025 & 2033
- Figure 28: Asia Pacific Optical Interconnection Revenue (undefined), by Types 2025 & 2033
- Figure 29: Asia Pacific Optical Interconnection Revenue Share (%), by Types 2025 & 2033
- Figure 30: Asia Pacific Optical Interconnection Revenue (undefined), by Country 2025 & 2033
- Figure 31: Asia Pacific Optical Interconnection Revenue Share (%), by Country 2025 & 2033
List of Tables
- Table 1: Global Optical Interconnection Revenue undefined Forecast, by Application 2020 & 2033
- Table 2: Global Optical Interconnection Revenue undefined Forecast, by Types 2020 & 2033
- Table 3: Global Optical Interconnection Revenue undefined Forecast, by Region 2020 & 2033
- Table 4: Global Optical Interconnection Revenue undefined Forecast, by Application 2020 & 2033
- Table 5: Global Optical Interconnection Revenue undefined Forecast, by Types 2020 & 2033
- Table 6: Global Optical Interconnection Revenue undefined Forecast, by Country 2020 & 2033
- Table 7: United States Optical Interconnection Revenue (undefined) Forecast, by Application 2020 & 2033
- Table 8: Canada Optical Interconnection Revenue (undefined) Forecast, by Application 2020 & 2033
- Table 9: Mexico Optical Interconnection Revenue (undefined) Forecast, by Application 2020 & 2033
- Table 10: Global Optical Interconnection Revenue undefined Forecast, by Application 2020 & 2033
- Table 11: Global Optical Interconnection Revenue undefined Forecast, by Types 2020 & 2033
- Table 12: Global Optical Interconnection Revenue undefined Forecast, by Country 2020 & 2033
- Table 13: Brazil Optical Interconnection Revenue (undefined) Forecast, by Application 2020 & 2033
- Table 14: Argentina Optical Interconnection Revenue (undefined) Forecast, by Application 2020 & 2033
- Table 15: Rest of South America Optical Interconnection Revenue (undefined) Forecast, by Application 2020 & 2033
- Table 16: Global Optical Interconnection Revenue undefined Forecast, by Application 2020 & 2033
- Table 17: Global Optical Interconnection Revenue undefined Forecast, by Types 2020 & 2033
- Table 18: Global Optical Interconnection Revenue undefined Forecast, by Country 2020 & 2033
- Table 19: United Kingdom Optical Interconnection Revenue (undefined) Forecast, by Application 2020 & 2033
- Table 20: Germany Optical Interconnection Revenue (undefined) Forecast, by Application 2020 & 2033
- Table 21: France Optical Interconnection Revenue (undefined) Forecast, by Application 2020 & 2033
- Table 22: Italy Optical Interconnection Revenue (undefined) Forecast, by Application 2020 & 2033
- Table 23: Spain Optical Interconnection Revenue (undefined) Forecast, by Application 2020 & 2033
- Table 24: Russia Optical Interconnection Revenue (undefined) Forecast, by Application 2020 & 2033
- Table 25: Benelux Optical Interconnection Revenue (undefined) Forecast, by Application 2020 & 2033
- Table 26: Nordics Optical Interconnection Revenue (undefined) Forecast, by Application 2020 & 2033
- Table 27: Rest of Europe Optical Interconnection Revenue (undefined) Forecast, by Application 2020 & 2033
- Table 28: Global Optical Interconnection Revenue undefined Forecast, by Application 2020 & 2033
- Table 29: Global Optical Interconnection Revenue undefined Forecast, by Types 2020 & 2033
- Table 30: Global Optical Interconnection Revenue undefined Forecast, by Country 2020 & 2033
- Table 31: Turkey Optical Interconnection Revenue (undefined) Forecast, by Application 2020 & 2033
- Table 32: Israel Optical Interconnection Revenue (undefined) Forecast, by Application 2020 & 2033
- Table 33: GCC Optical Interconnection Revenue (undefined) Forecast, by Application 2020 & 2033
- Table 34: North Africa Optical Interconnection Revenue (undefined) Forecast, by Application 2020 & 2033
- Table 35: South Africa Optical Interconnection Revenue (undefined) Forecast, by Application 2020 & 2033
- Table 36: Rest of Middle East & Africa Optical Interconnection Revenue (undefined) Forecast, by Application 2020 & 2033
- Table 37: Global Optical Interconnection Revenue undefined Forecast, by Application 2020 & 2033
- Table 38: Global Optical Interconnection Revenue undefined Forecast, by Types 2020 & 2033
- Table 39: Global Optical Interconnection Revenue undefined Forecast, by Country 2020 & 2033
- Table 40: China Optical Interconnection Revenue (undefined) Forecast, by Application 2020 & 2033
- Table 41: India Optical Interconnection Revenue (undefined) Forecast, by Application 2020 & 2033
- Table 42: Japan Optical Interconnection Revenue (undefined) Forecast, by Application 2020 & 2033
- Table 43: South Korea Optical Interconnection Revenue (undefined) Forecast, by Application 2020 & 2033
- Table 44: ASEAN Optical Interconnection Revenue (undefined) Forecast, by Application 2020 & 2033
- Table 45: Oceania Optical Interconnection Revenue (undefined) Forecast, by Application 2020 & 2033
- Table 46: Rest of Asia Pacific Optical Interconnection Revenue (undefined) Forecast, by Application 2020 & 2033
Frequently Asked Questions
1. What is the projected Compound Annual Growth Rate (CAGR) of the Optical Interconnection?
The projected CAGR is approximately 10.42%.
2. Which companies are prominent players in the Optical Interconnection?
Key companies in the market include Lumentum Operations LLC, Molex, LLC, InnoLight Technology (Suzhou) Ltd., NVIDIA Corporation, Fujitsu Ltd., Sumitomo Electric Industries, Ltd., Broadcom Inc., TE Connectivity, Amphenol Corporation, Accelink Technology Co.
3. What are the main segments of the Optical Interconnection?
The market segments include Application, Types.
4. Can you provide details about the market size?
The market size is estimated to be USD XXX N/A as of 2022.
5. What are some drivers contributing to market growth?
N/A
6. What are the notable trends driving market growth?
N/A
7. Are there any restraints impacting market growth?
N/A
8. Can you provide examples of recent developments in the market?
N/A
9. What pricing options are available for accessing the report?
Pricing options include single-user, multi-user, and enterprise licenses priced at USD 2900.00, USD 4350.00, and USD 5800.00 respectively.
10. Is the market size provided in terms of value or volume?
The market size is provided in terms of value, measured in N/A.
11. Are there any specific market keywords associated with the report?
Yes, the market keyword associated with the report is "Optical Interconnection," which aids in identifying and referencing the specific market segment covered.
12. How do I determine which pricing option suits my needs best?
The pricing options vary based on user requirements and access needs. Individual users may opt for single-user licenses, while businesses requiring broader access may choose multi-user or enterprise licenses for cost-effective access to the report.
13. Are there any additional resources or data provided in the Optical Interconnection report?
While the report offers comprehensive insights, it's advisable to review the specific contents or supplementary materials provided to ascertain if additional resources or data are available.
14. How can I stay updated on further developments or reports in the Optical Interconnection?
To stay informed about further developments, trends, and reports in the Optical Interconnection, consider subscribing to industry newsletters, following relevant companies and organizations, or regularly checking reputable industry news sources and publications.
Methodology
Step 1 - Identification of Relevant Samples Size from Population Database


Step 2 - Approaches for Defining Global Market Size (Value, Volume* & Price*)

Note*: In applicable scenarios
Step 3 - Data Sources
Primary Research
- Web Analytics
- Survey Reports
- Research Institute
- Latest Research Reports
- Opinion Leaders
Secondary Research
- Annual Reports
- White Paper
- Latest Press Release
- Industry Association
- Paid Database
- Investor Presentations

Step 4 - Data Triangulation
Involves using different sources of information in order to increase the validity of a study
These sources are likely to be stakeholders in a program - participants, other researchers, program staff, other community members, and so on.
Then we put all data in single framework & apply various statistical tools to find out the dynamic on the market.
During the analysis stage, feedback from the stakeholder groups would be compared to determine areas of agreement as well as areas of divergence