

Key Insights
The global outdoor 3D LED screen market is poised for significant expansion, driven by escalating demand for immersive advertising and entertainment solutions. The market, valued at $10.9 billion in the base year 2025, is projected to achieve a Compound Annual Growth Rate (CAGR) of 9.8% from 2025 to 2033, reaching an estimated $23.5 billion by 2033. This robust growth is underpinned by several key drivers. Advancements in LED technology are delivering brighter, higher-resolution displays with enhanced energy efficiency, making outdoor 3D LED screens increasingly appealing and cost-effective. The proliferation of digital signage, coupled with its integration into smart city frameworks, is opening new deployment opportunities. The entertainment industry, encompassing concerts, sporting events, and theme parks, is actively adopting 3D LED screens to elevate spectator engagement. Furthermore, the integration of augmented reality (AR) and virtual reality (VR) technologies in outdoor advertising is stimulating market growth.
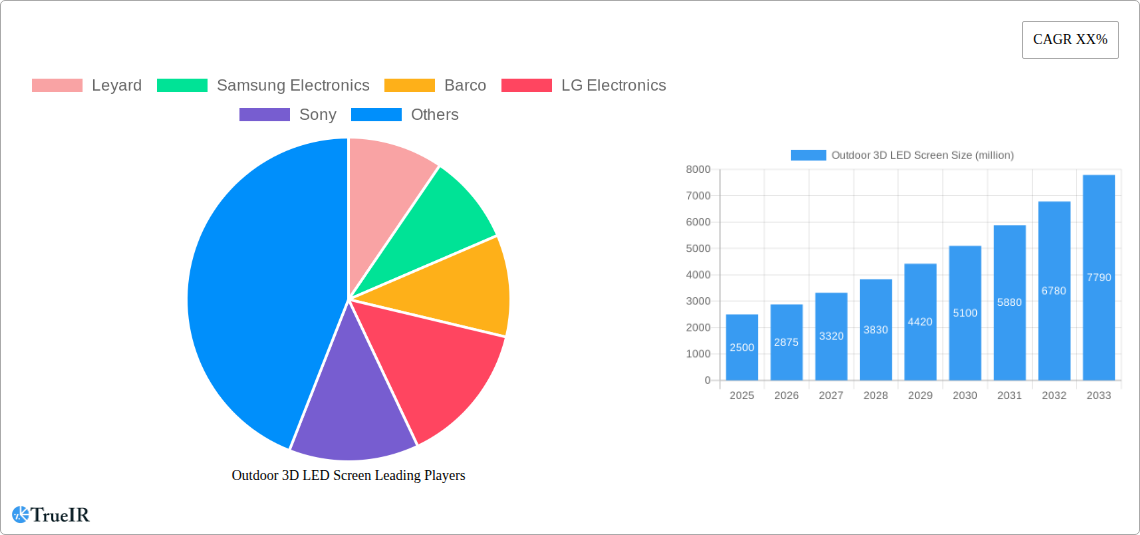
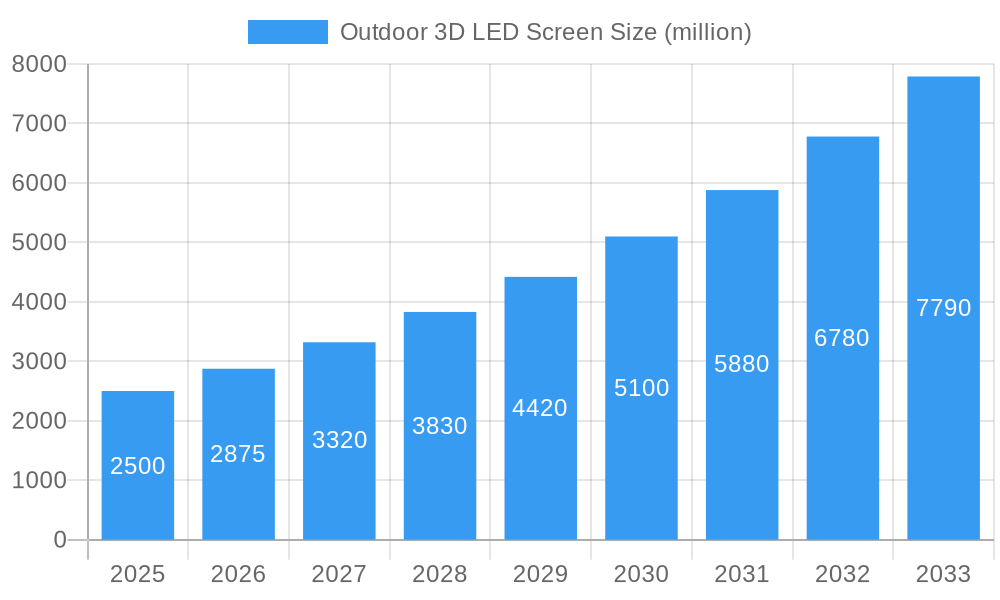
Outdoor 3D LED Screen Market Size (In Billion)
Despite the promising outlook, the market confronts certain obstacles. Substantial initial investment for installation and ongoing maintenance can pose a barrier to adoption for some enterprises. Moreover, considerations regarding energy consumption and environmental impact require strategic attention. Intense competition among prominent vendors, including Leyard, Samsung Electronics, Barco, LG Electronics, and Sony, is exerting pressure on pricing and profit margins. Nevertheless, the long-term trajectory for the outdoor 3D LED screen market remains optimistic, propelled by persistent technological innovation and growing demand across various sectors. Detailed market segmentation by screen size, resolution, application (advertising, entertainment, etc.), and geographic region will provide deeper insights and identify high-potential niche markets.
Outdoor 3D LED Screen Company Market Share
Dynamic Outdoor 3D LED Screen Market Report: 2019-2033
This comprehensive report provides a detailed analysis of the global Outdoor 3D LED Screen market, projecting a multi-million-dollar valuation by 2033. The study covers the period 2019-2033, with a focus on the forecast period 2025-2033, and utilizes 2025 as the base and estimated year. This report is essential for businesses, investors, and researchers seeking insights into market trends, competitive dynamics, and future growth opportunities in this rapidly evolving sector.
Outdoor 3D LED Screen Market Structure & Competitive Landscape
The Outdoor 3D LED Screen market exhibits a moderately concentrated structure, with key players like Leyard, Samsung Electronics, Barco, LG Electronics, and Sony holding significant market share. The Herfindahl-Hirschman Index (HHI) for 2025 is estimated at xx, indicating a moderately concentrated market. Innovation is a crucial driver, with companies constantly investing in higher resolution, brighter displays, and improved energy efficiency. Stringent regulatory compliance regarding safety and environmental standards impacts market dynamics. Product substitutes, such as large-format projectors, pose some competition, but the unique immersive experience offered by 3D LED screens maintains a strong market position. End-user segmentation includes advertising, entertainment, sports venues, and public spaces. M&A activity in the sector has been moderate in recent years, with an estimated xx million USD in deal volume during 2019-2024.
- Market Concentration: Moderately concentrated, with a 2025 HHI estimated at xx.
- Innovation Drivers: Higher resolution, brightness, energy efficiency, and advanced control systems.
- Regulatory Impacts: Safety and environmental standards significantly influence product design and market access.
- Product Substitutes: Large-format projectors, but 3D LED screens maintain a competitive advantage.
- End-User Segmentation: Advertising, entertainment, sports venues, public spaces, and others.
- M&A Trends: Moderate activity with approximately xx million USD in deal volume (2019-2024).
Outdoor 3D LED Screen Market Trends & Opportunities
The global Outdoor 3D LED screen market is experiencing robust growth, driven by rising demand for immersive advertising and entertainment experiences. The market size is projected to reach xx million USD by 2033, exhibiting a compound annual growth rate (CAGR) of xx% during the forecast period. Technological advancements, such as micro-LED and mini-LED technologies, are enhancing display quality and reducing costs. Consumer preference for high-impact visual experiences fuels market expansion, particularly in urban areas with high foot traffic. Increased competition is driving innovation and price reductions, making 3D LED screens more accessible. Market penetration remains relatively low, especially in emerging economies, presenting significant opportunities for future growth.
Dominant Markets & Segments in Outdoor 3D LED Screen
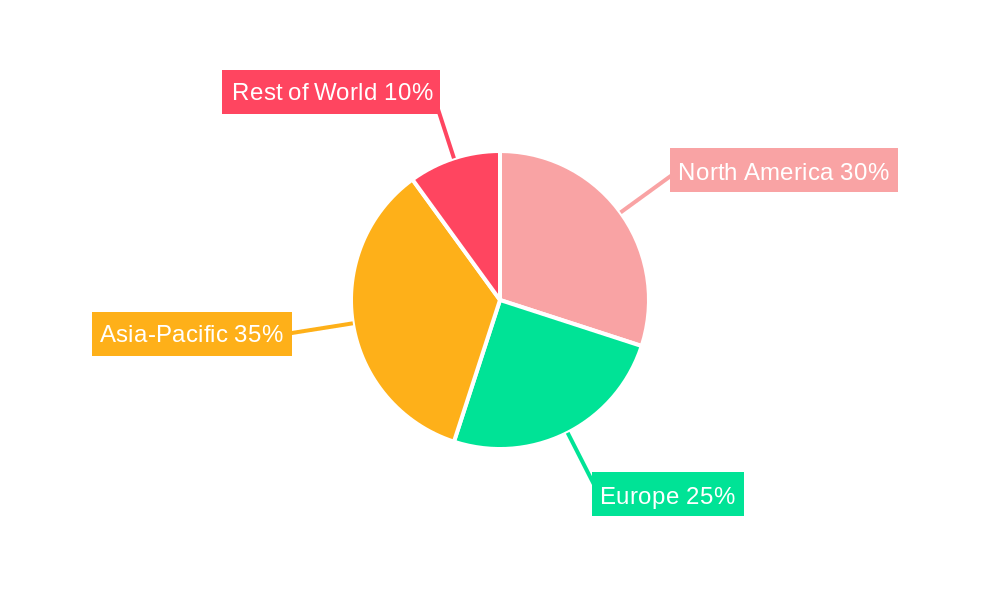
North America currently holds the largest market share, followed by Asia-Pacific and Europe. Within Asia-Pacific, China and Japan are leading markets due to substantial infrastructure development and strong demand from the entertainment and advertising sectors.
- Key Growth Drivers in North America: High disposable incomes, robust advertising spend, and advanced infrastructure.
- Key Growth Drivers in Asia-Pacific: Rapid urbanization, increasing investments in public infrastructure, and growth of entertainment industries.
- Key Growth Drivers in Europe: Strong tourism sector, growing adoption of digital signage, and government initiatives promoting smart cities.
The advertising segment is the largest end-user segment, driven by the effectiveness of outdoor 3D LED screens in attracting attention and enhancing brand recall.
Outdoor 3D LED Screen Product Analysis
Outdoor 3D LED screens are evolving rapidly, with key innovations including higher resolutions, improved brightness and contrast ratios, and enhanced energy efficiency. The use of mini-LED and micro-LED technologies is driving a shift towards smaller pixel pitches, resulting in sharper images and more immersive viewing experiences. These advancements are expanding the applications of 3D LED screens to new sectors, like interactive advertising and augmented reality experiences. Competitive advantages are driven by factors such as display quality, reliability, energy efficiency, and integration capabilities.
Key Drivers, Barriers & Challenges in Outdoor 3D LED Screen
Key Drivers: The increasing demand for immersive advertising, coupled with technological advancements in display technology and falling prices, are key drivers. Government initiatives promoting smart cities and digital signage also contribute.
Challenges: High initial investment costs, complex installation procedures, and susceptibility to weather conditions represent significant barriers. Supply chain disruptions and intense competition further pose challenges to market growth. Stringent regulatory compliance adds to the complexities of market entry.
Growth Drivers in the Outdoor 3D LED Screen Market
Technological advancements in display technologies, increasing demand for visually engaging advertising campaigns, and government initiatives promoting smart cities are major drivers. The rising adoption of 5G networks also facilitates seamless data transmission for dynamic content delivery.
Challenges Impacting Outdoor 3D LED Screen Growth
High initial investment costs, the need for specialized installation and maintenance, and the potential for weather-related damage pose significant challenges. Competition from alternative display technologies and fluctuations in raw material prices are also contributing factors. Regulatory compliance and potential supply chain disruptions further hinder market growth.
Key Players Shaping the Outdoor 3D LED Screen Market
- Leyard
- Samsung Electronics
- Barco
- LG Electronics
- Sony
- Maxtop Technology Industrial
- YuChip
- LianTronics
- Ledcoms
- JYLED
- Maxcolor Visual
- LUXMAGE
Significant Outdoor 3D LED Screen Industry Milestones
- 2020, Q4: Leyard launches its new series of ultra-high-resolution outdoor 3D LED screens.
- 2021, Q2: Samsung Electronics announces a strategic partnership with a major stadium chain to deploy 3D LED screens.
- 2022, Q3: Barco introduces a new energy-efficient outdoor 3D LED screen technology.
- 2023, Q1: A major merger between two smaller LED screen manufacturers occurs. (Further details not available; assuming xx million USD deal value.)
Future Outlook for Outdoor 3D LED Screen Market
The Outdoor 3D LED screen market is poised for continued growth, driven by ongoing technological advancements, increasing adoption in various sectors, and favorable government policies. Strategic partnerships, product innovation, and expansion into new markets represent key opportunities for players in this dynamic sector. The market is projected to maintain a strong growth trajectory throughout the forecast period, driven by a combination of technological advancements, increasing demand from various end-user sectors, and favorable economic conditions.
Outdoor 3D LED Screen Segmentation
-
1. Application
- 1.1. Commercial Buildings
- 1.2. Public Infrastructure
-
2. Types
- 2.1. Right Angle Splicing
- 2.2. Obtuse Angle Splicing
Outdoor 3D LED Screen Segmentation By Geography
-
1. North America
- 1.1. United States
- 1.2. Canada
- 1.3. Mexico
-
2. South America
- 2.1. Brazil
- 2.2. Argentina
- 2.3. Rest of South America
-
3. Europe
- 3.1. United Kingdom
- 3.2. Germany
- 3.3. France
- 3.4. Italy
- 3.5. Spain
- 3.6. Russia
- 3.7. Benelux
- 3.8. Nordics
- 3.9. Rest of Europe
-
4. Middle East & Africa
- 4.1. Turkey
- 4.2. Israel
- 4.3. GCC
- 4.4. North Africa
- 4.5. South Africa
- 4.6. Rest of Middle East & Africa
-
5. Asia Pacific
- 5.1. China
- 5.2. India
- 5.3. Japan
- 5.4. South Korea
- 5.5. ASEAN
- 5.6. Oceania
- 5.7. Rest of Asia Pacific
Outdoor 3D LED Screen Regional Market Share
Geographic Coverage of Outdoor 3D LED Screen
Outdoor 3D LED Screen REPORT HIGHLIGHTS
| Aspects | Details |
|---|---|
| Study Period | 2020-2034 |
| Base Year | 2025 |
| Estimated Year | 2026 |
| Forecast Period | 2026-2034 |
| Historical Period | 2020-2025 |
| Growth Rate | CAGR of 9.8% from 2020-2034 |
| Segmentation |
|
Table of Contents
- 1. Introduction
- 1.1. Research Scope
- 1.2. Market Segmentation
- 1.3. Research Objective
- 1.4. Definitions and Assumptions
- 2. Executive Summary
- 2.1. Market Snapshot
- 3. Market Dynamics
- 3.1. Market Drivers
- 3.2. Market Restrains
- 3.3. Market Trends
- 3.4. Market Opportunities
- 4. Market Factor Analysis
- 4.1. Porters Five Forces
- 4.1.1. Bargaining Power of Suppliers
- 4.1.2. Bargaining Power of Buyers
- 4.1.3. Threat of New Entrants
- 4.1.4. Threat of Substitutes
- 4.1.5. Competitive Rivalry
- 4.2. PESTEL analysis
- 4.3. BCG Analysis
- 4.3.1. Stars (High Growth, High Market Share)
- 4.3.2. Cash Cows (Low Growth, High Market Share)
- 4.3.3. Question Mark (High Growth, Low Market Share)
- 4.3.4. Dogs (Low Growth, Low Market Share)
- 4.4. Ansoff Matrix Analysis
- 4.5. Supply Chain Analysis
- 4.6. Regulatory Landscape
- 4.7. Current Market Potential and Opportunity Assessment (TAM–SAM–SOM Framework)
- 4.8. TIR Analyst Note
- 4.1. Porters Five Forces
- 5. Market Analysis, Insights and Forecast 2021-2033
- 5.1. Market Analysis, Insights and Forecast - by Application
- 5.1.1. Commercial Buildings
- 5.1.2. Public Infrastructure
- 5.2. Market Analysis, Insights and Forecast - by Types
- 5.2.1. Right Angle Splicing
- 5.2.2. Obtuse Angle Splicing
- 5.3. Market Analysis, Insights and Forecast - by Region
- 5.3.1. North America
- 5.3.2. South America
- 5.3.3. Europe
- 5.3.4. Middle East & Africa
- 5.3.5. Asia Pacific
- 5.1. Market Analysis, Insights and Forecast - by Application
- 6. Global Outdoor 3D LED Screen Analysis, Insights and Forecast, 2021-2033
- 6.1. Market Analysis, Insights and Forecast - by Application
- 6.1.1. Commercial Buildings
- 6.1.2. Public Infrastructure
- 6.2. Market Analysis, Insights and Forecast - by Types
- 6.2.1. Right Angle Splicing
- 6.2.2. Obtuse Angle Splicing
- 6.1. Market Analysis, Insights and Forecast - by Application
- 7. North America Outdoor 3D LED Screen Analysis, Insights and Forecast, 2020-2032
- 7.1. Market Analysis, Insights and Forecast - by Application
- 7.1.1. Commercial Buildings
- 7.1.2. Public Infrastructure
- 7.2. Market Analysis, Insights and Forecast - by Types
- 7.2.1. Right Angle Splicing
- 7.2.2. Obtuse Angle Splicing
- 7.1. Market Analysis, Insights and Forecast - by Application
- 8. South America Outdoor 3D LED Screen Analysis, Insights and Forecast, 2020-2032
- 8.1. Market Analysis, Insights and Forecast - by Application
- 8.1.1. Commercial Buildings
- 8.1.2. Public Infrastructure
- 8.2. Market Analysis, Insights and Forecast - by Types
- 8.2.1. Right Angle Splicing
- 8.2.2. Obtuse Angle Splicing
- 8.1. Market Analysis, Insights and Forecast - by Application
- 9. Europe Outdoor 3D LED Screen Analysis, Insights and Forecast, 2020-2032
- 9.1. Market Analysis, Insights and Forecast - by Application
- 9.1.1. Commercial Buildings
- 9.1.2. Public Infrastructure
- 9.2. Market Analysis, Insights and Forecast - by Types
- 9.2.1. Right Angle Splicing
- 9.2.2. Obtuse Angle Splicing
- 9.1. Market Analysis, Insights and Forecast - by Application
- 10. Middle East & Africa Outdoor 3D LED Screen Analysis, Insights and Forecast, 2020-2032
- 10.1. Market Analysis, Insights and Forecast - by Application
- 10.1.1. Commercial Buildings
- 10.1.2. Public Infrastructure
- 10.2. Market Analysis, Insights and Forecast - by Types
- 10.2.1. Right Angle Splicing
- 10.2.2. Obtuse Angle Splicing
- 10.1. Market Analysis, Insights and Forecast - by Application
- 11. Asia Pacific Outdoor 3D LED Screen Analysis, Insights and Forecast, 2020-2032
- 11.1. Market Analysis, Insights and Forecast - by Application
- 11.1.1. Commercial Buildings
- 11.1.2. Public Infrastructure
- 11.2. Market Analysis, Insights and Forecast - by Types
- 11.2.1. Right Angle Splicing
- 11.2.2. Obtuse Angle Splicing
- 11.1. Market Analysis, Insights and Forecast - by Application
- 12. Competitive Analysis
- 12.1. Company Profiles
- 12.1.1 Leyard
- 12.1.1.1. Company Overview
- 12.1.1.2. Products
- 12.1.1.3. Company Financials
- 12.1.1.4. SWOT Analysis
- 12.1.2 Samsung Electronics
- 12.1.2.1. Company Overview
- 12.1.2.2. Products
- 12.1.2.3. Company Financials
- 12.1.2.4. SWOT Analysis
- 12.1.3 Barco
- 12.1.3.1. Company Overview
- 12.1.3.2. Products
- 12.1.3.3. Company Financials
- 12.1.3.4. SWOT Analysis
- 12.1.4 LG Electronics
- 12.1.4.1. Company Overview
- 12.1.4.2. Products
- 12.1.4.3. Company Financials
- 12.1.4.4. SWOT Analysis
- 12.1.5 Sony
- 12.1.5.1. Company Overview
- 12.1.5.2. Products
- 12.1.5.3. Company Financials
- 12.1.5.4. SWOT Analysis
- 12.1.6 Maxtop Technology Industrial
- 12.1.6.1. Company Overview
- 12.1.6.2. Products
- 12.1.6.3. Company Financials
- 12.1.6.4. SWOT Analysis
- 12.1.7 YuChip
- 12.1.7.1. Company Overview
- 12.1.7.2. Products
- 12.1.7.3. Company Financials
- 12.1.7.4. SWOT Analysis
- 12.1.8 LianTronics
- 12.1.8.1. Company Overview
- 12.1.8.2. Products
- 12.1.8.3. Company Financials
- 12.1.8.4. SWOT Analysis
- 12.1.9 Ledcoms
- 12.1.9.1. Company Overview
- 12.1.9.2. Products
- 12.1.9.3. Company Financials
- 12.1.9.4. SWOT Analysis
- 12.1.10 JYLED
- 12.1.10.1. Company Overview
- 12.1.10.2. Products
- 12.1.10.3. Company Financials
- 12.1.10.4. SWOT Analysis
- 12.1.11 Maxcolor Visual
- 12.1.11.1. Company Overview
- 12.1.11.2. Products
- 12.1.11.3. Company Financials
- 12.1.11.4. SWOT Analysis
- 12.1.12 LUXMAGE
- 12.1.12.1. Company Overview
- 12.1.12.2. Products
- 12.1.12.3. Company Financials
- 12.1.12.4. SWOT Analysis
- 12.1.1 Leyard
- 12.2. Market Entropy
- 12.2.1 Company's Key Areas Served
- 12.2.2 Recent Developments
- 12.3. Company Market Share Analysis 2025
- 12.3.1 Top 5 Companies Market Share Analysis
- 12.3.2 Top 3 Companies Market Share Analysis
- 12.4. List of Potential Customers
- 13. Research Methodology
List of Figures
- Figure 1: Global Outdoor 3D LED Screen Revenue Breakdown (billion, %) by Region 2025 & 2033
- Figure 2: Global Outdoor 3D LED Screen Volume Breakdown (K, %) by Region 2025 & 2033
- Figure 3: North America Outdoor 3D LED Screen Revenue (billion), by Application 2025 & 2033
- Figure 4: North America Outdoor 3D LED Screen Volume (K), by Application 2025 & 2033
- Figure 5: North America Outdoor 3D LED Screen Revenue Share (%), by Application 2025 & 2033
- Figure 6: North America Outdoor 3D LED Screen Volume Share (%), by Application 2025 & 2033
- Figure 7: North America Outdoor 3D LED Screen Revenue (billion), by Types 2025 & 2033
- Figure 8: North America Outdoor 3D LED Screen Volume (K), by Types 2025 & 2033
- Figure 9: North America Outdoor 3D LED Screen Revenue Share (%), by Types 2025 & 2033
- Figure 10: North America Outdoor 3D LED Screen Volume Share (%), by Types 2025 & 2033
- Figure 11: North America Outdoor 3D LED Screen Revenue (billion), by Country 2025 & 2033
- Figure 12: North America Outdoor 3D LED Screen Volume (K), by Country 2025 & 2033
- Figure 13: North America Outdoor 3D LED Screen Revenue Share (%), by Country 2025 & 2033
- Figure 14: North America Outdoor 3D LED Screen Volume Share (%), by Country 2025 & 2033
- Figure 15: South America Outdoor 3D LED Screen Revenue (billion), by Application 2025 & 2033
- Figure 16: South America Outdoor 3D LED Screen Volume (K), by Application 2025 & 2033
- Figure 17: South America Outdoor 3D LED Screen Revenue Share (%), by Application 2025 & 2033
- Figure 18: South America Outdoor 3D LED Screen Volume Share (%), by Application 2025 & 2033
- Figure 19: South America Outdoor 3D LED Screen Revenue (billion), by Types 2025 & 2033
- Figure 20: South America Outdoor 3D LED Screen Volume (K), by Types 2025 & 2033
- Figure 21: South America Outdoor 3D LED Screen Revenue Share (%), by Types 2025 & 2033
- Figure 22: South America Outdoor 3D LED Screen Volume Share (%), by Types 2025 & 2033
- Figure 23: South America Outdoor 3D LED Screen Revenue (billion), by Country 2025 & 2033
- Figure 24: South America Outdoor 3D LED Screen Volume (K), by Country 2025 & 2033
- Figure 25: South America Outdoor 3D LED Screen Revenue Share (%), by Country 2025 & 2033
- Figure 26: South America Outdoor 3D LED Screen Volume Share (%), by Country 2025 & 2033
- Figure 27: Europe Outdoor 3D LED Screen Revenue (billion), by Application 2025 & 2033
- Figure 28: Europe Outdoor 3D LED Screen Volume (K), by Application 2025 & 2033
- Figure 29: Europe Outdoor 3D LED Screen Revenue Share (%), by Application 2025 & 2033
- Figure 30: Europe Outdoor 3D LED Screen Volume Share (%), by Application 2025 & 2033
- Figure 31: Europe Outdoor 3D LED Screen Revenue (billion), by Types 2025 & 2033
- Figure 32: Europe Outdoor 3D LED Screen Volume (K), by Types 2025 & 2033
- Figure 33: Europe Outdoor 3D LED Screen Revenue Share (%), by Types 2025 & 2033
- Figure 34: Europe Outdoor 3D LED Screen Volume Share (%), by Types 2025 & 2033
- Figure 35: Europe Outdoor 3D LED Screen Revenue (billion), by Country 2025 & 2033
- Figure 36: Europe Outdoor 3D LED Screen Volume (K), by Country 2025 & 2033
- Figure 37: Europe Outdoor 3D LED Screen Revenue Share (%), by Country 2025 & 2033
- Figure 38: Europe Outdoor 3D LED Screen Volume Share (%), by Country 2025 & 2033
- Figure 39: Middle East & Africa Outdoor 3D LED Screen Revenue (billion), by Application 2025 & 2033
- Figure 40: Middle East & Africa Outdoor 3D LED Screen Volume (K), by Application 2025 & 2033
- Figure 41: Middle East & Africa Outdoor 3D LED Screen Revenue Share (%), by Application 2025 & 2033
- Figure 42: Middle East & Africa Outdoor 3D LED Screen Volume Share (%), by Application 2025 & 2033
- Figure 43: Middle East & Africa Outdoor 3D LED Screen Revenue (billion), by Types 2025 & 2033
- Figure 44: Middle East & Africa Outdoor 3D LED Screen Volume (K), by Types 2025 & 2033
- Figure 45: Middle East & Africa Outdoor 3D LED Screen Revenue Share (%), by Types 2025 & 2033
- Figure 46: Middle East & Africa Outdoor 3D LED Screen Volume Share (%), by Types 2025 & 2033
- Figure 47: Middle East & Africa Outdoor 3D LED Screen Revenue (billion), by Country 2025 & 2033
- Figure 48: Middle East & Africa Outdoor 3D LED Screen Volume (K), by Country 2025 & 2033
- Figure 49: Middle East & Africa Outdoor 3D LED Screen Revenue Share (%), by Country 2025 & 2033
- Figure 50: Middle East & Africa Outdoor 3D LED Screen Volume Share (%), by Country 2025 & 2033
- Figure 51: Asia Pacific Outdoor 3D LED Screen Revenue (billion), by Application 2025 & 2033
- Figure 52: Asia Pacific Outdoor 3D LED Screen Volume (K), by Application 2025 & 2033
- Figure 53: Asia Pacific Outdoor 3D LED Screen Revenue Share (%), by Application 2025 & 2033
- Figure 54: Asia Pacific Outdoor 3D LED Screen Volume Share (%), by Application 2025 & 2033
- Figure 55: Asia Pacific Outdoor 3D LED Screen Revenue (billion), by Types 2025 & 2033
- Figure 56: Asia Pacific Outdoor 3D LED Screen Volume (K), by Types 2025 & 2033
- Figure 57: Asia Pacific Outdoor 3D LED Screen Revenue Share (%), by Types 2025 & 2033
- Figure 58: Asia Pacific Outdoor 3D LED Screen Volume Share (%), by Types 2025 & 2033
- Figure 59: Asia Pacific Outdoor 3D LED Screen Revenue (billion), by Country 2025 & 2033
- Figure 60: Asia Pacific Outdoor 3D LED Screen Volume (K), by Country 2025 & 2033
- Figure 61: Asia Pacific Outdoor 3D LED Screen Revenue Share (%), by Country 2025 & 2033
- Figure 62: Asia Pacific Outdoor 3D LED Screen Volume Share (%), by Country 2025 & 2033
List of Tables
- Table 1: Global Outdoor 3D LED Screen Revenue billion Forecast, by Application 2020 & 2033
- Table 2: Global Outdoor 3D LED Screen Volume K Forecast, by Application 2020 & 2033
- Table 3: Global Outdoor 3D LED Screen Revenue billion Forecast, by Types 2020 & 2033
- Table 4: Global Outdoor 3D LED Screen Volume K Forecast, by Types 2020 & 2033
- Table 5: Global Outdoor 3D LED Screen Revenue billion Forecast, by Region 2020 & 2033
- Table 6: Global Outdoor 3D LED Screen Volume K Forecast, by Region 2020 & 2033
- Table 7: Global Outdoor 3D LED Screen Revenue billion Forecast, by Application 2020 & 2033
- Table 8: Global Outdoor 3D LED Screen Volume K Forecast, by Application 2020 & 2033
- Table 9: Global Outdoor 3D LED Screen Revenue billion Forecast, by Types 2020 & 2033
- Table 10: Global Outdoor 3D LED Screen Volume K Forecast, by Types 2020 & 2033
- Table 11: Global Outdoor 3D LED Screen Revenue billion Forecast, by Country 2020 & 2033
- Table 12: Global Outdoor 3D LED Screen Volume K Forecast, by Country 2020 & 2033
- Table 13: United States Outdoor 3D LED Screen Revenue (billion) Forecast, by Application 2020 & 2033
- Table 14: United States Outdoor 3D LED Screen Volume (K) Forecast, by Application 2020 & 2033
- Table 15: Canada Outdoor 3D LED Screen Revenue (billion) Forecast, by Application 2020 & 2033
- Table 16: Canada Outdoor 3D LED Screen Volume (K) Forecast, by Application 2020 & 2033
- Table 17: Mexico Outdoor 3D LED Screen Revenue (billion) Forecast, by Application 2020 & 2033
- Table 18: Mexico Outdoor 3D LED Screen Volume (K) Forecast, by Application 2020 & 2033
- Table 19: Global Outdoor 3D LED Screen Revenue billion Forecast, by Application 2020 & 2033
- Table 20: Global Outdoor 3D LED Screen Volume K Forecast, by Application 2020 & 2033
- Table 21: Global Outdoor 3D LED Screen Revenue billion Forecast, by Types 2020 & 2033
- Table 22: Global Outdoor 3D LED Screen Volume K Forecast, by Types 2020 & 2033
- Table 23: Global Outdoor 3D LED Screen Revenue billion Forecast, by Country 2020 & 2033
- Table 24: Global Outdoor 3D LED Screen Volume K Forecast, by Country 2020 & 2033
- Table 25: Brazil Outdoor 3D LED Screen Revenue (billion) Forecast, by Application 2020 & 2033
- Table 26: Brazil Outdoor 3D LED Screen Volume (K) Forecast, by Application 2020 & 2033
- Table 27: Argentina Outdoor 3D LED Screen Revenue (billion) Forecast, by Application 2020 & 2033
- Table 28: Argentina Outdoor 3D LED Screen Volume (K) Forecast, by Application 2020 & 2033
- Table 29: Rest of South America Outdoor 3D LED Screen Revenue (billion) Forecast, by Application 2020 & 2033
- Table 30: Rest of South America Outdoor 3D LED Screen Volume (K) Forecast, by Application 2020 & 2033
- Table 31: Global Outdoor 3D LED Screen Revenue billion Forecast, by Application 2020 & 2033
- Table 32: Global Outdoor 3D LED Screen Volume K Forecast, by Application 2020 & 2033
- Table 33: Global Outdoor 3D LED Screen Revenue billion Forecast, by Types 2020 & 2033
- Table 34: Global Outdoor 3D LED Screen Volume K Forecast, by Types 2020 & 2033
- Table 35: Global Outdoor 3D LED Screen Revenue billion Forecast, by Country 2020 & 2033
- Table 36: Global Outdoor 3D LED Screen Volume K Forecast, by Country 2020 & 2033
- Table 37: United Kingdom Outdoor 3D LED Screen Revenue (billion) Forecast, by Application 2020 & 2033
- Table 38: United Kingdom Outdoor 3D LED Screen Volume (K) Forecast, by Application 2020 & 2033
- Table 39: Germany Outdoor 3D LED Screen Revenue (billion) Forecast, by Application 2020 & 2033
- Table 40: Germany Outdoor 3D LED Screen Volume (K) Forecast, by Application 2020 & 2033
- Table 41: France Outdoor 3D LED Screen Revenue (billion) Forecast, by Application 2020 & 2033
- Table 42: France Outdoor 3D LED Screen Volume (K) Forecast, by Application 2020 & 2033
- Table 43: Italy Outdoor 3D LED Screen Revenue (billion) Forecast, by Application 2020 & 2033
- Table 44: Italy Outdoor 3D LED Screen Volume (K) Forecast, by Application 2020 & 2033
- Table 45: Spain Outdoor 3D LED Screen Revenue (billion) Forecast, by Application 2020 & 2033
- Table 46: Spain Outdoor 3D LED Screen Volume (K) Forecast, by Application 2020 & 2033
- Table 47: Russia Outdoor 3D LED Screen Revenue (billion) Forecast, by Application 2020 & 2033
- Table 48: Russia Outdoor 3D LED Screen Volume (K) Forecast, by Application 2020 & 2033
- Table 49: Benelux Outdoor 3D LED Screen Revenue (billion) Forecast, by Application 2020 & 2033
- Table 50: Benelux Outdoor 3D LED Screen Volume (K) Forecast, by Application 2020 & 2033
- Table 51: Nordics Outdoor 3D LED Screen Revenue (billion) Forecast, by Application 2020 & 2033
- Table 52: Nordics Outdoor 3D LED Screen Volume (K) Forecast, by Application 2020 & 2033
- Table 53: Rest of Europe Outdoor 3D LED Screen Revenue (billion) Forecast, by Application 2020 & 2033
- Table 54: Rest of Europe Outdoor 3D LED Screen Volume (K) Forecast, by Application 2020 & 2033
- Table 55: Global Outdoor 3D LED Screen Revenue billion Forecast, by Application 2020 & 2033
- Table 56: Global Outdoor 3D LED Screen Volume K Forecast, by Application 2020 & 2033
- Table 57: Global Outdoor 3D LED Screen Revenue billion Forecast, by Types 2020 & 2033
- Table 58: Global Outdoor 3D LED Screen Volume K Forecast, by Types 2020 & 2033
- Table 59: Global Outdoor 3D LED Screen Revenue billion Forecast, by Country 2020 & 2033
- Table 60: Global Outdoor 3D LED Screen Volume K Forecast, by Country 2020 & 2033
- Table 61: Turkey Outdoor 3D LED Screen Revenue (billion) Forecast, by Application 2020 & 2033
- Table 62: Turkey Outdoor 3D LED Screen Volume (K) Forecast, by Application 2020 & 2033
- Table 63: Israel Outdoor 3D LED Screen Revenue (billion) Forecast, by Application 2020 & 2033
- Table 64: Israel Outdoor 3D LED Screen Volume (K) Forecast, by Application 2020 & 2033
- Table 65: GCC Outdoor 3D LED Screen Revenue (billion) Forecast, by Application 2020 & 2033
- Table 66: GCC Outdoor 3D LED Screen Volume (K) Forecast, by Application 2020 & 2033
- Table 67: North Africa Outdoor 3D LED Screen Revenue (billion) Forecast, by Application 2020 & 2033
- Table 68: North Africa Outdoor 3D LED Screen Volume (K) Forecast, by Application 2020 & 2033
- Table 69: South Africa Outdoor 3D LED Screen Revenue (billion) Forecast, by Application 2020 & 2033
- Table 70: South Africa Outdoor 3D LED Screen Volume (K) Forecast, by Application 2020 & 2033
- Table 71: Rest of Middle East & Africa Outdoor 3D LED Screen Revenue (billion) Forecast, by Application 2020 & 2033
- Table 72: Rest of Middle East & Africa Outdoor 3D LED Screen Volume (K) Forecast, by Application 2020 & 2033
- Table 73: Global Outdoor 3D LED Screen Revenue billion Forecast, by Application 2020 & 2033
- Table 74: Global Outdoor 3D LED Screen Volume K Forecast, by Application 2020 & 2033
- Table 75: Global Outdoor 3D LED Screen Revenue billion Forecast, by Types 2020 & 2033
- Table 76: Global Outdoor 3D LED Screen Volume K Forecast, by Types 2020 & 2033
- Table 77: Global Outdoor 3D LED Screen Revenue billion Forecast, by Country 2020 & 2033
- Table 78: Global Outdoor 3D LED Screen Volume K Forecast, by Country 2020 & 2033
- Table 79: China Outdoor 3D LED Screen Revenue (billion) Forecast, by Application 2020 & 2033
- Table 80: China Outdoor 3D LED Screen Volume (K) Forecast, by Application 2020 & 2033
- Table 81: India Outdoor 3D LED Screen Revenue (billion) Forecast, by Application 2020 & 2033
- Table 82: India Outdoor 3D LED Screen Volume (K) Forecast, by Application 2020 & 2033
- Table 83: Japan Outdoor 3D LED Screen Revenue (billion) Forecast, by Application 2020 & 2033
- Table 84: Japan Outdoor 3D LED Screen Volume (K) Forecast, by Application 2020 & 2033
- Table 85: South Korea Outdoor 3D LED Screen Revenue (billion) Forecast, by Application 2020 & 2033
- Table 86: South Korea Outdoor 3D LED Screen Volume (K) Forecast, by Application 2020 & 2033
- Table 87: ASEAN Outdoor 3D LED Screen Revenue (billion) Forecast, by Application 2020 & 2033
- Table 88: ASEAN Outdoor 3D LED Screen Volume (K) Forecast, by Application 2020 & 2033
- Table 89: Oceania Outdoor 3D LED Screen Revenue (billion) Forecast, by Application 2020 & 2033
- Table 90: Oceania Outdoor 3D LED Screen Volume (K) Forecast, by Application 2020 & 2033
- Table 91: Rest of Asia Pacific Outdoor 3D LED Screen Revenue (billion) Forecast, by Application 2020 & 2033
- Table 92: Rest of Asia Pacific Outdoor 3D LED Screen Volume (K) Forecast, by Application 2020 & 2033
Frequently Asked Questions
1. What is the projected Compound Annual Growth Rate (CAGR) of the Outdoor 3D LED Screen?
The projected CAGR is approximately 9.8%.
2. Which companies are prominent players in the Outdoor 3D LED Screen?
Key companies in the market include Leyard, Samsung Electronics, Barco, LG Electronics, Sony, Maxtop Technology Industrial, YuChip, LianTronics, Ledcoms, JYLED, Maxcolor Visual, LUXMAGE.
3. What are the main segments of the Outdoor 3D LED Screen?
The market segments include Application, Types.
4. Can you provide details about the market size?
The market size is estimated to be USD 10.9 billion as of 2022.
5. What are some drivers contributing to market growth?
N/A
6. What are the notable trends driving market growth?
N/A
7. Are there any restraints impacting market growth?
N/A
8. Can you provide examples of recent developments in the market?
N/A
9. What pricing options are available for accessing the report?
Pricing options include single-user, multi-user, and enterprise licenses priced at USD 3350.00, USD 5025.00, and USD 6700.00 respectively.
10. Is the market size provided in terms of value or volume?
The market size is provided in terms of value, measured in billion and volume, measured in K.
11. Are there any specific market keywords associated with the report?
Yes, the market keyword associated with the report is "Outdoor 3D LED Screen," which aids in identifying and referencing the specific market segment covered.
12. How do I determine which pricing option suits my needs best?
The pricing options vary based on user requirements and access needs. Individual users may opt for single-user licenses, while businesses requiring broader access may choose multi-user or enterprise licenses for cost-effective access to the report.
13. Are there any additional resources or data provided in the Outdoor 3D LED Screen report?
While the report offers comprehensive insights, it's advisable to review the specific contents or supplementary materials provided to ascertain if additional resources or data are available.
14. How can I stay updated on further developments or reports in the Outdoor 3D LED Screen?
To stay informed about further developments, trends, and reports in the Outdoor 3D LED Screen, consider subscribing to industry newsletters, following relevant companies and organizations, or regularly checking reputable industry news sources and publications.
Methodology
Step 1 - Identification of Relevant Samples Size from Population Database


Step 2 - Approaches for Defining Global Market Size (Value, Volume* & Price*)

Note*: In applicable scenarios
Step 3 - Data Sources
Primary Research
- Web Analytics
- Survey Reports
- Research Institute
- Latest Research Reports
- Opinion Leaders
Secondary Research
- Annual Reports
- White Paper
- Latest Press Release
- Industry Association
- Paid Database
- Investor Presentations

Step 4 - Data Triangulation
Involves using different sources of information in order to increase the validity of a study
These sources are likely to be stakeholders in a program - participants, other researchers, program staff, other community members, and so on.
Then we put all data in single framework & apply various statistical tools to find out the dynamic on the market.
During the analysis stage, feedback from the stakeholder groups would be compared to determine areas of agreement as well as areas of divergence