

Key Insights
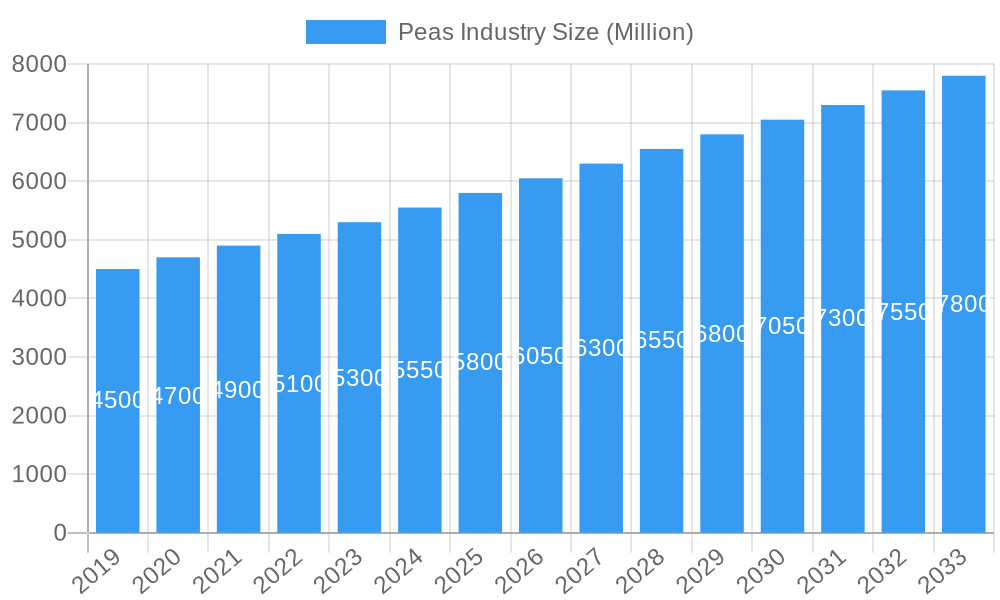
The global Peas Industry is poised for significant expansion, projected to reach a market size of approximately $5,800 million by 2025, exhibiting a robust Compound Annual Growth Rate (CAGR) of 4.30%. This growth is primarily fueled by increasing consumer demand for plant-based proteins and the escalating awareness of peas' nutritional benefits. The versatile nature of peas, which extends beyond traditional food applications to include animal feed and industrial uses, further bolsters market momentum. Key drivers include a growing vegan and vegetarian population, the rising popularity of healthy eating trends, and advancements in pea processing technologies that enhance their functionality and appeal. Emerging markets, particularly in Asia Pacific, are expected to contribute substantially to this growth, driven by a burgeoning middle class with increased disposable income and a greater emphasis on dietary diversification. The industry is also witnessing a significant trend towards innovation in pea-derived ingredients, such as pea protein isolates and starches, catering to the expanding needs of the food and beverage sector.
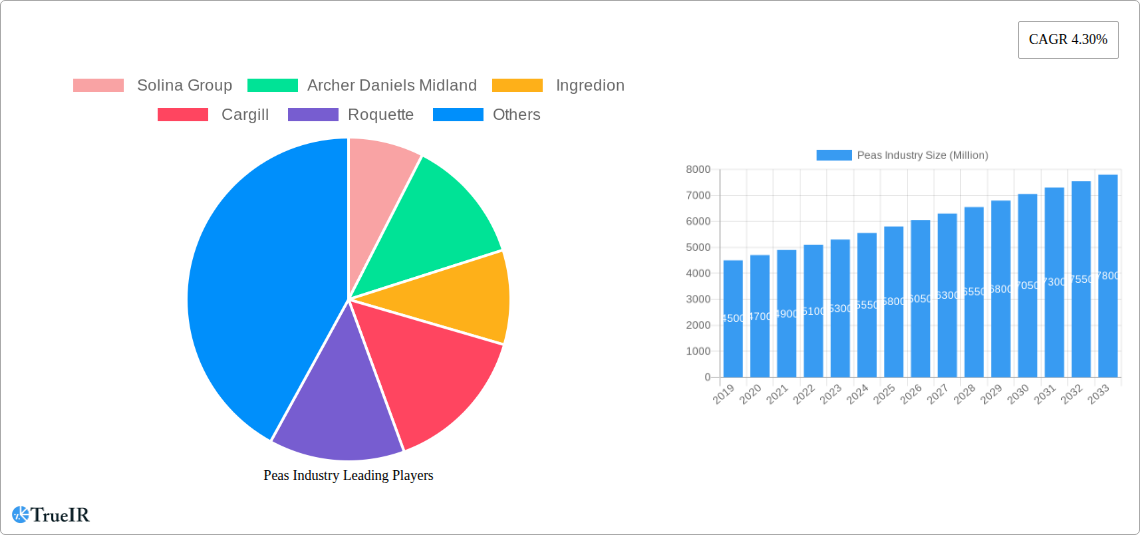
Peas Industry Market Size (In Billion)
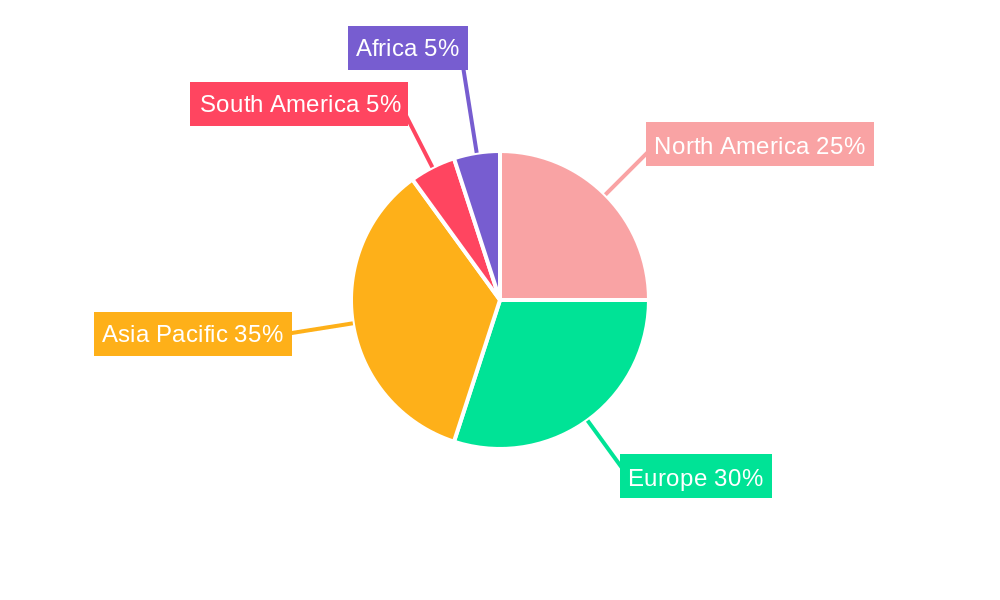
Despite the strong growth trajectory, the Peas Industry faces certain restraints that warrant careful consideration. Fluctuations in raw material prices, driven by factors like weather conditions and agricultural policies, can impact profitability. Additionally, intense competition among established players and new entrants could exert downward pressure on pricing. However, these challenges are being effectively managed through strategic investments in research and development, supply chain optimization, and the exploration of new applications for pea-based products. The market is segmented across production, consumption, import/export, and price trends, each offering unique insights into market dynamics. Major companies like Solina Group, Archer Daniels Midland, Ingredion, Cargill, and Roquette are actively shaping the market through mergers, acquisitions, and product development. Geographically, North America, Europe, Asia Pacific, South America, and Africa all present distinct market opportunities and challenges, with Asia Pacific and Europe expected to be key growth regions in the coming years.
Peas Industry Company Market Share
Unlock comprehensive insights into the burgeoning global peas market with this in-depth industry report. Covering production, consumption, trade, pricing, and key developments from 2019 to 2033, this analysis empowers stakeholders with critical data and strategic foresight. Our report leverages high-volume SEO keywords to enhance search visibility and attract industry professionals seeking actionable intelligence on pea protein, pulse markets, agricultural innovations, and plant-based food trends.
The global peas market is witnessing robust growth, driven by increasing demand for plant-based proteins, nutritional benefits of pulses, and sustainable agriculture practices. This report provides a detailed examination of market dynamics, including production and consumption analysis, import and export trends, price fluctuations, and significant industry developments. With a study period spanning from 2019 to 2033, a base year of 2025, and a forecast period extending to 2033, this comprehensive analysis offers unparalleled insights for industry players, investors, and policymakers.
Peas Industry Market Structure & Competitive Landscape
The global peas industry exhibits a moderately concentrated market structure, with key players like Solina Group, Archer Daniels Midland, Ingredion, Cargill, and Roquette dominating significant market shares. Innovation drivers are primarily focused on enhancing pea protein extraction efficiency, developing new pulse-based food ingredients, and improving crop yields through advanced agricultural techniques. Regulatory impacts are evident in food labeling laws, import/export tariffs, and food safety standards, shaping market accessibility and product formulations. Product substitutes, such as soy protein, whey protein, and other plant-based proteins, present a competitive challenge, necessitating continuous product differentiation and value proposition enhancement. End-user segmentation reveals a strong demand from the food and beverage sector, animal feed, and the burgeoning nutraceutical industry. Mergers and acquisitions (M&A) trends are observed as larger corporations seek to consolidate their market position, expand their product portfolios, and gain access to new technologies and markets. For instance, the acquisition of smaller ingredient processors by major food companies aims to secure supply chains and broaden their offerings in the plant-based protein space. The market concentration ratio for the top five players is estimated to be around 60-70%, indicating significant influence of these entities. M&A volumes have seen a steady increase, particularly in the last five years, with an estimated value of over $500 Million annually in acquisitions related to plant-based ingredients and processing.
Peas Industry Market Trends & Opportunities
The global peas market is poised for substantial growth, projected to expand at a Compound Annual Growth Rate (CAGR) of approximately 6.5% from the estimated year of 2025 through to 2033. This expansion is fueled by a confluence of evolving consumer preferences, technological advancements, and increasing awareness of the health and environmental benefits associated with pea-based products. Consumer demand for plant-based diets, veganism, and flexitarianism is a paramount trend, driving the consumption of pea protein as a versatile and sustainable alternative to animal-derived proteins. The nutritional profile of peas, rich in protein, fiber, and essential amino acids, further solidifies their appeal in health-conscious markets. Technologically, significant shifts are occurring in pea protein processing, with innovations in isolation and texturization techniques leading to improved functionality, taste, and texture, making pea ingredients more adaptable for a wider range of food applications. This includes the development of high-purity pea isolates and concentrates with superior emulsifying and gelling properties. Market penetration rates for pea protein in the global protein market are estimated to have reached over 10% in 2024 and are projected to exceed 15% by 2030. Opportunities abound in the development of novel pea-based food and beverage products, including dairy alternatives, meat substitutes, protein bars, and functional foods. The growing demand for clean label products also favors pea ingredients, which are often perceived as natural and minimally processed. Furthermore, advancements in agricultural practices and breeding programs are contributing to higher yields and improved quality of peas, thereby ensuring a stable and cost-effective supply. The Asia-Pacific region, particularly China and India, represents a significant growth opportunity due to its large population and increasing adoption of plant-based diets.
Dominant Markets & Segments in Peas Industry
The Production Analysis of the peas industry is significantly dominated by North America and Europe, with Canada and European Union member states being major contributors to global pea cultivation. Key growth drivers in these regions include advanced agricultural technologies, supportive government policies for pulse production, and significant domestic demand. North America, with an estimated production volume of over 15 Million metric tons annually, benefits from vast arable land and efficient farming practices. Consumption Analysis reveals a strong upward trend in North America and Europe, driven by the rising popularity of plant-based diets and the expanding use of pea protein in food and feed applications. The Import Market Analysis (Value & Volume) sees Europe as a leading importer, particularly for processed pea ingredients like pea protein isolate and concentrate, with an estimated import value of over $1 Billion annually. Factors contributing to this include a higher demand-supply gap and a strong focus on product innovation in the region. The Export Market Analysis (Value & Volume) is led by Canada, which exports a substantial volume of peas globally, estimated at over 10 Million metric tons annually, primarily to Europe and Asia. The quality of Canadian peas and its established trade relationships are key drivers. Price Trend Analysis indicates a steady increase in pea prices over the historical period (2019-2024), with an estimated average annual increase of 3-5%, influenced by global demand, crop yields, and geopolitical factors. For the forecast period (2025-2033), prices are expected to remain volatile but generally on an upward trajectory, driven by sustained demand for pea protein and potential supply chain disruptions.
Peas Industry Product Analysis
Product innovation in the peas industry is heavily focused on enhancing the functional properties and expanding the application scope of pea-derived ingredients. Key advancements include the development of high-purity pea protein isolates (over 90% protein content) and concentrates (over 70% protein content) with improved solubility, emulsification, and gelling capabilities. Texturized pea proteins are gaining traction as effective meat analogues, offering a fibrous and chewy texture. Furthermore, ongoing research is exploring novel applications for pea starch and fiber in the food industry, as well as in the pharmaceutical and cosmetic sectors. Competitive advantages are derived from the sustainable sourcing, allergen-free profile (compared to soy or dairy), and nutritional richness of pea ingredients.
Key Drivers, Barriers & Challenges in Peas Industry
The peas industry is propelled by several key drivers, including the escalating global demand for plant-based proteins driven by health and environmental consciousness, advancements in processing technologies enhancing the functionality and appeal of pea ingredients, and supportive government initiatives promoting pulse cultivation and plant-based food production. Technological innovations in pea protein extraction and texturization are crucial enablers.
Conversely, the industry faces significant barriers and challenges. Supply chain volatilities, including fluctuating crop yields due to climate change and geopolitical instability, can impact raw material availability and price. Stringent regulatory requirements for food safety and novel food ingredients in different regions can slow down market entry and product development. Competitive pressures from established protein sources and emerging alternative proteins also necessitate continuous innovation and cost optimization.
Growth Drivers in the Peas Industry Market
The primary growth drivers in the peas industry market are multifaceted. The sustained global surge in demand for plant-based protein sources, fueled by increasing health consciousness and environmental sustainability concerns, is a paramount driver. Technological advancements in pea protein extraction, isolation, and texturization processes are continuously improving product quality, functionality, and cost-effectiveness, making pea ingredients more appealing for a broader range of applications. Government policies and initiatives in several key regions promoting sustainable agriculture and the adoption of plant-based diets further bolster market expansion.
Challenges Impacting Peas Industry Growth
Challenges impacting peas industry growth include the inherent volatility in agricultural production, susceptible to adverse weather conditions, pest infestations, and geopolitical factors that can disrupt supply chains and lead to price fluctuations. Stringent and varying regulatory landscapes across different countries for food ingredients, particularly novel plant-based proteins, can pose hurdles for market entry and product approvals. Intense competition from other plant-based protein sources like soy and emerging alternative proteins also necessitates continuous innovation and competitive pricing strategies.
Key Players Shaping the Peas Industry Market
- Solina Group
- Archer Daniels Midland
- Ingredion
- Cargill
- Roquette
Significant Peas Industry Industry Milestones
- October 2022: Roquette, a global leader in plant-based ingredients and a pioneer of plant proteins, launched a new line of organic pea ingredients, organic pea starch, and organic pea protein in the North American and Europe markets to meet customer demand.
- September 2022: Pea growers will have two new options for next year's growing season, with the commercial release of PBA Noosa and PBA Taylor - Agriculture Victoria's latest high-yielding pea varieties. PBA Taylor is the best variety to grow in environments prone to virus diseases as it has resistance to two viruses - pea seed-borne mosaic virus and bean leafroll virus.
- March 2022: Birsa Agriculture University (BAU) developed a new variety Birsa Matar-1 which is adaptable to the climatic condition of Jharkhand, India. The species is also resistant to pests and diseases, which helps to increase productivity.
Future Outlook for Peas Industry Market
The future outlook for the peas industry market is exceptionally positive, characterized by sustained growth and expanding opportunities. The escalating global demand for sustainable and nutritious plant-based protein sources will continue to be the primary growth catalyst. Innovations in processing technology will unlock new applications for pea ingredients in diverse sectors, including functional foods, beverages, and even pharmaceuticals. Strategic opportunities lie in addressing emerging markets with growing middle classes and increasing adoption of healthier lifestyles. Market potential is further amplified by ongoing research into novel pea varieties with enhanced nutritional profiles and climate resilience, ensuring a stable and sustainable supply chain for years to come.
Peas Industry Segmentation
- 1. Production Analysis
- 2. Consumption Analysis
- 3. Import Market Analysis (Value & Volume)
- 4. Export Market Analysis (Value & Volume)
- 5. Price Trend Analysis
Peas Industry Segmentation By Geography
-
1. North America
- 1.1. United States
- 1.2. Canada
-
2. Europe
- 2.1. Russia
- 2.2. United Kingdom
- 2.3. France
- 2.4. Ukraine
-
3. Asia Pacific
- 3.1. China
- 3.2. Australia
- 3.3. India
-
4. South America
- 4.1. Brazil
- 4.2. Argentina
-
5. Africa
- 5.1. South Africa
- 5.2. Egypt
Peas Industry Regional Market Share
Geographic Coverage of Peas Industry
Peas Industry REPORT HIGHLIGHTS
| Aspects | Details |
|---|---|
| Study Period | 2020-2034 |
| Base Year | 2025 |
| Estimated Year | 2026 |
| Forecast Period | 2026-2034 |
| Historical Period | 2020-2025 |
| Growth Rate | CAGR of 4.30% from 2020-2034 |
| Segmentation |
|
Table of Contents
- 1. Introduction
- 1.1. Research Scope
- 1.2. Market Segmentation
- 1.3. Research Objective
- 1.4. Definitions and Assumptions
- 2. Executive Summary
- 2.1. Market Snapshot
- 3. Market Dynamics
- 3.1. Market Drivers
- 3.2. Market Restrains
- 3.3. Market Trends
- 3.4. Market Opportunities
- 4. Market Factor Analysis
- 4.1. Porters Five Forces
- 4.1.1. Bargaining Power of Suppliers
- 4.1.2. Bargaining Power of Buyers
- 4.1.3. Threat of New Entrants
- 4.1.4. Threat of Substitutes
- 4.1.5. Competitive Rivalry
- 4.2. PESTEL analysis
- 4.3. BCG Analysis
- 4.3.1. Stars (High Growth, High Market Share)
- 4.3.2. Cash Cows (Low Growth, High Market Share)
- 4.3.3. Question Mark (High Growth, Low Market Share)
- 4.3.4. Dogs (Low Growth, Low Market Share)
- 4.4. Ansoff Matrix Analysis
- 4.5. Supply Chain Analysis
- 4.6. Regulatory Landscape
- 4.7. Current Market Potential and Opportunity Assessment (TAM–SAM–SOM Framework)
- 4.8. TIR Analyst Note
- 4.1. Porters Five Forces
- 5. Market Analysis, Insights and Forecast 2021-2033
- 5.1. Market Analysis, Insights and Forecast - by Production Analysis
- 5.2. Market Analysis, Insights and Forecast - by Consumption Analysis
- 5.3. Market Analysis, Insights and Forecast - by Import Market Analysis (Value & Volume)
- 5.4. Market Analysis, Insights and Forecast - by Export Market Analysis (Value & Volume)
- 5.5. Market Analysis, Insights and Forecast - by Price Trend Analysis
- 5.6. Market Analysis, Insights and Forecast - by Region
- 5.6.1. North America
- 5.6.2. Europe
- 5.6.3. Asia Pacific
- 5.6.4. South America
- 5.6.5. Africa
- 6. Global Peas Industry Analysis, Insights and Forecast, 2021-2033
- 6.1. Market Analysis, Insights and Forecast - by Production Analysis
- 6.2. Market Analysis, Insights and Forecast - by Consumption Analysis
- 6.3. Market Analysis, Insights and Forecast - by Import Market Analysis (Value & Volume)
- 6.4. Market Analysis, Insights and Forecast - by Export Market Analysis (Value & Volume)
- 6.5. Market Analysis, Insights and Forecast - by Price Trend Analysis
- 7. North America Peas Industry Analysis, Insights and Forecast, 2020-2032
- 7.1. Market Analysis, Insights and Forecast - by Production Analysis
- 7.2. Market Analysis, Insights and Forecast - by Consumption Analysis
- 7.3. Market Analysis, Insights and Forecast - by Import Market Analysis (Value & Volume)
- 7.4. Market Analysis, Insights and Forecast - by Export Market Analysis (Value & Volume)
- 7.5. Market Analysis, Insights and Forecast - by Price Trend Analysis
- 8. Europe Peas Industry Analysis, Insights and Forecast, 2020-2032
- 8.1. Market Analysis, Insights and Forecast - by Production Analysis
- 8.2. Market Analysis, Insights and Forecast - by Consumption Analysis
- 8.3. Market Analysis, Insights and Forecast - by Import Market Analysis (Value & Volume)
- 8.4. Market Analysis, Insights and Forecast - by Export Market Analysis (Value & Volume)
- 8.5. Market Analysis, Insights and Forecast - by Price Trend Analysis
- 9. Asia Pacific Peas Industry Analysis, Insights and Forecast, 2020-2032
- 9.1. Market Analysis, Insights and Forecast - by Production Analysis
- 9.2. Market Analysis, Insights and Forecast - by Consumption Analysis
- 9.3. Market Analysis, Insights and Forecast - by Import Market Analysis (Value & Volume)
- 9.4. Market Analysis, Insights and Forecast - by Export Market Analysis (Value & Volume)
- 9.5. Market Analysis, Insights and Forecast - by Price Trend Analysis
- 10. South America Peas Industry Analysis, Insights and Forecast, 2020-2032
- 10.1. Market Analysis, Insights and Forecast - by Production Analysis
- 10.2. Market Analysis, Insights and Forecast - by Consumption Analysis
- 10.3. Market Analysis, Insights and Forecast - by Import Market Analysis (Value & Volume)
- 10.4. Market Analysis, Insights and Forecast - by Export Market Analysis (Value & Volume)
- 10.5. Market Analysis, Insights and Forecast - by Price Trend Analysis
- 11. Africa Peas Industry Analysis, Insights and Forecast, 2020-2032
- 11.1. Market Analysis, Insights and Forecast - by Production Analysis
- 11.2. Market Analysis, Insights and Forecast - by Consumption Analysis
- 11.3. Market Analysis, Insights and Forecast - by Import Market Analysis (Value & Volume)
- 11.4. Market Analysis, Insights and Forecast - by Export Market Analysis (Value & Volume)
- 11.5. Market Analysis, Insights and Forecast - by Price Trend Analysis
- 12. Competitive Analysis
- 12.1. Company Profiles
- 12.1.1 Solina Group
- 12.1.1.1. Company Overview
- 12.1.1.2. Products
- 12.1.1.3. Company Financials
- 12.1.1.4. SWOT Analysis
- 12.1.2 Archer Daniels Midland
- 12.1.2.1. Company Overview
- 12.1.2.2. Products
- 12.1.2.3. Company Financials
- 12.1.2.4. SWOT Analysis
- 12.1.3 Ingredion
- 12.1.3.1. Company Overview
- 12.1.3.2. Products
- 12.1.3.3. Company Financials
- 12.1.3.4. SWOT Analysis
- 12.1.4 Cargill
- 12.1.4.1. Company Overview
- 12.1.4.2. Products
- 12.1.4.3. Company Financials
- 12.1.4.4. SWOT Analysis
- 12.1.5 Roquette
- 12.1.5.1. Company Overview
- 12.1.5.2. Products
- 12.1.5.3. Company Financials
- 12.1.5.4. SWOT Analysis
- 12.1.1 Solina Group
- 12.2. Market Entropy
- 12.2.1 Company's Key Areas Served
- 12.2.2 Recent Developments
- 12.3. Company Market Share Analysis 2025
- 12.3.1 Top 5 Companies Market Share Analysis
- 12.3.2 Top 3 Companies Market Share Analysis
- 12.4. List of Potential Customers
- 13. Research Methodology
List of Figures
- Figure 1: Global Peas Industry Revenue Breakdown (Million, %) by Region 2025 & 2033
- Figure 2: Global Peas Industry Volume Breakdown (Kiloton, %) by Region 2025 & 2033
- Figure 3: North America Peas Industry Revenue (Million), by Production Analysis 2025 & 2033
- Figure 4: North America Peas Industry Volume (Kiloton), by Production Analysis 2025 & 2033
- Figure 5: North America Peas Industry Revenue Share (%), by Production Analysis 2025 & 2033
- Figure 6: North America Peas Industry Volume Share (%), by Production Analysis 2025 & 2033
- Figure 7: North America Peas Industry Revenue (Million), by Consumption Analysis 2025 & 2033
- Figure 8: North America Peas Industry Volume (Kiloton), by Consumption Analysis 2025 & 2033
- Figure 9: North America Peas Industry Revenue Share (%), by Consumption Analysis 2025 & 2033
- Figure 10: North America Peas Industry Volume Share (%), by Consumption Analysis 2025 & 2033
- Figure 11: North America Peas Industry Revenue (Million), by Import Market Analysis (Value & Volume) 2025 & 2033
- Figure 12: North America Peas Industry Volume (Kiloton), by Import Market Analysis (Value & Volume) 2025 & 2033
- Figure 13: North America Peas Industry Revenue Share (%), by Import Market Analysis (Value & Volume) 2025 & 2033
- Figure 14: North America Peas Industry Volume Share (%), by Import Market Analysis (Value & Volume) 2025 & 2033
- Figure 15: North America Peas Industry Revenue (Million), by Export Market Analysis (Value & Volume) 2025 & 2033
- Figure 16: North America Peas Industry Volume (Kiloton), by Export Market Analysis (Value & Volume) 2025 & 2033
- Figure 17: North America Peas Industry Revenue Share (%), by Export Market Analysis (Value & Volume) 2025 & 2033
- Figure 18: North America Peas Industry Volume Share (%), by Export Market Analysis (Value & Volume) 2025 & 2033
- Figure 19: North America Peas Industry Revenue (Million), by Price Trend Analysis 2025 & 2033
- Figure 20: North America Peas Industry Volume (Kiloton), by Price Trend Analysis 2025 & 2033
- Figure 21: North America Peas Industry Revenue Share (%), by Price Trend Analysis 2025 & 2033
- Figure 22: North America Peas Industry Volume Share (%), by Price Trend Analysis 2025 & 2033
- Figure 23: North America Peas Industry Revenue (Million), by Country 2025 & 2033
- Figure 24: North America Peas Industry Volume (Kiloton), by Country 2025 & 2033
- Figure 25: North America Peas Industry Revenue Share (%), by Country 2025 & 2033
- Figure 26: North America Peas Industry Volume Share (%), by Country 2025 & 2033
- Figure 27: Europe Peas Industry Revenue (Million), by Production Analysis 2025 & 2033
- Figure 28: Europe Peas Industry Volume (Kiloton), by Production Analysis 2025 & 2033
- Figure 29: Europe Peas Industry Revenue Share (%), by Production Analysis 2025 & 2033
- Figure 30: Europe Peas Industry Volume Share (%), by Production Analysis 2025 & 2033
- Figure 31: Europe Peas Industry Revenue (Million), by Consumption Analysis 2025 & 2033
- Figure 32: Europe Peas Industry Volume (Kiloton), by Consumption Analysis 2025 & 2033
- Figure 33: Europe Peas Industry Revenue Share (%), by Consumption Analysis 2025 & 2033
- Figure 34: Europe Peas Industry Volume Share (%), by Consumption Analysis 2025 & 2033
- Figure 35: Europe Peas Industry Revenue (Million), by Import Market Analysis (Value & Volume) 2025 & 2033
- Figure 36: Europe Peas Industry Volume (Kiloton), by Import Market Analysis (Value & Volume) 2025 & 2033
- Figure 37: Europe Peas Industry Revenue Share (%), by Import Market Analysis (Value & Volume) 2025 & 2033
- Figure 38: Europe Peas Industry Volume Share (%), by Import Market Analysis (Value & Volume) 2025 & 2033
- Figure 39: Europe Peas Industry Revenue (Million), by Export Market Analysis (Value & Volume) 2025 & 2033
- Figure 40: Europe Peas Industry Volume (Kiloton), by Export Market Analysis (Value & Volume) 2025 & 2033
- Figure 41: Europe Peas Industry Revenue Share (%), by Export Market Analysis (Value & Volume) 2025 & 2033
- Figure 42: Europe Peas Industry Volume Share (%), by Export Market Analysis (Value & Volume) 2025 & 2033
- Figure 43: Europe Peas Industry Revenue (Million), by Price Trend Analysis 2025 & 2033
- Figure 44: Europe Peas Industry Volume (Kiloton), by Price Trend Analysis 2025 & 2033
- Figure 45: Europe Peas Industry Revenue Share (%), by Price Trend Analysis 2025 & 2033
- Figure 46: Europe Peas Industry Volume Share (%), by Price Trend Analysis 2025 & 2033
- Figure 47: Europe Peas Industry Revenue (Million), by Country 2025 & 2033
- Figure 48: Europe Peas Industry Volume (Kiloton), by Country 2025 & 2033
- Figure 49: Europe Peas Industry Revenue Share (%), by Country 2025 & 2033
- Figure 50: Europe Peas Industry Volume Share (%), by Country 2025 & 2033
- Figure 51: Asia Pacific Peas Industry Revenue (Million), by Production Analysis 2025 & 2033
- Figure 52: Asia Pacific Peas Industry Volume (Kiloton), by Production Analysis 2025 & 2033
- Figure 53: Asia Pacific Peas Industry Revenue Share (%), by Production Analysis 2025 & 2033
- Figure 54: Asia Pacific Peas Industry Volume Share (%), by Production Analysis 2025 & 2033
- Figure 55: Asia Pacific Peas Industry Revenue (Million), by Consumption Analysis 2025 & 2033
- Figure 56: Asia Pacific Peas Industry Volume (Kiloton), by Consumption Analysis 2025 & 2033
- Figure 57: Asia Pacific Peas Industry Revenue Share (%), by Consumption Analysis 2025 & 2033
- Figure 58: Asia Pacific Peas Industry Volume Share (%), by Consumption Analysis 2025 & 2033
- Figure 59: Asia Pacific Peas Industry Revenue (Million), by Import Market Analysis (Value & Volume) 2025 & 2033
- Figure 60: Asia Pacific Peas Industry Volume (Kiloton), by Import Market Analysis (Value & Volume) 2025 & 2033
- Figure 61: Asia Pacific Peas Industry Revenue Share (%), by Import Market Analysis (Value & Volume) 2025 & 2033
- Figure 62: Asia Pacific Peas Industry Volume Share (%), by Import Market Analysis (Value & Volume) 2025 & 2033
- Figure 63: Asia Pacific Peas Industry Revenue (Million), by Export Market Analysis (Value & Volume) 2025 & 2033
- Figure 64: Asia Pacific Peas Industry Volume (Kiloton), by Export Market Analysis (Value & Volume) 2025 & 2033
- Figure 65: Asia Pacific Peas Industry Revenue Share (%), by Export Market Analysis (Value & Volume) 2025 & 2033
- Figure 66: Asia Pacific Peas Industry Volume Share (%), by Export Market Analysis (Value & Volume) 2025 & 2033
- Figure 67: Asia Pacific Peas Industry Revenue (Million), by Price Trend Analysis 2025 & 2033
- Figure 68: Asia Pacific Peas Industry Volume (Kiloton), by Price Trend Analysis 2025 & 2033
- Figure 69: Asia Pacific Peas Industry Revenue Share (%), by Price Trend Analysis 2025 & 2033
- Figure 70: Asia Pacific Peas Industry Volume Share (%), by Price Trend Analysis 2025 & 2033
- Figure 71: Asia Pacific Peas Industry Revenue (Million), by Country 2025 & 2033
- Figure 72: Asia Pacific Peas Industry Volume (Kiloton), by Country 2025 & 2033
- Figure 73: Asia Pacific Peas Industry Revenue Share (%), by Country 2025 & 2033
- Figure 74: Asia Pacific Peas Industry Volume Share (%), by Country 2025 & 2033
- Figure 75: South America Peas Industry Revenue (Million), by Production Analysis 2025 & 2033
- Figure 76: South America Peas Industry Volume (Kiloton), by Production Analysis 2025 & 2033
- Figure 77: South America Peas Industry Revenue Share (%), by Production Analysis 2025 & 2033
- Figure 78: South America Peas Industry Volume Share (%), by Production Analysis 2025 & 2033
- Figure 79: South America Peas Industry Revenue (Million), by Consumption Analysis 2025 & 2033
- Figure 80: South America Peas Industry Volume (Kiloton), by Consumption Analysis 2025 & 2033
- Figure 81: South America Peas Industry Revenue Share (%), by Consumption Analysis 2025 & 2033
- Figure 82: South America Peas Industry Volume Share (%), by Consumption Analysis 2025 & 2033
- Figure 83: South America Peas Industry Revenue (Million), by Import Market Analysis (Value & Volume) 2025 & 2033
- Figure 84: South America Peas Industry Volume (Kiloton), by Import Market Analysis (Value & Volume) 2025 & 2033
- Figure 85: South America Peas Industry Revenue Share (%), by Import Market Analysis (Value & Volume) 2025 & 2033
- Figure 86: South America Peas Industry Volume Share (%), by Import Market Analysis (Value & Volume) 2025 & 2033
- Figure 87: South America Peas Industry Revenue (Million), by Export Market Analysis (Value & Volume) 2025 & 2033
- Figure 88: South America Peas Industry Volume (Kiloton), by Export Market Analysis (Value & Volume) 2025 & 2033
- Figure 89: South America Peas Industry Revenue Share (%), by Export Market Analysis (Value & Volume) 2025 & 2033
- Figure 90: South America Peas Industry Volume Share (%), by Export Market Analysis (Value & Volume) 2025 & 2033
- Figure 91: South America Peas Industry Revenue (Million), by Price Trend Analysis 2025 & 2033
- Figure 92: South America Peas Industry Volume (Kiloton), by Price Trend Analysis 2025 & 2033
- Figure 93: South America Peas Industry Revenue Share (%), by Price Trend Analysis 2025 & 2033
- Figure 94: South America Peas Industry Volume Share (%), by Price Trend Analysis 2025 & 2033
- Figure 95: South America Peas Industry Revenue (Million), by Country 2025 & 2033
- Figure 96: South America Peas Industry Volume (Kiloton), by Country 2025 & 2033
- Figure 97: South America Peas Industry Revenue Share (%), by Country 2025 & 2033
- Figure 98: South America Peas Industry Volume Share (%), by Country 2025 & 2033
- Figure 99: Africa Peas Industry Revenue (Million), by Production Analysis 2025 & 2033
- Figure 100: Africa Peas Industry Volume (Kiloton), by Production Analysis 2025 & 2033
- Figure 101: Africa Peas Industry Revenue Share (%), by Production Analysis 2025 & 2033
- Figure 102: Africa Peas Industry Volume Share (%), by Production Analysis 2025 & 2033
- Figure 103: Africa Peas Industry Revenue (Million), by Consumption Analysis 2025 & 2033
- Figure 104: Africa Peas Industry Volume (Kiloton), by Consumption Analysis 2025 & 2033
- Figure 105: Africa Peas Industry Revenue Share (%), by Consumption Analysis 2025 & 2033
- Figure 106: Africa Peas Industry Volume Share (%), by Consumption Analysis 2025 & 2033
- Figure 107: Africa Peas Industry Revenue (Million), by Import Market Analysis (Value & Volume) 2025 & 2033
- Figure 108: Africa Peas Industry Volume (Kiloton), by Import Market Analysis (Value & Volume) 2025 & 2033
- Figure 109: Africa Peas Industry Revenue Share (%), by Import Market Analysis (Value & Volume) 2025 & 2033
- Figure 110: Africa Peas Industry Volume Share (%), by Import Market Analysis (Value & Volume) 2025 & 2033
- Figure 111: Africa Peas Industry Revenue (Million), by Export Market Analysis (Value & Volume) 2025 & 2033
- Figure 112: Africa Peas Industry Volume (Kiloton), by Export Market Analysis (Value & Volume) 2025 & 2033
- Figure 113: Africa Peas Industry Revenue Share (%), by Export Market Analysis (Value & Volume) 2025 & 2033
- Figure 114: Africa Peas Industry Volume Share (%), by Export Market Analysis (Value & Volume) 2025 & 2033
- Figure 115: Africa Peas Industry Revenue (Million), by Price Trend Analysis 2025 & 2033
- Figure 116: Africa Peas Industry Volume (Kiloton), by Price Trend Analysis 2025 & 2033
- Figure 117: Africa Peas Industry Revenue Share (%), by Price Trend Analysis 2025 & 2033
- Figure 118: Africa Peas Industry Volume Share (%), by Price Trend Analysis 2025 & 2033
- Figure 119: Africa Peas Industry Revenue (Million), by Country 2025 & 2033
- Figure 120: Africa Peas Industry Volume (Kiloton), by Country 2025 & 2033
- Figure 121: Africa Peas Industry Revenue Share (%), by Country 2025 & 2033
- Figure 122: Africa Peas Industry Volume Share (%), by Country 2025 & 2033
List of Tables
- Table 1: Global Peas Industry Revenue Million Forecast, by Production Analysis 2020 & 2033
- Table 2: Global Peas Industry Volume Kiloton Forecast, by Production Analysis 2020 & 2033
- Table 3: Global Peas Industry Revenue Million Forecast, by Consumption Analysis 2020 & 2033
- Table 4: Global Peas Industry Volume Kiloton Forecast, by Consumption Analysis 2020 & 2033
- Table 5: Global Peas Industry Revenue Million Forecast, by Import Market Analysis (Value & Volume) 2020 & 2033
- Table 6: Global Peas Industry Volume Kiloton Forecast, by Import Market Analysis (Value & Volume) 2020 & 2033
- Table 7: Global Peas Industry Revenue Million Forecast, by Export Market Analysis (Value & Volume) 2020 & 2033
- Table 8: Global Peas Industry Volume Kiloton Forecast, by Export Market Analysis (Value & Volume) 2020 & 2033
- Table 9: Global Peas Industry Revenue Million Forecast, by Price Trend Analysis 2020 & 2033
- Table 10: Global Peas Industry Volume Kiloton Forecast, by Price Trend Analysis 2020 & 2033
- Table 11: Global Peas Industry Revenue Million Forecast, by Region 2020 & 2033
- Table 12: Global Peas Industry Volume Kiloton Forecast, by Region 2020 & 2033
- Table 13: Global Peas Industry Revenue Million Forecast, by Production Analysis 2020 & 2033
- Table 14: Global Peas Industry Volume Kiloton Forecast, by Production Analysis 2020 & 2033
- Table 15: Global Peas Industry Revenue Million Forecast, by Consumption Analysis 2020 & 2033
- Table 16: Global Peas Industry Volume Kiloton Forecast, by Consumption Analysis 2020 & 2033
- Table 17: Global Peas Industry Revenue Million Forecast, by Import Market Analysis (Value & Volume) 2020 & 2033
- Table 18: Global Peas Industry Volume Kiloton Forecast, by Import Market Analysis (Value & Volume) 2020 & 2033
- Table 19: Global Peas Industry Revenue Million Forecast, by Export Market Analysis (Value & Volume) 2020 & 2033
- Table 20: Global Peas Industry Volume Kiloton Forecast, by Export Market Analysis (Value & Volume) 2020 & 2033
- Table 21: Global Peas Industry Revenue Million Forecast, by Price Trend Analysis 2020 & 2033
- Table 22: Global Peas Industry Volume Kiloton Forecast, by Price Trend Analysis 2020 & 2033
- Table 23: Global Peas Industry Revenue Million Forecast, by Country 2020 & 2033
- Table 24: Global Peas Industry Volume Kiloton Forecast, by Country 2020 & 2033
- Table 25: United States Peas Industry Revenue (Million) Forecast, by Application 2020 & 2033
- Table 26: United States Peas Industry Volume (Kiloton) Forecast, by Application 2020 & 2033
- Table 27: Canada Peas Industry Revenue (Million) Forecast, by Application 2020 & 2033
- Table 28: Canada Peas Industry Volume (Kiloton) Forecast, by Application 2020 & 2033
- Table 29: Global Peas Industry Revenue Million Forecast, by Production Analysis 2020 & 2033
- Table 30: Global Peas Industry Volume Kiloton Forecast, by Production Analysis 2020 & 2033
- Table 31: Global Peas Industry Revenue Million Forecast, by Consumption Analysis 2020 & 2033
- Table 32: Global Peas Industry Volume Kiloton Forecast, by Consumption Analysis 2020 & 2033
- Table 33: Global Peas Industry Revenue Million Forecast, by Import Market Analysis (Value & Volume) 2020 & 2033
- Table 34: Global Peas Industry Volume Kiloton Forecast, by Import Market Analysis (Value & Volume) 2020 & 2033
- Table 35: Global Peas Industry Revenue Million Forecast, by Export Market Analysis (Value & Volume) 2020 & 2033
- Table 36: Global Peas Industry Volume Kiloton Forecast, by Export Market Analysis (Value & Volume) 2020 & 2033
- Table 37: Global Peas Industry Revenue Million Forecast, by Price Trend Analysis 2020 & 2033
- Table 38: Global Peas Industry Volume Kiloton Forecast, by Price Trend Analysis 2020 & 2033
- Table 39: Global Peas Industry Revenue Million Forecast, by Country 2020 & 2033
- Table 40: Global Peas Industry Volume Kiloton Forecast, by Country 2020 & 2033
- Table 41: Russia Peas Industry Revenue (Million) Forecast, by Application 2020 & 2033
- Table 42: Russia Peas Industry Volume (Kiloton) Forecast, by Application 2020 & 2033
- Table 43: United Kingdom Peas Industry Revenue (Million) Forecast, by Application 2020 & 2033
- Table 44: United Kingdom Peas Industry Volume (Kiloton) Forecast, by Application 2020 & 2033
- Table 45: France Peas Industry Revenue (Million) Forecast, by Application 2020 & 2033
- Table 46: France Peas Industry Volume (Kiloton) Forecast, by Application 2020 & 2033
- Table 47: Ukraine Peas Industry Revenue (Million) Forecast, by Application 2020 & 2033
- Table 48: Ukraine Peas Industry Volume (Kiloton) Forecast, by Application 2020 & 2033
- Table 49: Global Peas Industry Revenue Million Forecast, by Production Analysis 2020 & 2033
- Table 50: Global Peas Industry Volume Kiloton Forecast, by Production Analysis 2020 & 2033
- Table 51: Global Peas Industry Revenue Million Forecast, by Consumption Analysis 2020 & 2033
- Table 52: Global Peas Industry Volume Kiloton Forecast, by Consumption Analysis 2020 & 2033
- Table 53: Global Peas Industry Revenue Million Forecast, by Import Market Analysis (Value & Volume) 2020 & 2033
- Table 54: Global Peas Industry Volume Kiloton Forecast, by Import Market Analysis (Value & Volume) 2020 & 2033
- Table 55: Global Peas Industry Revenue Million Forecast, by Export Market Analysis (Value & Volume) 2020 & 2033
- Table 56: Global Peas Industry Volume Kiloton Forecast, by Export Market Analysis (Value & Volume) 2020 & 2033
- Table 57: Global Peas Industry Revenue Million Forecast, by Price Trend Analysis 2020 & 2033
- Table 58: Global Peas Industry Volume Kiloton Forecast, by Price Trend Analysis 2020 & 2033
- Table 59: Global Peas Industry Revenue Million Forecast, by Country 2020 & 2033
- Table 60: Global Peas Industry Volume Kiloton Forecast, by Country 2020 & 2033
- Table 61: China Peas Industry Revenue (Million) Forecast, by Application 2020 & 2033
- Table 62: China Peas Industry Volume (Kiloton) Forecast, by Application 2020 & 2033
- Table 63: Australia Peas Industry Revenue (Million) Forecast, by Application 2020 & 2033
- Table 64: Australia Peas Industry Volume (Kiloton) Forecast, by Application 2020 & 2033
- Table 65: India Peas Industry Revenue (Million) Forecast, by Application 2020 & 2033
- Table 66: India Peas Industry Volume (Kiloton) Forecast, by Application 2020 & 2033
- Table 67: Global Peas Industry Revenue Million Forecast, by Production Analysis 2020 & 2033
- Table 68: Global Peas Industry Volume Kiloton Forecast, by Production Analysis 2020 & 2033
- Table 69: Global Peas Industry Revenue Million Forecast, by Consumption Analysis 2020 & 2033
- Table 70: Global Peas Industry Volume Kiloton Forecast, by Consumption Analysis 2020 & 2033
- Table 71: Global Peas Industry Revenue Million Forecast, by Import Market Analysis (Value & Volume) 2020 & 2033
- Table 72: Global Peas Industry Volume Kiloton Forecast, by Import Market Analysis (Value & Volume) 2020 & 2033
- Table 73: Global Peas Industry Revenue Million Forecast, by Export Market Analysis (Value & Volume) 2020 & 2033
- Table 74: Global Peas Industry Volume Kiloton Forecast, by Export Market Analysis (Value & Volume) 2020 & 2033
- Table 75: Global Peas Industry Revenue Million Forecast, by Price Trend Analysis 2020 & 2033
- Table 76: Global Peas Industry Volume Kiloton Forecast, by Price Trend Analysis 2020 & 2033
- Table 77: Global Peas Industry Revenue Million Forecast, by Country 2020 & 2033
- Table 78: Global Peas Industry Volume Kiloton Forecast, by Country 2020 & 2033
- Table 79: Brazil Peas Industry Revenue (Million) Forecast, by Application 2020 & 2033
- Table 80: Brazil Peas Industry Volume (Kiloton) Forecast, by Application 2020 & 2033
- Table 81: Argentina Peas Industry Revenue (Million) Forecast, by Application 2020 & 2033
- Table 82: Argentina Peas Industry Volume (Kiloton) Forecast, by Application 2020 & 2033
- Table 83: Global Peas Industry Revenue Million Forecast, by Production Analysis 2020 & 2033
- Table 84: Global Peas Industry Volume Kiloton Forecast, by Production Analysis 2020 & 2033
- Table 85: Global Peas Industry Revenue Million Forecast, by Consumption Analysis 2020 & 2033
- Table 86: Global Peas Industry Volume Kiloton Forecast, by Consumption Analysis 2020 & 2033
- Table 87: Global Peas Industry Revenue Million Forecast, by Import Market Analysis (Value & Volume) 2020 & 2033
- Table 88: Global Peas Industry Volume Kiloton Forecast, by Import Market Analysis (Value & Volume) 2020 & 2033
- Table 89: Global Peas Industry Revenue Million Forecast, by Export Market Analysis (Value & Volume) 2020 & 2033
- Table 90: Global Peas Industry Volume Kiloton Forecast, by Export Market Analysis (Value & Volume) 2020 & 2033
- Table 91: Global Peas Industry Revenue Million Forecast, by Price Trend Analysis 2020 & 2033
- Table 92: Global Peas Industry Volume Kiloton Forecast, by Price Trend Analysis 2020 & 2033
- Table 93: Global Peas Industry Revenue Million Forecast, by Country 2020 & 2033
- Table 94: Global Peas Industry Volume Kiloton Forecast, by Country 2020 & 2033
- Table 95: South Africa Peas Industry Revenue (Million) Forecast, by Application 2020 & 2033
- Table 96: South Africa Peas Industry Volume (Kiloton) Forecast, by Application 2020 & 2033
- Table 97: Egypt Peas Industry Revenue (Million) Forecast, by Application 2020 & 2033
- Table 98: Egypt Peas Industry Volume (Kiloton) Forecast, by Application 2020 & 2033
Frequently Asked Questions
1. What is the projected Compound Annual Growth Rate (CAGR) of the Peas Industry?
The projected CAGR is approximately 4.30%.
2. Which companies are prominent players in the Peas Industry?
Key companies in the market include Solina Group, Archer Daniels Midland, Ingredion, Cargill , Roquette .
3. What are the main segments of the Peas Industry?
The market segments include Production Analysis, Consumption Analysis, Import Market Analysis (Value & Volume), Export Market Analysis (Value & Volume), Price Trend Analysis.
4. Can you provide details about the market size?
The market size is estimated to be USD XXX Million as of 2022.
5. What are some drivers contributing to market growth?
Rising Consumption of Cashew Nuts in the Country; Favorable Government Initiatives.
6. What are the notable trends driving market growth?
Growing Demand for Pea Protein Consumption.
7. Are there any restraints impacting market growth?
Hazardous Climatic Condition Hinders Cashew Production; Stringent Regulations Related to Food Quality Standards.
8. Can you provide examples of recent developments in the market?
October 2022: Roquette, a global leader in plant-based ingredients and a pioneer of plant proteins, launched a new line of organic pea ingredients, organic pea starch, and organic pea protein in the North American and Europe markets to meet customer demand.
9. What pricing options are available for accessing the report?
Pricing options include single-user, multi-user, and enterprise licenses priced at USD 4750, USD 5250, and USD 8750 respectively.
10. Is the market size provided in terms of value or volume?
The market size is provided in terms of value, measured in Million and volume, measured in Kiloton.
11. Are there any specific market keywords associated with the report?
Yes, the market keyword associated with the report is "Peas Industry," which aids in identifying and referencing the specific market segment covered.
12. How do I determine which pricing option suits my needs best?
The pricing options vary based on user requirements and access needs. Individual users may opt for single-user licenses, while businesses requiring broader access may choose multi-user or enterprise licenses for cost-effective access to the report.
13. Are there any additional resources or data provided in the Peas Industry report?
While the report offers comprehensive insights, it's advisable to review the specific contents or supplementary materials provided to ascertain if additional resources or data are available.
14. How can I stay updated on further developments or reports in the Peas Industry?
To stay informed about further developments, trends, and reports in the Peas Industry, consider subscribing to industry newsletters, following relevant companies and organizations, or regularly checking reputable industry news sources and publications.
Methodology
Step 1 - Identification of Relevant Samples Size from Population Database


Step 2 - Approaches for Defining Global Market Size (Value, Volume* & Price*)

Note*: In applicable scenarios
Step 3 - Data Sources
Primary Research
- Web Analytics
- Survey Reports
- Research Institute
- Latest Research Reports
- Opinion Leaders
Secondary Research
- Annual Reports
- White Paper
- Latest Press Release
- Industry Association
- Paid Database
- Investor Presentations

Step 4 - Data Triangulation
Involves using different sources of information in order to increase the validity of a study
These sources are likely to be stakeholders in a program - participants, other researchers, program staff, other community members, and so on.
Then we put all data in single framework & apply various statistical tools to find out the dynamic on the market.
During the analysis stage, feedback from the stakeholder groups would be compared to determine areas of agreement as well as areas of divergence