

Key Insights
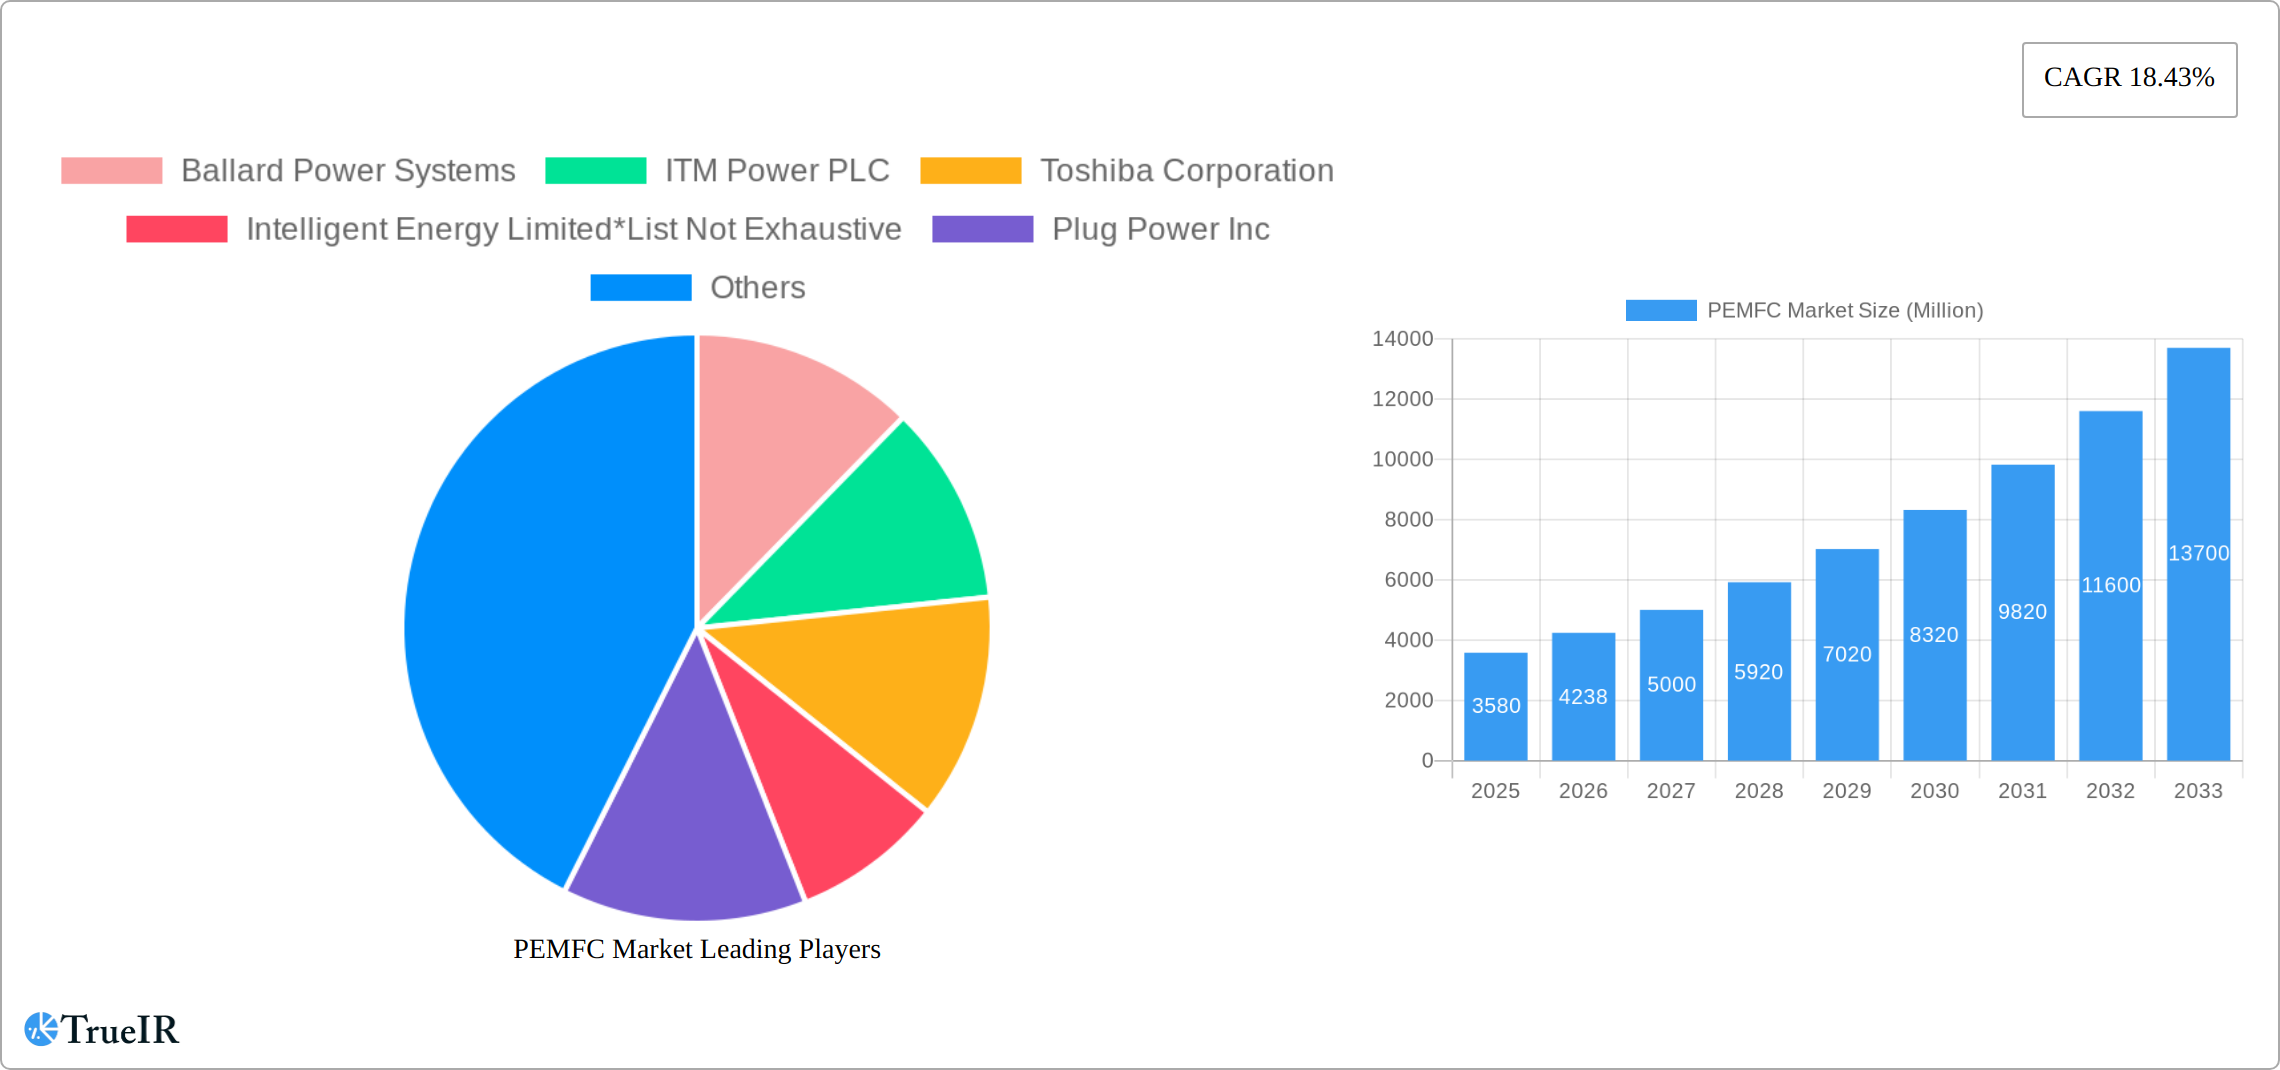
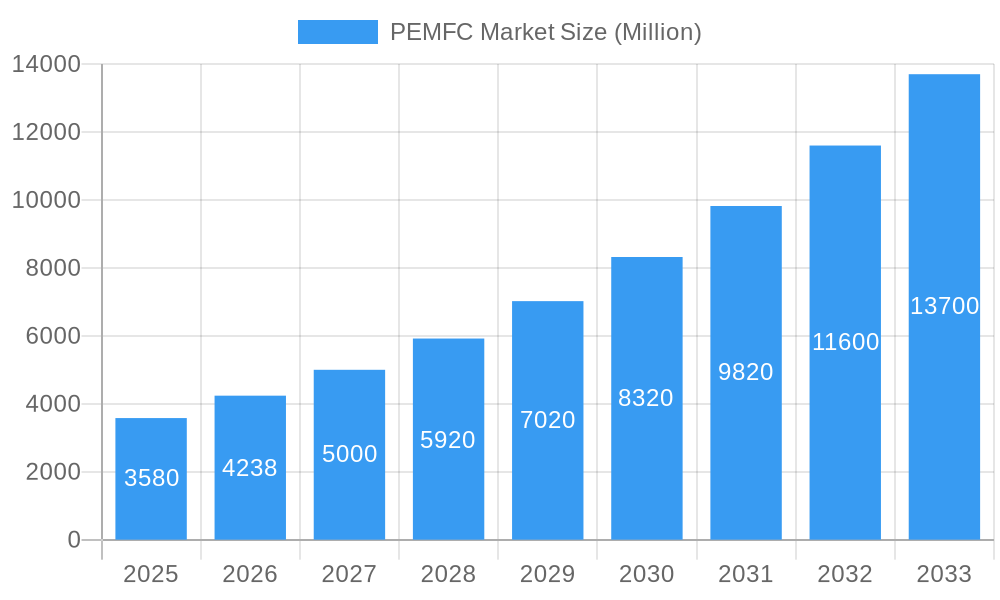
The Polymer Electrolyte Membrane Fuel Cell (PEMFC) market is experiencing robust growth, projected to reach a market size of $3.58 billion in 2025 and exhibiting a Compound Annual Growth Rate (CAGR) of 18.43% from 2025 to 2033. This expansion is driven by several key factors. Increasing environmental concerns and stringent regulations on greenhouse gas emissions are pushing governments and industries towards cleaner energy solutions. PEMFCs, with their zero tailpipe emissions, are uniquely positioned to capitalize on this shift, particularly in the transportation sector (automotive, buses, forklifts) where demand for electric and hydrogen-powered vehicles is surging. Furthermore, advancements in PEMFC technology, including improvements in durability, efficiency, and cost-effectiveness, are accelerating market adoption. The growing interest in stationary power generation for residential, commercial, and industrial applications also contributes to market growth. While high initial investment costs and limited hydrogen refueling infrastructure pose challenges, ongoing technological advancements and supportive government policies are mitigating these restraints. The market is segmented by fuel type (hydrogen being dominant, followed by methanol and others), installation type (on-board and off-board), end-user application (transportation leading, followed by stationary power generation and portable power), and technology (high-temperature and low-temperature PEMFCs). Major players like Ballard Power Systems, Plug Power Inc., and Toshiba Corporation are driving innovation and expanding market reach.
PEMFC Market Market Size (In Billion)
Geographic distribution of the PEMFC market reveals strong growth across North America, Europe, and Asia Pacific. North America, particularly the United States, benefits from a strong focus on clean energy initiatives and a robust automotive industry. Europe is witnessing significant adoption driven by stringent emission norms and government support for hydrogen technology. Asia Pacific is experiencing rapid growth, fueled by the increasing demand for clean energy in countries like China, Japan, and South Korea. The market's continued expansion is expected to be influenced by factors like technological breakthroughs leading to increased efficiency and reduced costs, favorable government policies promoting renewable energy, and growing investments in hydrogen infrastructure development. This creates a positive outlook for PEMFC market growth over the forecast period.
PEMFC Market Company Market Share
PEMFC Market: A Comprehensive Report (2019-2033)
This dynamic report provides a comprehensive analysis of the PEMFC (Proton Exchange Membrane Fuel Cell) market, offering invaluable insights for stakeholders across the value chain. Leveraging extensive market research and data analysis covering the period 2019-2033 (Base Year: 2025, Forecast Period: 2025-2033), this report forecasts a market size of xx Million by 2033, exhibiting a CAGR of xx% during the forecast period.
PEMFC Market Structure & Competitive Landscape
The PEMFC market is characterized by a moderately concentrated competitive landscape with several key players vying for market share. Leading companies include Ballard Power Systems, ITM Power PLC, Toshiba Corporation, Intelligent Energy Limited, Plug Power Inc, Powercell Sweden AB, Bramble Energy, Cummins Inc, Bloom Energy, and Hydrogenics (a Cummins Inc. company). However, the market also encompasses numerous smaller players, fostering innovation and competition.
The market's structure is influenced by several factors:
- Innovation Drivers: Continuous R&D efforts focused on improving efficiency, durability, and cost-effectiveness of PEMFC technology are driving market growth. Advancements in materials science and manufacturing processes are key enablers.
- Regulatory Impacts: Government policies and incentives promoting renewable energy and hydrogen infrastructure significantly impact market adoption. Stringent emission regulations further propel the demand for cleaner energy solutions.
- Product Substitutes: PEMFCs compete with other energy storage and generation technologies, including batteries, internal combustion engines, and other fuel cell types (e.g., DMFCs). The competitive landscape necessitates continuous improvement in cost and performance.
- End-User Segmentation: The market is segmented across various end-user applications, including transportation (automotive, buses, forklifts), stationary power generation (residential, commercial, industrial), and portable power (consumer electronics, military applications). Market growth varies significantly across these segments, with transportation and stationary power generation leading the charge.
- M&A Trends: The PEMFC sector witnesses ongoing mergers and acquisitions, as larger companies strategize to consolidate market share, gain access to cutting-edge technologies, and expand their product portfolios. The total M&A volume in the PEMFC market from 2019 to 2024 is estimated at xx Million, suggesting a significant level of consolidation. Concentration ratios (e.g., the Herfindahl-Hirschman Index) suggest a moderately concentrated market with room for future consolidation.
PEMFC Market Trends & Opportunities
The PEMFC market is experiencing robust growth, driven by increasing demand for clean energy solutions and the rising adoption of fuel cell technology across diverse sectors. The market size is projected to reach xx Million by 2033, exhibiting a noteworthy CAGR of xx%. Technological advancements, particularly in high-temperature PEMFCs, are enhancing efficiency and reducing costs. Furthermore, supportive government policies and initiatives globally are fostering market expansion and encouraging investment in PEMFC infrastructure. Growing consumer preference for sustainable energy and the environmental concerns associated with traditional power sources are driving the adoption of PEMFCs in various applications. The competitive dynamics are intensifying, with key players focusing on product innovation, strategic partnerships, and market expansion to solidify their positions in this burgeoning market. Market penetration rates are steadily increasing, particularly in the transportation and stationary power generation sectors.
Dominant Markets & Segments in PEMFC Market
The PEMFC market is experiencing robust growth across diverse geographical regions and application segments. While precise market share data fluctuates, a general overview based on current industry trends reveals key areas of dominance.
Leading Regions/Countries: The Asia-Pacific region, particularly China and Japan, currently exhibits significant market leadership due to strong government support for renewable energy initiatives, substantial investments in research and development, and a growing demand for clean energy solutions. North America and Europe also represent substantial markets, driven by similar factors and expanding hydrogen infrastructure.
- Robust Government Support and Policy Incentives: Many governments are implementing supportive policies, including subsidies, tax credits, and mandates for renewable energy adoption, creating a favorable environment for PEMFC market expansion.
- Escalating Demand for Clean Energy: The global push towards decarbonization and the increasing awareness of climate change are significantly boosting the demand for cleaner energy alternatives, propelling PEMFC adoption.
- Continuous Technological Advancements: Ongoing research and development efforts are focused on enhancing PEMFC performance, durability, and cost-effectiveness, leading to the introduction of more efficient and affordable fuel cell systems.
- Development of Hydrogen Infrastructure: Investments in hydrogen production, storage, and distribution networks are gradually addressing the limitations associated with hydrogen availability and accessibility, further supporting PEMFC market growth.
Leading Segments:
- Fuel Cell Type: Polymer Electrolyte Membrane Fuel Cells (PEMFCs) remain the dominant fuel cell type due to their technological maturity, versatility, and relatively lower operating temperatures.
- End-User Application: The transportation sector, encompassing automotive, buses, and potentially trains, is a major growth driver. The stationary power generation sector, including backup power for commercial and industrial applications, also represents a significant market segment. The material handling and portable power segments are showing promising growth potential.
- Technology: Low-temperature PEMFCs currently hold a larger market share owing to their established technology and cost-effectiveness. However, high-temperature PEMFCs are attracting increasing attention due to their potential for higher efficiency and improved fuel flexibility.
- Installation Type: On-board fuel cell systems are currently more prevalent, especially in transportation. However, off-board fuel cell systems are gaining traction in stationary power generation and other applications where centralized power generation is advantageous.
- Fuel Type: Hydrogen remains the dominant fuel source given its high energy density and zero tailpipe emissions. However, research into alternative fuels is ongoing to expand the applicability and reduce reliance on hydrogen alone.
PEMFC Market Product Analysis
PEMFC technology is undergoing continuous refinement, with recent advancements focusing on improved durability, increased efficiency, enhanced power density, and reduced manufacturing costs. The market is witnessing the emergence of increasingly compact, lightweight, and efficient fuel cell systems. Key competitive advantages of PEMFCs include zero tailpipe emissions, higher energy conversion efficiency compared to internal combustion engines, reduced noise pollution, and potential for distributed generation. These advancements are accelerating broader adoption across various sectors, driving substantial market expansion.
Key Drivers, Barriers & Challenges in PEMFC Market
Key Drivers:
- Technological advancements resulting in higher efficiency and lower costs.
- Stringent emission regulations globally driving the need for clean energy solutions.
- Government incentives and subsidies promoting the adoption of renewable energy technologies.
- Rising awareness of environmental concerns among consumers and businesses.
Key Challenges and Restraints:
- High initial investment costs associated with PEMFC systems can hinder widespread adoption.
- The limited availability of hydrogen refueling infrastructure restricts market penetration, particularly in the transportation sector.
- Technological challenges in enhancing the durability and lifespan of fuel cells remain. The projected impact of these challenges on market growth is estimated at xx% reduction in CAGR by 2033.
- Competition from other energy storage and generation technologies poses a significant challenge.
Growth Drivers in the PEMFC Market
Technological advancements, government policies promoting clean energy, and increasing environmental concerns are key growth drivers. Specific examples include the development of high-temperature PEMFCs that enhance efficiency, and government subsidies that incentivize PEMFC adoption in transportation and stationary power generation. The growing need for decentralized power generation also contributes to the market expansion.
Challenges Impacting PEMFC Market Growth
Despite significant progress, several challenges persist in hindering the widespread adoption of PEMFC technology. High initial capital costs, the limited availability and high cost of hydrogen infrastructure, and the ongoing competition from alternative technologies, such as advanced battery systems, remain significant obstacles. Regulatory uncertainties and complexities related to hydrogen storage and transportation, along with the need for further advancements in material science, also pose challenges to market growth. Overcoming these challenges will be crucial to achieving the projected growth potential of the PEMFC market and accelerating its broader commercialization.
Key Players Shaping the PEMFC Market Market
- Ballard Power Systems
- ITM Power PLC
- Toshiba Corporation
- Intelligent Energy Limited
- Plug Power Inc
- Powercell Sweden AB
- Bramble Energy
- Cummins Inc
- Bloom Energy
- Hydrogenics (a Cummins Inc. company)
Significant PEMFC Market Industry Milestones
- October 2021: Panasonic Corporation announced the development of a pure hydrogen fuel cell generator.
- April 2022: SFC Energy and FC TecNrgy signed a deal to produce methanol and hydrogen fuel cells in India, launching the EFOY hydrogen fuel cell.
- August 2022: NREL and Toyota collaborated on a 1-MW PEM fuel cell power generation system.
Future Outlook for PEMFC Market Market
The PEMFC market is poised for significant growth driven by continuous technological advancements, supportive government policies, and increasing demand for clean energy. Strategic partnerships, investments in R&D, and the expansion of hydrogen infrastructure will further fuel market expansion, creating substantial opportunities for key players and new entrants. The market's future potential is considerable, with significant growth projected across various applications and regions.
PEMFC Market Segmentation
- 1. Production Analysis
- 2. Consumption Analysis
- 3. Import Market Analysis (Value & Volume)
- 4. Export Market Analysis (Value & Volume)
- 5. Price Trend Analysis
PEMFC Market Segmentation By Geography
- 1. North America
- 2. Europe
- 3. Asia Pacific
- 4. Rest of the World
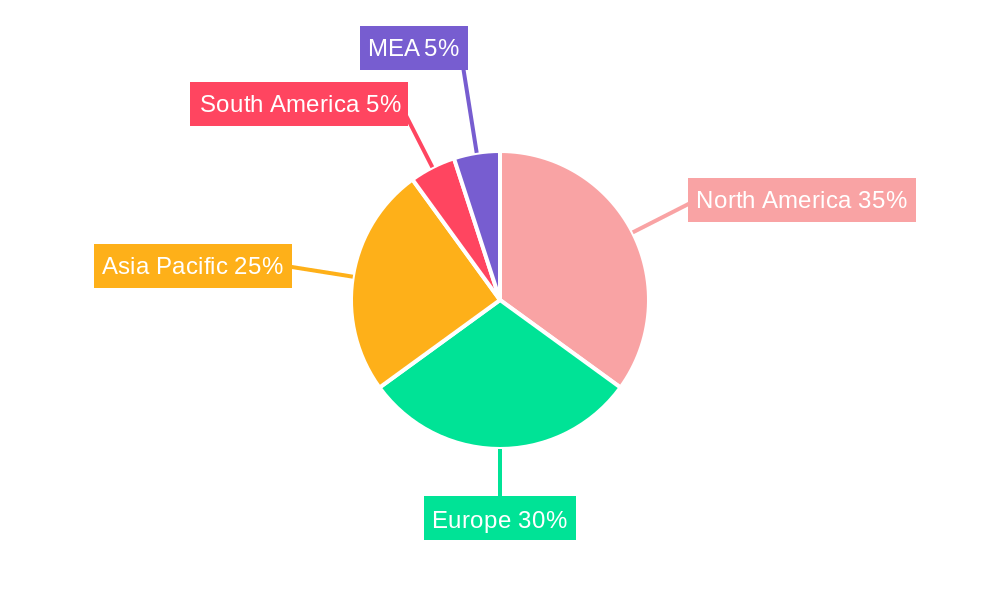
PEMFC Market Regional Market Share
Geographic Coverage of PEMFC Market
PEMFC Market REPORT HIGHLIGHTS
| Aspects | Details |
|---|---|
| Study Period | 2020-2034 |
| Base Year | 2025 |
| Estimated Year | 2026 |
| Forecast Period | 2026-2034 |
| Historical Period | 2020-2025 |
| Growth Rate | CAGR of 18.43% from 2020-2034 |
| Segmentation |
|
Table of Contents
- 1. Introduction
- 1.1. Research Scope
- 1.2. Market Segmentation
- 1.3. Research Objective
- 1.4. Definitions and Assumptions
- 2. Executive Summary
- 2.1. Market Snapshot
- 3. Market Dynamics
- 3.1. Market Drivers
- 3.2. Market Restrains
- 3.3. Market Trends
- 3.4. Market Opportunities
- 4. Market Factor Analysis
- 4.1. Porters Five Forces
- 4.1.1. Bargaining Power of Suppliers
- 4.1.2. Bargaining Power of Buyers
- 4.1.3. Threat of New Entrants
- 4.1.4. Threat of Substitutes
- 4.1.5. Competitive Rivalry
- 4.2. PESTEL analysis
- 4.3. BCG Analysis
- 4.3.1. Stars (High Growth, High Market Share)
- 4.3.2. Cash Cows (Low Growth, High Market Share)
- 4.3.3. Question Mark (High Growth, Low Market Share)
- 4.3.4. Dogs (Low Growth, Low Market Share)
- 4.4. Ansoff Matrix Analysis
- 4.5. Supply Chain Analysis
- 4.6. Regulatory Landscape
- 4.7. Current Market Potential and Opportunity Assessment (TAM–SAM–SOM Framework)
- 4.8. TIR Analyst Note
- 4.1. Porters Five Forces
- 5. Market Analysis, Insights and Forecast 2021-2033
- 5.1. Market Analysis, Insights and Forecast - by Production Analysis
- 5.2. Market Analysis, Insights and Forecast - by Consumption Analysis
- 5.3. Market Analysis, Insights and Forecast - by Import Market Analysis (Value & Volume)
- 5.4. Market Analysis, Insights and Forecast - by Export Market Analysis (Value & Volume)
- 5.5. Market Analysis, Insights and Forecast - by Price Trend Analysis
- 5.6. Market Analysis, Insights and Forecast - by Region
- 5.6.1. North America
- 5.6.2. Europe
- 5.6.3. Asia Pacific
- 5.6.4. Rest of the World
- 6. Global PEMFC Market Analysis, Insights and Forecast, 2021-2033
- 6.1. Market Analysis, Insights and Forecast - by Production Analysis
- 6.2. Market Analysis, Insights and Forecast - by Consumption Analysis
- 6.3. Market Analysis, Insights and Forecast - by Import Market Analysis (Value & Volume)
- 6.4. Market Analysis, Insights and Forecast - by Export Market Analysis (Value & Volume)
- 6.5. Market Analysis, Insights and Forecast - by Price Trend Analysis
- 7. North America PEMFC Market Analysis, Insights and Forecast, 2020-2032
- 7.1. Market Analysis, Insights and Forecast - by Production Analysis
- 7.2. Market Analysis, Insights and Forecast - by Consumption Analysis
- 7.3. Market Analysis, Insights and Forecast - by Import Market Analysis (Value & Volume)
- 7.4. Market Analysis, Insights and Forecast - by Export Market Analysis (Value & Volume)
- 7.5. Market Analysis, Insights and Forecast - by Price Trend Analysis
- 8. Europe PEMFC Market Analysis, Insights and Forecast, 2020-2032
- 8.1. Market Analysis, Insights and Forecast - by Production Analysis
- 8.2. Market Analysis, Insights and Forecast - by Consumption Analysis
- 8.3. Market Analysis, Insights and Forecast - by Import Market Analysis (Value & Volume)
- 8.4. Market Analysis, Insights and Forecast - by Export Market Analysis (Value & Volume)
- 8.5. Market Analysis, Insights and Forecast - by Price Trend Analysis
- 9. Asia Pacific PEMFC Market Analysis, Insights and Forecast, 2020-2032
- 9.1. Market Analysis, Insights and Forecast - by Production Analysis
- 9.2. Market Analysis, Insights and Forecast - by Consumption Analysis
- 9.3. Market Analysis, Insights and Forecast - by Import Market Analysis (Value & Volume)
- 9.4. Market Analysis, Insights and Forecast - by Export Market Analysis (Value & Volume)
- 9.5. Market Analysis, Insights and Forecast - by Price Trend Analysis
- 10. Rest of the World PEMFC Market Analysis, Insights and Forecast, 2020-2032
- 10.1. Market Analysis, Insights and Forecast - by Production Analysis
- 10.2. Market Analysis, Insights and Forecast - by Consumption Analysis
- 10.3. Market Analysis, Insights and Forecast - by Import Market Analysis (Value & Volume)
- 10.4. Market Analysis, Insights and Forecast - by Export Market Analysis (Value & Volume)
- 10.5. Market Analysis, Insights and Forecast - by Price Trend Analysis
- 11. Competitive Analysis
- 11.1. Company Profiles
- 11.1.1 Ballard Power Systems
- 11.1.1.1. Company Overview
- 11.1.1.2. Products
- 11.1.1.3. Company Financials
- 11.1.1.4. SWOT Analysis
- 11.1.2 ITM Power PLC
- 11.1.2.1. Company Overview
- 11.1.2.2. Products
- 11.1.2.3. Company Financials
- 11.1.2.4. SWOT Analysis
- 11.1.3 Toshiba Corporation
- 11.1.3.1. Company Overview
- 11.1.3.2. Products
- 11.1.3.3. Company Financials
- 11.1.3.4. SWOT Analysis
- 11.1.4 Intelligent Energy Limited*List Not Exhaustive
- 11.1.4.1. Company Overview
- 11.1.4.2. Products
- 11.1.4.3. Company Financials
- 11.1.4.4. SWOT Analysis
- 11.1.5 Plug Power Inc
- 11.1.5.1. Company Overview
- 11.1.5.2. Products
- 11.1.5.3. Company Financials
- 11.1.5.4. SWOT Analysis
- 11.1.6 Powercell Sweden AB
- 11.1.6.1. Company Overview
- 11.1.6.2. Products
- 11.1.6.3. Company Financials
- 11.1.6.4. SWOT Analysis
- 11.1.7 Bramble Energy
- 11.1.7.1. Company Overview
- 11.1.7.2. Products
- 11.1.7.3. Company Financials
- 11.1.7.4. SWOT Analysis
- 11.1.8 Cummins Inc
- 11.1.8.1. Company Overview
- 11.1.8.2. Products
- 11.1.8.3. Company Financials
- 11.1.8.4. SWOT Analysis
- 11.1.9 Bloom Energy
- 11.1.9.1. Company Overview
- 11.1.9.2. Products
- 11.1.9.3. Company Financials
- 11.1.9.4. SWOT Analysis
- 11.1.10 Hydrogenics (a Cummins Inc. company)
- 11.1.10.1. Company Overview
- 11.1.10.2. Products
- 11.1.10.3. Company Financials
- 11.1.10.4. SWOT Analysis
- 11.1.1 Ballard Power Systems
- 11.2. Market Entropy
- 11.2.1 Company's Key Areas Served
- 11.2.2 Recent Developments
- 11.3. Company Market Share Analysis 2025
- 11.3.1 Top 5 Companies Market Share Analysis
- 11.3.2 Top 3 Companies Market Share Analysis
- 11.4. List of Potential Customers
- 12. Research Methodology
List of Figures
- Figure 1: Global PEMFC Market Revenue Breakdown (Million, %) by Region 2025 & 2033
- Figure 2: Global PEMFC Market Volume Breakdown (Gigawatt, %) by Region 2025 & 2033
- Figure 3: North America PEMFC Market Revenue (Million), by Production Analysis 2025 & 2033
- Figure 4: North America PEMFC Market Volume (Gigawatt), by Production Analysis 2025 & 2033
- Figure 5: North America PEMFC Market Revenue Share (%), by Production Analysis 2025 & 2033
- Figure 6: North America PEMFC Market Volume Share (%), by Production Analysis 2025 & 2033
- Figure 7: North America PEMFC Market Revenue (Million), by Consumption Analysis 2025 & 2033
- Figure 8: North America PEMFC Market Volume (Gigawatt), by Consumption Analysis 2025 & 2033
- Figure 9: North America PEMFC Market Revenue Share (%), by Consumption Analysis 2025 & 2033
- Figure 10: North America PEMFC Market Volume Share (%), by Consumption Analysis 2025 & 2033
- Figure 11: North America PEMFC Market Revenue (Million), by Import Market Analysis (Value & Volume) 2025 & 2033
- Figure 12: North America PEMFC Market Volume (Gigawatt), by Import Market Analysis (Value & Volume) 2025 & 2033
- Figure 13: North America PEMFC Market Revenue Share (%), by Import Market Analysis (Value & Volume) 2025 & 2033
- Figure 14: North America PEMFC Market Volume Share (%), by Import Market Analysis (Value & Volume) 2025 & 2033
- Figure 15: North America PEMFC Market Revenue (Million), by Export Market Analysis (Value & Volume) 2025 & 2033
- Figure 16: North America PEMFC Market Volume (Gigawatt), by Export Market Analysis (Value & Volume) 2025 & 2033
- Figure 17: North America PEMFC Market Revenue Share (%), by Export Market Analysis (Value & Volume) 2025 & 2033
- Figure 18: North America PEMFC Market Volume Share (%), by Export Market Analysis (Value & Volume) 2025 & 2033
- Figure 19: North America PEMFC Market Revenue (Million), by Price Trend Analysis 2025 & 2033
- Figure 20: North America PEMFC Market Volume (Gigawatt), by Price Trend Analysis 2025 & 2033
- Figure 21: North America PEMFC Market Revenue Share (%), by Price Trend Analysis 2025 & 2033
- Figure 22: North America PEMFC Market Volume Share (%), by Price Trend Analysis 2025 & 2033
- Figure 23: North America PEMFC Market Revenue (Million), by Country 2025 & 2033
- Figure 24: North America PEMFC Market Volume (Gigawatt), by Country 2025 & 2033
- Figure 25: North America PEMFC Market Revenue Share (%), by Country 2025 & 2033
- Figure 26: North America PEMFC Market Volume Share (%), by Country 2025 & 2033
- Figure 27: Europe PEMFC Market Revenue (Million), by Production Analysis 2025 & 2033
- Figure 28: Europe PEMFC Market Volume (Gigawatt), by Production Analysis 2025 & 2033
- Figure 29: Europe PEMFC Market Revenue Share (%), by Production Analysis 2025 & 2033
- Figure 30: Europe PEMFC Market Volume Share (%), by Production Analysis 2025 & 2033
- Figure 31: Europe PEMFC Market Revenue (Million), by Consumption Analysis 2025 & 2033
- Figure 32: Europe PEMFC Market Volume (Gigawatt), by Consumption Analysis 2025 & 2033
- Figure 33: Europe PEMFC Market Revenue Share (%), by Consumption Analysis 2025 & 2033
- Figure 34: Europe PEMFC Market Volume Share (%), by Consumption Analysis 2025 & 2033
- Figure 35: Europe PEMFC Market Revenue (Million), by Import Market Analysis (Value & Volume) 2025 & 2033
- Figure 36: Europe PEMFC Market Volume (Gigawatt), by Import Market Analysis (Value & Volume) 2025 & 2033
- Figure 37: Europe PEMFC Market Revenue Share (%), by Import Market Analysis (Value & Volume) 2025 & 2033
- Figure 38: Europe PEMFC Market Volume Share (%), by Import Market Analysis (Value & Volume) 2025 & 2033
- Figure 39: Europe PEMFC Market Revenue (Million), by Export Market Analysis (Value & Volume) 2025 & 2033
- Figure 40: Europe PEMFC Market Volume (Gigawatt), by Export Market Analysis (Value & Volume) 2025 & 2033
- Figure 41: Europe PEMFC Market Revenue Share (%), by Export Market Analysis (Value & Volume) 2025 & 2033
- Figure 42: Europe PEMFC Market Volume Share (%), by Export Market Analysis (Value & Volume) 2025 & 2033
- Figure 43: Europe PEMFC Market Revenue (Million), by Price Trend Analysis 2025 & 2033
- Figure 44: Europe PEMFC Market Volume (Gigawatt), by Price Trend Analysis 2025 & 2033
- Figure 45: Europe PEMFC Market Revenue Share (%), by Price Trend Analysis 2025 & 2033
- Figure 46: Europe PEMFC Market Volume Share (%), by Price Trend Analysis 2025 & 2033
- Figure 47: Europe PEMFC Market Revenue (Million), by Country 2025 & 2033
- Figure 48: Europe PEMFC Market Volume (Gigawatt), by Country 2025 & 2033
- Figure 49: Europe PEMFC Market Revenue Share (%), by Country 2025 & 2033
- Figure 50: Europe PEMFC Market Volume Share (%), by Country 2025 & 2033
- Figure 51: Asia Pacific PEMFC Market Revenue (Million), by Production Analysis 2025 & 2033
- Figure 52: Asia Pacific PEMFC Market Volume (Gigawatt), by Production Analysis 2025 & 2033
- Figure 53: Asia Pacific PEMFC Market Revenue Share (%), by Production Analysis 2025 & 2033
- Figure 54: Asia Pacific PEMFC Market Volume Share (%), by Production Analysis 2025 & 2033
- Figure 55: Asia Pacific PEMFC Market Revenue (Million), by Consumption Analysis 2025 & 2033
- Figure 56: Asia Pacific PEMFC Market Volume (Gigawatt), by Consumption Analysis 2025 & 2033
- Figure 57: Asia Pacific PEMFC Market Revenue Share (%), by Consumption Analysis 2025 & 2033
- Figure 58: Asia Pacific PEMFC Market Volume Share (%), by Consumption Analysis 2025 & 2033
- Figure 59: Asia Pacific PEMFC Market Revenue (Million), by Import Market Analysis (Value & Volume) 2025 & 2033
- Figure 60: Asia Pacific PEMFC Market Volume (Gigawatt), by Import Market Analysis (Value & Volume) 2025 & 2033
- Figure 61: Asia Pacific PEMFC Market Revenue Share (%), by Import Market Analysis (Value & Volume) 2025 & 2033
- Figure 62: Asia Pacific PEMFC Market Volume Share (%), by Import Market Analysis (Value & Volume) 2025 & 2033
- Figure 63: Asia Pacific PEMFC Market Revenue (Million), by Export Market Analysis (Value & Volume) 2025 & 2033
- Figure 64: Asia Pacific PEMFC Market Volume (Gigawatt), by Export Market Analysis (Value & Volume) 2025 & 2033
- Figure 65: Asia Pacific PEMFC Market Revenue Share (%), by Export Market Analysis (Value & Volume) 2025 & 2033
- Figure 66: Asia Pacific PEMFC Market Volume Share (%), by Export Market Analysis (Value & Volume) 2025 & 2033
- Figure 67: Asia Pacific PEMFC Market Revenue (Million), by Price Trend Analysis 2025 & 2033
- Figure 68: Asia Pacific PEMFC Market Volume (Gigawatt), by Price Trend Analysis 2025 & 2033
- Figure 69: Asia Pacific PEMFC Market Revenue Share (%), by Price Trend Analysis 2025 & 2033
- Figure 70: Asia Pacific PEMFC Market Volume Share (%), by Price Trend Analysis 2025 & 2033
- Figure 71: Asia Pacific PEMFC Market Revenue (Million), by Country 2025 & 2033
- Figure 72: Asia Pacific PEMFC Market Volume (Gigawatt), by Country 2025 & 2033
- Figure 73: Asia Pacific PEMFC Market Revenue Share (%), by Country 2025 & 2033
- Figure 74: Asia Pacific PEMFC Market Volume Share (%), by Country 2025 & 2033
- Figure 75: Rest of the World PEMFC Market Revenue (Million), by Production Analysis 2025 & 2033
- Figure 76: Rest of the World PEMFC Market Volume (Gigawatt), by Production Analysis 2025 & 2033
- Figure 77: Rest of the World PEMFC Market Revenue Share (%), by Production Analysis 2025 & 2033
- Figure 78: Rest of the World PEMFC Market Volume Share (%), by Production Analysis 2025 & 2033
- Figure 79: Rest of the World PEMFC Market Revenue (Million), by Consumption Analysis 2025 & 2033
- Figure 80: Rest of the World PEMFC Market Volume (Gigawatt), by Consumption Analysis 2025 & 2033
- Figure 81: Rest of the World PEMFC Market Revenue Share (%), by Consumption Analysis 2025 & 2033
- Figure 82: Rest of the World PEMFC Market Volume Share (%), by Consumption Analysis 2025 & 2033
- Figure 83: Rest of the World PEMFC Market Revenue (Million), by Import Market Analysis (Value & Volume) 2025 & 2033
- Figure 84: Rest of the World PEMFC Market Volume (Gigawatt), by Import Market Analysis (Value & Volume) 2025 & 2033
- Figure 85: Rest of the World PEMFC Market Revenue Share (%), by Import Market Analysis (Value & Volume) 2025 & 2033
- Figure 86: Rest of the World PEMFC Market Volume Share (%), by Import Market Analysis (Value & Volume) 2025 & 2033
- Figure 87: Rest of the World PEMFC Market Revenue (Million), by Export Market Analysis (Value & Volume) 2025 & 2033
- Figure 88: Rest of the World PEMFC Market Volume (Gigawatt), by Export Market Analysis (Value & Volume) 2025 & 2033
- Figure 89: Rest of the World PEMFC Market Revenue Share (%), by Export Market Analysis (Value & Volume) 2025 & 2033
- Figure 90: Rest of the World PEMFC Market Volume Share (%), by Export Market Analysis (Value & Volume) 2025 & 2033
- Figure 91: Rest of the World PEMFC Market Revenue (Million), by Price Trend Analysis 2025 & 2033
- Figure 92: Rest of the World PEMFC Market Volume (Gigawatt), by Price Trend Analysis 2025 & 2033
- Figure 93: Rest of the World PEMFC Market Revenue Share (%), by Price Trend Analysis 2025 & 2033
- Figure 94: Rest of the World PEMFC Market Volume Share (%), by Price Trend Analysis 2025 & 2033
- Figure 95: Rest of the World PEMFC Market Revenue (Million), by Country 2025 & 2033
- Figure 96: Rest of the World PEMFC Market Volume (Gigawatt), by Country 2025 & 2033
- Figure 97: Rest of the World PEMFC Market Revenue Share (%), by Country 2025 & 2033
- Figure 98: Rest of the World PEMFC Market Volume Share (%), by Country 2025 & 2033
List of Tables
- Table 1: Global PEMFC Market Revenue Million Forecast, by Production Analysis 2020 & 2033
- Table 2: Global PEMFC Market Volume Gigawatt Forecast, by Production Analysis 2020 & 2033
- Table 3: Global PEMFC Market Revenue Million Forecast, by Consumption Analysis 2020 & 2033
- Table 4: Global PEMFC Market Volume Gigawatt Forecast, by Consumption Analysis 2020 & 2033
- Table 5: Global PEMFC Market Revenue Million Forecast, by Import Market Analysis (Value & Volume) 2020 & 2033
- Table 6: Global PEMFC Market Volume Gigawatt Forecast, by Import Market Analysis (Value & Volume) 2020 & 2033
- Table 7: Global PEMFC Market Revenue Million Forecast, by Export Market Analysis (Value & Volume) 2020 & 2033
- Table 8: Global PEMFC Market Volume Gigawatt Forecast, by Export Market Analysis (Value & Volume) 2020 & 2033
- Table 9: Global PEMFC Market Revenue Million Forecast, by Price Trend Analysis 2020 & 2033
- Table 10: Global PEMFC Market Volume Gigawatt Forecast, by Price Trend Analysis 2020 & 2033
- Table 11: Global PEMFC Market Revenue Million Forecast, by Region 2020 & 2033
- Table 12: Global PEMFC Market Volume Gigawatt Forecast, by Region 2020 & 2033
- Table 13: Global PEMFC Market Revenue Million Forecast, by Production Analysis 2020 & 2033
- Table 14: Global PEMFC Market Volume Gigawatt Forecast, by Production Analysis 2020 & 2033
- Table 15: Global PEMFC Market Revenue Million Forecast, by Consumption Analysis 2020 & 2033
- Table 16: Global PEMFC Market Volume Gigawatt Forecast, by Consumption Analysis 2020 & 2033
- Table 17: Global PEMFC Market Revenue Million Forecast, by Import Market Analysis (Value & Volume) 2020 & 2033
- Table 18: Global PEMFC Market Volume Gigawatt Forecast, by Import Market Analysis (Value & Volume) 2020 & 2033
- Table 19: Global PEMFC Market Revenue Million Forecast, by Export Market Analysis (Value & Volume) 2020 & 2033
- Table 20: Global PEMFC Market Volume Gigawatt Forecast, by Export Market Analysis (Value & Volume) 2020 & 2033
- Table 21: Global PEMFC Market Revenue Million Forecast, by Price Trend Analysis 2020 & 2033
- Table 22: Global PEMFC Market Volume Gigawatt Forecast, by Price Trend Analysis 2020 & 2033
- Table 23: Global PEMFC Market Revenue Million Forecast, by Country 2020 & 2033
- Table 24: Global PEMFC Market Volume Gigawatt Forecast, by Country 2020 & 2033
- Table 25: Global PEMFC Market Revenue Million Forecast, by Production Analysis 2020 & 2033
- Table 26: Global PEMFC Market Volume Gigawatt Forecast, by Production Analysis 2020 & 2033
- Table 27: Global PEMFC Market Revenue Million Forecast, by Consumption Analysis 2020 & 2033
- Table 28: Global PEMFC Market Volume Gigawatt Forecast, by Consumption Analysis 2020 & 2033
- Table 29: Global PEMFC Market Revenue Million Forecast, by Import Market Analysis (Value & Volume) 2020 & 2033
- Table 30: Global PEMFC Market Volume Gigawatt Forecast, by Import Market Analysis (Value & Volume) 2020 & 2033
- Table 31: Global PEMFC Market Revenue Million Forecast, by Export Market Analysis (Value & Volume) 2020 & 2033
- Table 32: Global PEMFC Market Volume Gigawatt Forecast, by Export Market Analysis (Value & Volume) 2020 & 2033
- Table 33: Global PEMFC Market Revenue Million Forecast, by Price Trend Analysis 2020 & 2033
- Table 34: Global PEMFC Market Volume Gigawatt Forecast, by Price Trend Analysis 2020 & 2033
- Table 35: Global PEMFC Market Revenue Million Forecast, by Country 2020 & 2033
- Table 36: Global PEMFC Market Volume Gigawatt Forecast, by Country 2020 & 2033
- Table 37: Global PEMFC Market Revenue Million Forecast, by Production Analysis 2020 & 2033
- Table 38: Global PEMFC Market Volume Gigawatt Forecast, by Production Analysis 2020 & 2033
- Table 39: Global PEMFC Market Revenue Million Forecast, by Consumption Analysis 2020 & 2033
- Table 40: Global PEMFC Market Volume Gigawatt Forecast, by Consumption Analysis 2020 & 2033
- Table 41: Global PEMFC Market Revenue Million Forecast, by Import Market Analysis (Value & Volume) 2020 & 2033
- Table 42: Global PEMFC Market Volume Gigawatt Forecast, by Import Market Analysis (Value & Volume) 2020 & 2033
- Table 43: Global PEMFC Market Revenue Million Forecast, by Export Market Analysis (Value & Volume) 2020 & 2033
- Table 44: Global PEMFC Market Volume Gigawatt Forecast, by Export Market Analysis (Value & Volume) 2020 & 2033
- Table 45: Global PEMFC Market Revenue Million Forecast, by Price Trend Analysis 2020 & 2033
- Table 46: Global PEMFC Market Volume Gigawatt Forecast, by Price Trend Analysis 2020 & 2033
- Table 47: Global PEMFC Market Revenue Million Forecast, by Country 2020 & 2033
- Table 48: Global PEMFC Market Volume Gigawatt Forecast, by Country 2020 & 2033
- Table 49: Global PEMFC Market Revenue Million Forecast, by Production Analysis 2020 & 2033
- Table 50: Global PEMFC Market Volume Gigawatt Forecast, by Production Analysis 2020 & 2033
- Table 51: Global PEMFC Market Revenue Million Forecast, by Consumption Analysis 2020 & 2033
- Table 52: Global PEMFC Market Volume Gigawatt Forecast, by Consumption Analysis 2020 & 2033
- Table 53: Global PEMFC Market Revenue Million Forecast, by Import Market Analysis (Value & Volume) 2020 & 2033
- Table 54: Global PEMFC Market Volume Gigawatt Forecast, by Import Market Analysis (Value & Volume) 2020 & 2033
- Table 55: Global PEMFC Market Revenue Million Forecast, by Export Market Analysis (Value & Volume) 2020 & 2033
- Table 56: Global PEMFC Market Volume Gigawatt Forecast, by Export Market Analysis (Value & Volume) 2020 & 2033
- Table 57: Global PEMFC Market Revenue Million Forecast, by Price Trend Analysis 2020 & 2033
- Table 58: Global PEMFC Market Volume Gigawatt Forecast, by Price Trend Analysis 2020 & 2033
- Table 59: Global PEMFC Market Revenue Million Forecast, by Country 2020 & 2033
- Table 60: Global PEMFC Market Volume Gigawatt Forecast, by Country 2020 & 2033
Frequently Asked Questions
1. What is the projected Compound Annual Growth Rate (CAGR) of the PEMFC Market?
The projected CAGR is approximately 18.43%.
2. Which companies are prominent players in the PEMFC Market?
Key companies in the market include Ballard Power Systems, ITM Power PLC, Toshiba Corporation, Intelligent Energy Limited*List Not Exhaustive, Plug Power Inc, Powercell Sweden AB, Bramble Energy, Cummins Inc, Bloom Energy, Hydrogenics (a Cummins Inc. company).
3. What are the main segments of the PEMFC Market?
The market segments include Production Analysis, Consumption Analysis, Import Market Analysis (Value & Volume), Export Market Analysis (Value & Volume), Price Trend Analysis.
4. Can you provide details about the market size?
The market size is estimated to be USD 3.58 Million as of 2022.
5. What are some drivers contributing to market growth?
4.; Growing Demand for Solar Energy4.; Reducing Solar Panel Costs and Associated Components for Solar Projects.
6. What are the notable trends driving market growth?
Government Initiatives and Growing Private Investments are Expected to Drive the Market.
7. Are there any restraints impacting market growth?
4.; Availability of Pure Silicon to make Solar PV Cells.
8. Can you provide examples of recent developments in the market?
August 2022: The National Renewable Energy Laboratory (NREL) began collaborating with Toyota Motor North America (Toyota) through a cooperative research and development agreement to build, install, and evaluate a 1-megawatt (MW) proton exchange membrane (PEM) fuel cell power generation system at NREL's Flatirons Campus.
9. What pricing options are available for accessing the report?
Pricing options include single-user, multi-user, and enterprise licenses priced at USD 4750, USD 5250, and USD 8750 respectively.
10. Is the market size provided in terms of value or volume?
The market size is provided in terms of value, measured in Million and volume, measured in Gigawatt.
11. Are there any specific market keywords associated with the report?
Yes, the market keyword associated with the report is "PEMFC Market," which aids in identifying and referencing the specific market segment covered.
12. How do I determine which pricing option suits my needs best?
The pricing options vary based on user requirements and access needs. Individual users may opt for single-user licenses, while businesses requiring broader access may choose multi-user or enterprise licenses for cost-effective access to the report.
13. Are there any additional resources or data provided in the PEMFC Market report?
While the report offers comprehensive insights, it's advisable to review the specific contents or supplementary materials provided to ascertain if additional resources or data are available.
14. How can I stay updated on further developments or reports in the PEMFC Market?
To stay informed about further developments, trends, and reports in the PEMFC Market, consider subscribing to industry newsletters, following relevant companies and organizations, or regularly checking reputable industry news sources and publications.
Methodology
Step 1 - Identification of Relevant Samples Size from Population Database


Step 2 - Approaches for Defining Global Market Size (Value, Volume* & Price*)

Note*: In applicable scenarios
Step 3 - Data Sources
Primary Research
- Web Analytics
- Survey Reports
- Research Institute
- Latest Research Reports
- Opinion Leaders
Secondary Research
- Annual Reports
- White Paper
- Latest Press Release
- Industry Association
- Paid Database
- Investor Presentations

Step 4 - Data Triangulation
Involves using different sources of information in order to increase the validity of a study
These sources are likely to be stakeholders in a program - participants, other researchers, program staff, other community members, and so on.
Then we put all data in single framework & apply various statistical tools to find out the dynamic on the market.
During the analysis stage, feedback from the stakeholder groups would be compared to determine areas of agreement as well as areas of divergence