

Key Insights
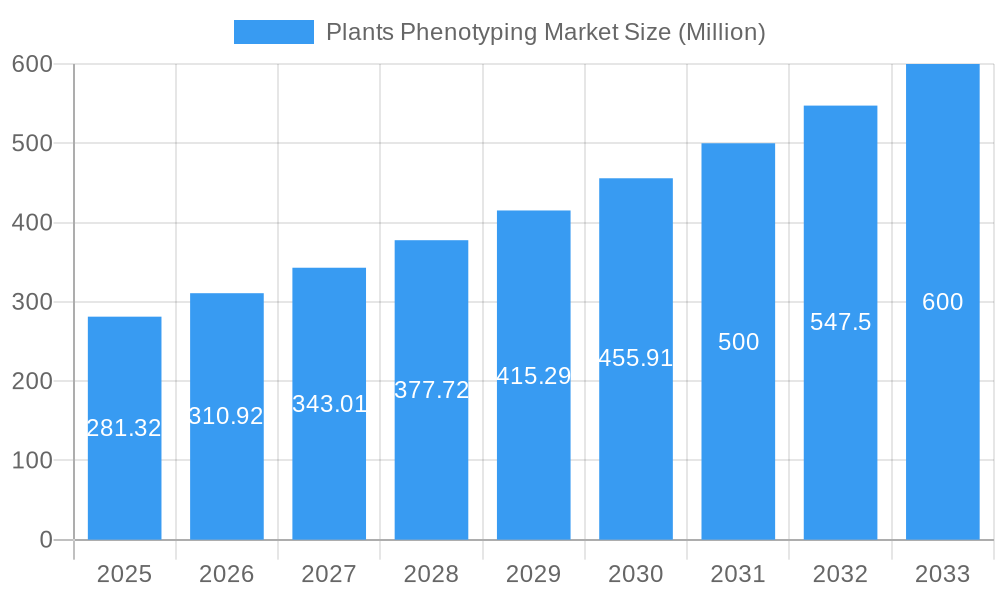
The global Plants Phenotyping market is experiencing robust growth, projected to reach a substantial size with a Compound Annual Growth Rate (CAGR) of 10.50% from 2025 to 2033. This expansion is driven by several key factors. Firstly, the increasing demand for high-throughput screening in agricultural research and development is fueling the adoption of automated phenotyping systems. Researchers are increasingly focusing on improving crop yields and stress tolerance, necessitating advanced technologies for efficient and precise plant trait analysis. The rising adoption of precision agriculture, emphasizing data-driven decision-making in farming practices, further contributes to market growth. Furthermore, advancements in imaging technologies, such as multispectral cameras and image analysis systems, are enabling more comprehensive and detailed plant characterization, leading to more effective breeding programs and improved crop management strategies. The market segmentation reveals significant opportunities across various product types, including equipment, software, and services, with fully automated systems gaining traction due to their efficiency and accuracy. Geographic growth is expected across all regions, with North America and Europe maintaining a strong lead due to established research infrastructure and significant investments in agricultural technology. However, the Asia-Pacific region is poised for significant growth, driven by increasing agricultural production and adoption of advanced technologies in developing economies.
Plants Phenotyping Market Market Size (In Million)
The market’s growth is, however, subject to certain restraints. The high initial investment cost associated with advanced phenotyping systems can be a barrier for smaller research institutions and farmers. Moreover, the complexity of data analysis and interpretation requires specialized expertise, potentially limiting widespread adoption. Nevertheless, the continuous advancements in software solutions, coupled with decreasing hardware costs, are expected to mitigate these challenges over time. The development of user-friendly software and robust data analysis tools will be pivotal in broadening the market's accessibility. The increasing availability of government funding for agricultural research and the growing focus on sustainable agriculture will likely further propel the growth of the Plants Phenotyping market in the coming years. The integration of artificial intelligence and machine learning in plant phenotyping platforms is a significant emerging trend that promises to enhance accuracy, efficiency, and the overall analytical capabilities of these systems.
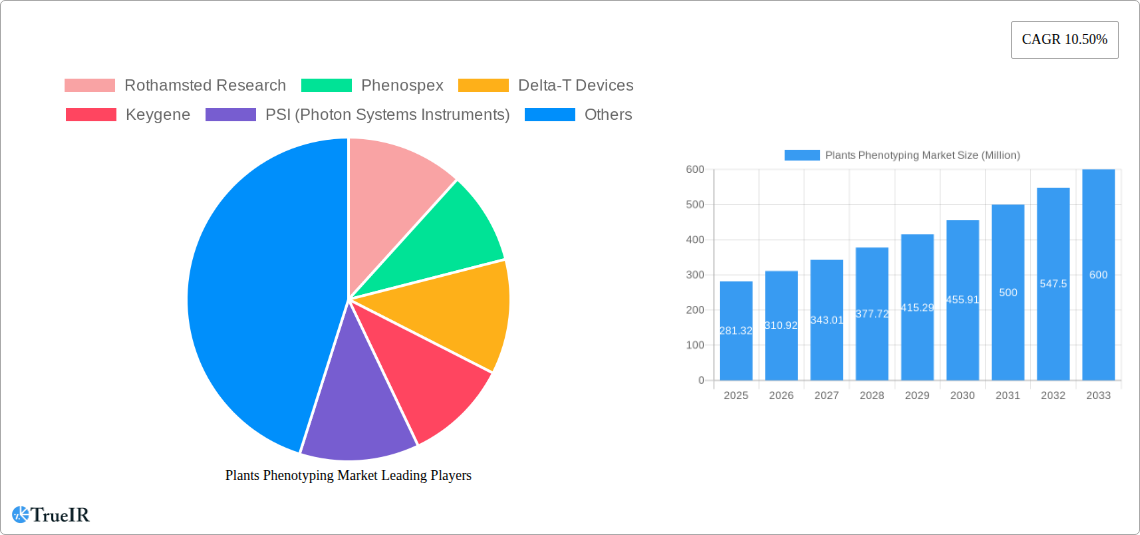
Plants Phenotyping Market Company Market Share
Plants Phenotyping Market: A Comprehensive Report (2019-2033)
This dynamic report provides a thorough analysis of the Plants Phenotyping Market, offering invaluable insights for stakeholders across the agricultural technology sector. The study covers the period from 2019 to 2033, with a focus on the estimated year 2025 and a forecast period of 2025-2033. The report leverages extensive data analysis and expert insights to provide a complete picture of market size, segmentation, key players, growth drivers, and future trends. This detailed assessment will equip businesses with the knowledge to make informed strategic decisions and capitalize on emerging opportunities within this rapidly evolving market. The market is projected to reach xx Million by 2033, exhibiting a CAGR of xx% during the forecast period.
Plants Phenotyping Market Market Structure & Competitive Landscape
The Plants Phenotyping Market presents a moderately fragmented competitive landscape, characterized by the presence of both established leaders in specific segments and numerous agile smaller companies excelling in niche technologies and specialized services. The market's concentration remains relatively low, with no single entity commanding a dominant market share. However, the landscape is dynamic, witnessing an upward trend in mergers and acquisitions (M&A). This consolidation activity, particularly among smaller firms aiming to enhance their capabilities and expand their market reach, is reshaping the competitive dynamics. Historically, the period between 2019 and 2024 saw a notable number of M&A deals, underscoring this growing trend. Innovation serves as a vital catalyst, propelled by continuous breakthroughs in sensor technology, sophisticated data analytics, and advanced automation. The market's trajectory is also significantly influenced by regulatory frameworks, including those governing data privacy and the deployment of genetically modified organisms (GMOs). While traditional breeding methods persist as competitive alternatives, the inherent efficiency and precision offered by phenotyping technologies are increasingly driving their adoption. The market's end-user base is remarkably diverse, spanning academic research institutions, forward-thinking agricultural businesses, and dedicated breeding companies.
- High Degree of Innovation: Ongoing advancements in imaging techniques, sensor technology, and data analysis software are key drivers of market expansion.
- Regulatory Environment: Stringent regulations in various regions can impact market entry strategies and the pace of technology adoption.
- Consolidation Underway: The observed trend of M&A activity signals a movement towards increased market concentration.
- Broad End-User Spectrum: Demand is fueled by a wide array of users, from academic researchers to commercial agricultural enterprises.
- Competition from Traditional Methods: While phenotyping offers superior precision, traditional breeding methods continue to hold a competitive position in the market.
Plants Phenotyping Market Market Trends & Opportunities
The Plants Phenotyping Market is experiencing a period of robust and sustained growth, primarily propelled by the escalating demand for high-throughput screening capabilities and the accurate identification of desirable crop traits essential for agricultural improvement. Technological innovation is a significant force, with the development of increasingly sophisticated sensors, highly automated systems, and advanced analytical software playing a crucial role in market expansion. The widespread adoption of precision agriculture practices and a heightened focus on developing sustainable agricultural solutions further contribute to this growth trajectory. Consumer-driven preferences for healthier and more sustainably produced food also indirectly amplify the demand for improved crop varieties, a fundamental catalyst for the adoption of phenotyping technologies. Competitive dynamics within the market are being shaped by continuous innovation and the formation of strategic partnerships. The industry is characterized by a high level of technological disruption, with new market entrants frequently introducing novel and impactful solutions.
Dominant Markets & Segments in Plants Phenotyping Market
The North American region currently holds a dominant position in the Plants Phenotyping Market, driven by substantial investment in agricultural research and a strong focus on precision agriculture. However, the European and Asian markets are demonstrating significant growth potential, particularly in countries with high agricultural production and a growing emphasis on improving crop yields and quality. Within market segments, the High-Throughput Screening application holds the largest market share, followed by Trait Identification. Among the product categories, Equipment holds the largest share, driven by the increasing demand for automated and high-throughput phenotyping systems. Fully Automated systems are witnessing the fastest growth within the Automation Type segment. Image Analysis Systems are the most widely used analysis systems. The laboratory setting currently dominates site utilization, but greenhouse and field applications are experiencing significant growth. Conveyor-Based/Modular Systems lead in the Platform segment.
- Key Growth Drivers in North America: High R&D spending, strong private investment in agricultural technology, and favorable government policies.
- Growth Potential in Europe & Asia: Increasing awareness of sustainable agricultural practices, rising food security concerns, and government support.
- High-Throughput Screening: The increasing need for efficient screening of large plant populations fuels demand.
- Fully Automated Systems: The adoption of automation is increasing for increased speed and data accuracy.
- Image Analysis Systems: Their versatility and precision in analyzing plant traits lead to extensive use.
Plants Phenotyping Market Product Analysis
The Plants Phenotyping market is witnessing significant technological advancements, particularly in sensor technology, data acquisition systems, and image analysis software. Innovations are focused on improving the speed, accuracy, and cost-effectiveness of plant phenotyping. New products are emerging that combine multiple sensor modalities, automated data acquisition, and sophisticated analytics for a comprehensive analysis of plant traits. These innovations are creating a more efficient and cost-effective method of crop breeding and improvement, expanding the applicability of plant phenotyping in various applications, from fundamental research to commercial agriculture.
Key Drivers, Barriers & Challenges in Plants Phenotyping Market
Key Drivers: Significant advancements in sensor technology, a growing demand for high-throughput screening methodologies, the increasing adoption of precision agriculture techniques, and supportive government initiatives aimed at promoting sustainable agricultural practices are collectively driving the market forward.
Key Barriers and Challenges: The substantial initial investment required for equipment acquisition, a perceived lack of a sufficiently skilled workforce capable of operating complex systems and analyzing intricate data, the inherent complexity of data analysis, and the ongoing need for standardization across diverse platforms present considerable hurdles. Furthermore, supply chain disruptions, which can impact the availability of critical components, pose a significant threat to production continuity and market expansion. For instance, a hypothetical xx% disruption in the supply of essential sensors in 2022 could lead to a substantial reduction in market revenue, estimated at xx Million.
Growth Drivers in the Plants Phenotyping Market Market
The burgeoning need for more efficient and effective crop improvement strategies, spurred by global challenges such as a growing population and the impacts of climate change, is a primary catalyst for market expansion. Technological advancements, particularly in the realms of automation, sophisticated data analytics, and cutting-edge sensor technology, are rendering phenotyping processes more accessible and significantly more efficient. Moreover, government-backed initiatives and dedicated funding programs designed to foster and promote sustainable agricultural practices are also contributing positively to market growth.
Challenges Impacting Plants Phenotyping Market Growth
High initial investment costs for advanced phenotyping systems present a major barrier for many researchers and farmers. The complex nature of the data generated by these systems requires specialized skills and software, leading to a shortage of skilled personnel. Regulatory hurdles and standardization challenges also pose significant obstacles.
Key Players Shaping the Plants Phenotyping Market Market
- Rothamsted Research
- Phenospex
- Delta-T Devices
- Keygene
- PSI (Photon Systems Instruments)
- BASF SE (Crop Design)
- Heinz Walz GmbH
- The Vienna Biocenter Core Facilities
- LemnaTec GmbH
- Phenomix
- WP
- Qubit Systems
Significant Plants Phenotyping Market Industry Milestones
- 2020, Q4: LemnaTec GmbH launched its new high-throughput phenotyping platform, significantly improving data acquisition speed.
- 2021, Q2: A major merger between two smaller phenotyping companies expanded the market’s service offerings.
- 2022, Q3: PSI (Photon Systems Instruments) introduced a new generation of hyperspectral cameras, boosting image resolution and accuracy.
- 2023, Q1: Several key players announced new software partnerships, enhancing data analysis capabilities.
Future Outlook for Plants Phenotyping Market Market
The Plants Phenotyping Market is poised for sustained growth, driven by ongoing technological innovation, increasing demand for high-throughput screening, and the urgent need for improved crop varieties to address food security challenges. Strategic partnerships, acquisitions, and the development of user-friendly software will likely play a significant role in shaping the future of this market. The market holds substantial potential for expansion, particularly in developing economies with large agricultural sectors and growing investments in agricultural technology.
Plants Phenotyping Market Segmentation
- 1. Production Analysis
- 2. Consumption Analysis
- 3. Import Market Analysis (Value & Volume)
- 4. Export Market Analysis (Value & Volume)
- 5. Price Trend Analysis
Plants Phenotyping Market Segmentation By Geography
-
1. North America
- 1.1. United States
- 1.2. Canada
- 1.3. Mexico
-
2. South America
- 2.1. Brazil
- 2.2. Argentina
- 2.3. Rest of South America
-
3. Europe
- 3.1. United Kingdom
- 3.2. Germany
- 3.3. France
- 3.4. Italy
- 3.5. Spain
- 3.6. Russia
- 3.7. Benelux
- 3.8. Nordics
- 3.9. Rest of Europe
-
4. Middle East & Africa
- 4.1. Turkey
- 4.2. Israel
- 4.3. GCC
- 4.4. North Africa
- 4.5. South Africa
- 4.6. Rest of Middle East & Africa
-
5. Asia Pacific
- 5.1. China
- 5.2. India
- 5.3. Japan
- 5.4. South Korea
- 5.5. ASEAN
- 5.6. Oceania
- 5.7. Rest of Asia Pacific
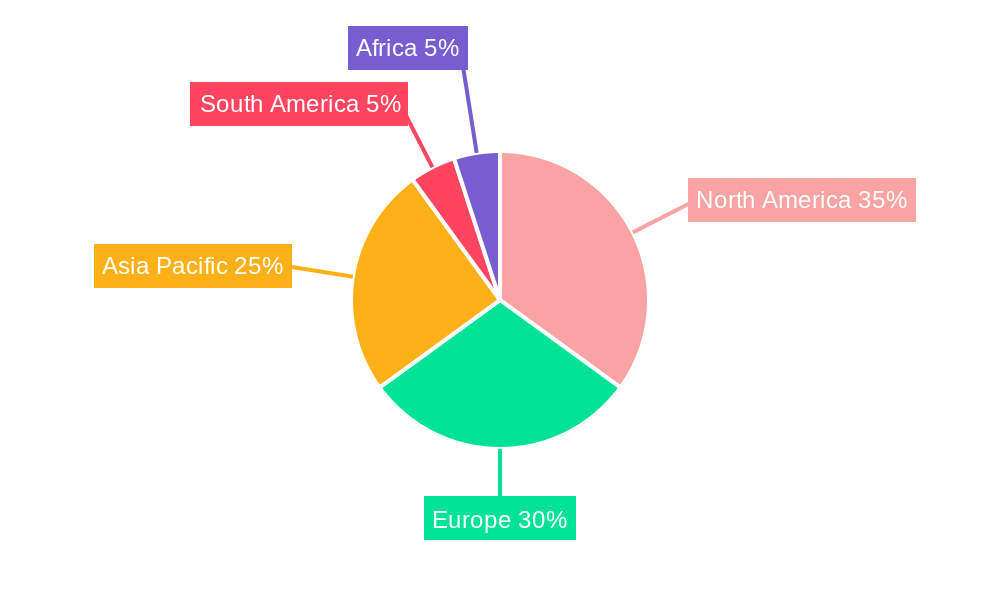
Plants Phenotyping Market Regional Market Share
Geographic Coverage of Plants Phenotyping Market
Plants Phenotyping Market REPORT HIGHLIGHTS
| Aspects | Details |
|---|---|
| Study Period | 2020-2034 |
| Base Year | 2025 |
| Estimated Year | 2026 |
| Forecast Period | 2026-2034 |
| Historical Period | 2020-2025 |
| Growth Rate | CAGR of 10.50% from 2020-2034 |
| Segmentation |
|
Table of Contents
- 1. Introduction
- 1.1. Research Scope
- 1.2. Market Segmentation
- 1.3. Research Objective
- 1.4. Definitions and Assumptions
- 2. Executive Summary
- 2.1. Market Snapshot
- 3. Market Dynamics
- 3.1. Market Drivers
- 3.2. Market Restrains
- 3.3. Market Trends
- 3.4. Market Opportunities
- 4. Market Factor Analysis
- 4.1. Porters Five Forces
- 4.1.1. Bargaining Power of Suppliers
- 4.1.2. Bargaining Power of Buyers
- 4.1.3. Threat of New Entrants
- 4.1.4. Threat of Substitutes
- 4.1.5. Competitive Rivalry
- 4.2. PESTEL analysis
- 4.3. BCG Analysis
- 4.3.1. Stars (High Growth, High Market Share)
- 4.3.2. Cash Cows (Low Growth, High Market Share)
- 4.3.3. Question Mark (High Growth, Low Market Share)
- 4.3.4. Dogs (Low Growth, Low Market Share)
- 4.4. Ansoff Matrix Analysis
- 4.5. Supply Chain Analysis
- 4.6. Regulatory Landscape
- 4.7. Current Market Potential and Opportunity Assessment (TAM–SAM–SOM Framework)
- 4.8. TIR Analyst Note
- 4.1. Porters Five Forces
- 5. Market Analysis, Insights and Forecast 2021-2033
- 5.1. Market Analysis, Insights and Forecast - by Production Analysis
- 5.2. Market Analysis, Insights and Forecast - by Consumption Analysis
- 5.3. Market Analysis, Insights and Forecast - by Import Market Analysis (Value & Volume)
- 5.4. Market Analysis, Insights and Forecast - by Export Market Analysis (Value & Volume)
- 5.5. Market Analysis, Insights and Forecast - by Price Trend Analysis
- 5.6. Market Analysis, Insights and Forecast - by Region
- 5.6.1. North America
- 5.6.2. South America
- 5.6.3. Europe
- 5.6.4. Middle East & Africa
- 5.6.5. Asia Pacific
- 6. Global Plants Phenotyping Market Analysis, Insights and Forecast, 2021-2033
- 6.1. Market Analysis, Insights and Forecast - by Production Analysis
- 6.2. Market Analysis, Insights and Forecast - by Consumption Analysis
- 6.3. Market Analysis, Insights and Forecast - by Import Market Analysis (Value & Volume)
- 6.4. Market Analysis, Insights and Forecast - by Export Market Analysis (Value & Volume)
- 6.5. Market Analysis, Insights and Forecast - by Price Trend Analysis
- 7. North America Plants Phenotyping Market Analysis, Insights and Forecast, 2020-2032
- 7.1. Market Analysis, Insights and Forecast - by Production Analysis
- 7.2. Market Analysis, Insights and Forecast - by Consumption Analysis
- 7.3. Market Analysis, Insights and Forecast - by Import Market Analysis (Value & Volume)
- 7.4. Market Analysis, Insights and Forecast - by Export Market Analysis (Value & Volume)
- 7.5. Market Analysis, Insights and Forecast - by Price Trend Analysis
- 8. South America Plants Phenotyping Market Analysis, Insights and Forecast, 2020-2032
- 8.1. Market Analysis, Insights and Forecast - by Production Analysis
- 8.2. Market Analysis, Insights and Forecast - by Consumption Analysis
- 8.3. Market Analysis, Insights and Forecast - by Import Market Analysis (Value & Volume)
- 8.4. Market Analysis, Insights and Forecast - by Export Market Analysis (Value & Volume)
- 8.5. Market Analysis, Insights and Forecast - by Price Trend Analysis
- 9. Europe Plants Phenotyping Market Analysis, Insights and Forecast, 2020-2032
- 9.1. Market Analysis, Insights and Forecast - by Production Analysis
- 9.2. Market Analysis, Insights and Forecast - by Consumption Analysis
- 9.3. Market Analysis, Insights and Forecast - by Import Market Analysis (Value & Volume)
- 9.4. Market Analysis, Insights and Forecast - by Export Market Analysis (Value & Volume)
- 9.5. Market Analysis, Insights and Forecast - by Price Trend Analysis
- 10. Middle East & Africa Plants Phenotyping Market Analysis, Insights and Forecast, 2020-2032
- 10.1. Market Analysis, Insights and Forecast - by Production Analysis
- 10.2. Market Analysis, Insights and Forecast - by Consumption Analysis
- 10.3. Market Analysis, Insights and Forecast - by Import Market Analysis (Value & Volume)
- 10.4. Market Analysis, Insights and Forecast - by Export Market Analysis (Value & Volume)
- 10.5. Market Analysis, Insights and Forecast - by Price Trend Analysis
- 11. Asia Pacific Plants Phenotyping Market Analysis, Insights and Forecast, 2020-2032
- 11.1. Market Analysis, Insights and Forecast - by Production Analysis
- 11.2. Market Analysis, Insights and Forecast - by Consumption Analysis
- 11.3. Market Analysis, Insights and Forecast - by Import Market Analysis (Value & Volume)
- 11.4. Market Analysis, Insights and Forecast - by Export Market Analysis (Value & Volume)
- 11.5. Market Analysis, Insights and Forecast - by Price Trend Analysis
- 12. Competitive Analysis
- 12.1. Company Profiles
- 12.1.1 Rothamsted Research
- 12.1.1.1. Company Overview
- 12.1.1.2. Products
- 12.1.1.3. Company Financials
- 12.1.1.4. SWOT Analysis
- 12.1.2 Phenospex
- 12.1.2.1. Company Overview
- 12.1.2.2. Products
- 12.1.2.3. Company Financials
- 12.1.2.4. SWOT Analysis
- 12.1.3 Delta-T Devices
- 12.1.3.1. Company Overview
- 12.1.3.2. Products
- 12.1.3.3. Company Financials
- 12.1.3.4. SWOT Analysis
- 12.1.4 Keygene
- 12.1.4.1. Company Overview
- 12.1.4.2. Products
- 12.1.4.3. Company Financials
- 12.1.4.4. SWOT Analysis
- 12.1.5 PSI (Photon Systems Instruments)
- 12.1.5.1. Company Overview
- 12.1.5.2. Products
- 12.1.5.3. Company Financials
- 12.1.5.4. SWOT Analysis
- 12.1.6 BASF SE (Crop Design)
- 12.1.6.1. Company Overview
- 12.1.6.2. Products
- 12.1.6.3. Company Financials
- 12.1.6.4. SWOT Analysis
- 12.1.7 Heinz Walz GmbH
- 12.1.7.1. Company Overview
- 12.1.7.2. Products
- 12.1.7.3. Company Financials
- 12.1.7.4. SWOT Analysis
- 12.1.8 The Vienna Biocenter Core Facilities
- 12.1.8.1. Company Overview
- 12.1.8.2. Products
- 12.1.8.3. Company Financials
- 12.1.8.4. SWOT Analysis
- 12.1.9 LemnaTec GmbH
- 12.1.9.1. Company Overview
- 12.1.9.2. Products
- 12.1.9.3. Company Financials
- 12.1.9.4. SWOT Analysis
- 12.1.10 Phenomix
- 12.1.10.1. Company Overview
- 12.1.10.2. Products
- 12.1.10.3. Company Financials
- 12.1.10.4. SWOT Analysis
- 12.1.11 WP
- 12.1.11.1. Company Overview
- 12.1.11.2. Products
- 12.1.11.3. Company Financials
- 12.1.11.4. SWOT Analysis
- 12.1.12 Qubit Systems
- 12.1.12.1. Company Overview
- 12.1.12.2. Products
- 12.1.12.3. Company Financials
- 12.1.12.4. SWOT Analysis
- 12.1.1 Rothamsted Research
- 12.2. Market Entropy
- 12.2.1 Company's Key Areas Served
- 12.2.2 Recent Developments
- 12.3. Company Market Share Analysis 2025
- 12.3.1 Top 5 Companies Market Share Analysis
- 12.3.2 Top 3 Companies Market Share Analysis
- 12.4. List of Potential Customers
- 13. Research Methodology
List of Figures
- Figure 1: Global Plants Phenotyping Market Revenue Breakdown (Million, %) by Region 2025 & 2033
- Figure 2: North America Plants Phenotyping Market Revenue (Million), by Production Analysis 2025 & 2033
- Figure 3: North America Plants Phenotyping Market Revenue Share (%), by Production Analysis 2025 & 2033
- Figure 4: North America Plants Phenotyping Market Revenue (Million), by Consumption Analysis 2025 & 2033
- Figure 5: North America Plants Phenotyping Market Revenue Share (%), by Consumption Analysis 2025 & 2033
- Figure 6: North America Plants Phenotyping Market Revenue (Million), by Import Market Analysis (Value & Volume) 2025 & 2033
- Figure 7: North America Plants Phenotyping Market Revenue Share (%), by Import Market Analysis (Value & Volume) 2025 & 2033
- Figure 8: North America Plants Phenotyping Market Revenue (Million), by Export Market Analysis (Value & Volume) 2025 & 2033
- Figure 9: North America Plants Phenotyping Market Revenue Share (%), by Export Market Analysis (Value & Volume) 2025 & 2033
- Figure 10: North America Plants Phenotyping Market Revenue (Million), by Price Trend Analysis 2025 & 2033
- Figure 11: North America Plants Phenotyping Market Revenue Share (%), by Price Trend Analysis 2025 & 2033
- Figure 12: North America Plants Phenotyping Market Revenue (Million), by Country 2025 & 2033
- Figure 13: North America Plants Phenotyping Market Revenue Share (%), by Country 2025 & 2033
- Figure 14: South America Plants Phenotyping Market Revenue (Million), by Production Analysis 2025 & 2033
- Figure 15: South America Plants Phenotyping Market Revenue Share (%), by Production Analysis 2025 & 2033
- Figure 16: South America Plants Phenotyping Market Revenue (Million), by Consumption Analysis 2025 & 2033
- Figure 17: South America Plants Phenotyping Market Revenue Share (%), by Consumption Analysis 2025 & 2033
- Figure 18: South America Plants Phenotyping Market Revenue (Million), by Import Market Analysis (Value & Volume) 2025 & 2033
- Figure 19: South America Plants Phenotyping Market Revenue Share (%), by Import Market Analysis (Value & Volume) 2025 & 2033
- Figure 20: South America Plants Phenotyping Market Revenue (Million), by Export Market Analysis (Value & Volume) 2025 & 2033
- Figure 21: South America Plants Phenotyping Market Revenue Share (%), by Export Market Analysis (Value & Volume) 2025 & 2033
- Figure 22: South America Plants Phenotyping Market Revenue (Million), by Price Trend Analysis 2025 & 2033
- Figure 23: South America Plants Phenotyping Market Revenue Share (%), by Price Trend Analysis 2025 & 2033
- Figure 24: South America Plants Phenotyping Market Revenue (Million), by Country 2025 & 2033
- Figure 25: South America Plants Phenotyping Market Revenue Share (%), by Country 2025 & 2033
- Figure 26: Europe Plants Phenotyping Market Revenue (Million), by Production Analysis 2025 & 2033
- Figure 27: Europe Plants Phenotyping Market Revenue Share (%), by Production Analysis 2025 & 2033
- Figure 28: Europe Plants Phenotyping Market Revenue (Million), by Consumption Analysis 2025 & 2033
- Figure 29: Europe Plants Phenotyping Market Revenue Share (%), by Consumption Analysis 2025 & 2033
- Figure 30: Europe Plants Phenotyping Market Revenue (Million), by Import Market Analysis (Value & Volume) 2025 & 2033
- Figure 31: Europe Plants Phenotyping Market Revenue Share (%), by Import Market Analysis (Value & Volume) 2025 & 2033
- Figure 32: Europe Plants Phenotyping Market Revenue (Million), by Export Market Analysis (Value & Volume) 2025 & 2033
- Figure 33: Europe Plants Phenotyping Market Revenue Share (%), by Export Market Analysis (Value & Volume) 2025 & 2033
- Figure 34: Europe Plants Phenotyping Market Revenue (Million), by Price Trend Analysis 2025 & 2033
- Figure 35: Europe Plants Phenotyping Market Revenue Share (%), by Price Trend Analysis 2025 & 2033
- Figure 36: Europe Plants Phenotyping Market Revenue (Million), by Country 2025 & 2033
- Figure 37: Europe Plants Phenotyping Market Revenue Share (%), by Country 2025 & 2033
- Figure 38: Middle East & Africa Plants Phenotyping Market Revenue (Million), by Production Analysis 2025 & 2033
- Figure 39: Middle East & Africa Plants Phenotyping Market Revenue Share (%), by Production Analysis 2025 & 2033
- Figure 40: Middle East & Africa Plants Phenotyping Market Revenue (Million), by Consumption Analysis 2025 & 2033
- Figure 41: Middle East & Africa Plants Phenotyping Market Revenue Share (%), by Consumption Analysis 2025 & 2033
- Figure 42: Middle East & Africa Plants Phenotyping Market Revenue (Million), by Import Market Analysis (Value & Volume) 2025 & 2033
- Figure 43: Middle East & Africa Plants Phenotyping Market Revenue Share (%), by Import Market Analysis (Value & Volume) 2025 & 2033
- Figure 44: Middle East & Africa Plants Phenotyping Market Revenue (Million), by Export Market Analysis (Value & Volume) 2025 & 2033
- Figure 45: Middle East & Africa Plants Phenotyping Market Revenue Share (%), by Export Market Analysis (Value & Volume) 2025 & 2033
- Figure 46: Middle East & Africa Plants Phenotyping Market Revenue (Million), by Price Trend Analysis 2025 & 2033
- Figure 47: Middle East & Africa Plants Phenotyping Market Revenue Share (%), by Price Trend Analysis 2025 & 2033
- Figure 48: Middle East & Africa Plants Phenotyping Market Revenue (Million), by Country 2025 & 2033
- Figure 49: Middle East & Africa Plants Phenotyping Market Revenue Share (%), by Country 2025 & 2033
- Figure 50: Asia Pacific Plants Phenotyping Market Revenue (Million), by Production Analysis 2025 & 2033
- Figure 51: Asia Pacific Plants Phenotyping Market Revenue Share (%), by Production Analysis 2025 & 2033
- Figure 52: Asia Pacific Plants Phenotyping Market Revenue (Million), by Consumption Analysis 2025 & 2033
- Figure 53: Asia Pacific Plants Phenotyping Market Revenue Share (%), by Consumption Analysis 2025 & 2033
- Figure 54: Asia Pacific Plants Phenotyping Market Revenue (Million), by Import Market Analysis (Value & Volume) 2025 & 2033
- Figure 55: Asia Pacific Plants Phenotyping Market Revenue Share (%), by Import Market Analysis (Value & Volume) 2025 & 2033
- Figure 56: Asia Pacific Plants Phenotyping Market Revenue (Million), by Export Market Analysis (Value & Volume) 2025 & 2033
- Figure 57: Asia Pacific Plants Phenotyping Market Revenue Share (%), by Export Market Analysis (Value & Volume) 2025 & 2033
- Figure 58: Asia Pacific Plants Phenotyping Market Revenue (Million), by Price Trend Analysis 2025 & 2033
- Figure 59: Asia Pacific Plants Phenotyping Market Revenue Share (%), by Price Trend Analysis 2025 & 2033
- Figure 60: Asia Pacific Plants Phenotyping Market Revenue (Million), by Country 2025 & 2033
- Figure 61: Asia Pacific Plants Phenotyping Market Revenue Share (%), by Country 2025 & 2033
List of Tables
- Table 1: Global Plants Phenotyping Market Revenue Million Forecast, by Production Analysis 2020 & 2033
- Table 2: Global Plants Phenotyping Market Revenue Million Forecast, by Consumption Analysis 2020 & 2033
- Table 3: Global Plants Phenotyping Market Revenue Million Forecast, by Import Market Analysis (Value & Volume) 2020 & 2033
- Table 4: Global Plants Phenotyping Market Revenue Million Forecast, by Export Market Analysis (Value & Volume) 2020 & 2033
- Table 5: Global Plants Phenotyping Market Revenue Million Forecast, by Price Trend Analysis 2020 & 2033
- Table 6: Global Plants Phenotyping Market Revenue Million Forecast, by Region 2020 & 2033
- Table 7: Global Plants Phenotyping Market Revenue Million Forecast, by Production Analysis 2020 & 2033
- Table 8: Global Plants Phenotyping Market Revenue Million Forecast, by Consumption Analysis 2020 & 2033
- Table 9: Global Plants Phenotyping Market Revenue Million Forecast, by Import Market Analysis (Value & Volume) 2020 & 2033
- Table 10: Global Plants Phenotyping Market Revenue Million Forecast, by Export Market Analysis (Value & Volume) 2020 & 2033
- Table 11: Global Plants Phenotyping Market Revenue Million Forecast, by Price Trend Analysis 2020 & 2033
- Table 12: Global Plants Phenotyping Market Revenue Million Forecast, by Country 2020 & 2033
- Table 13: United States Plants Phenotyping Market Revenue (Million) Forecast, by Application 2020 & 2033
- Table 14: Canada Plants Phenotyping Market Revenue (Million) Forecast, by Application 2020 & 2033
- Table 15: Mexico Plants Phenotyping Market Revenue (Million) Forecast, by Application 2020 & 2033
- Table 16: Global Plants Phenotyping Market Revenue Million Forecast, by Production Analysis 2020 & 2033
- Table 17: Global Plants Phenotyping Market Revenue Million Forecast, by Consumption Analysis 2020 & 2033
- Table 18: Global Plants Phenotyping Market Revenue Million Forecast, by Import Market Analysis (Value & Volume) 2020 & 2033
- Table 19: Global Plants Phenotyping Market Revenue Million Forecast, by Export Market Analysis (Value & Volume) 2020 & 2033
- Table 20: Global Plants Phenotyping Market Revenue Million Forecast, by Price Trend Analysis 2020 & 2033
- Table 21: Global Plants Phenotyping Market Revenue Million Forecast, by Country 2020 & 2033
- Table 22: Brazil Plants Phenotyping Market Revenue (Million) Forecast, by Application 2020 & 2033
- Table 23: Argentina Plants Phenotyping Market Revenue (Million) Forecast, by Application 2020 & 2033
- Table 24: Rest of South America Plants Phenotyping Market Revenue (Million) Forecast, by Application 2020 & 2033
- Table 25: Global Plants Phenotyping Market Revenue Million Forecast, by Production Analysis 2020 & 2033
- Table 26: Global Plants Phenotyping Market Revenue Million Forecast, by Consumption Analysis 2020 & 2033
- Table 27: Global Plants Phenotyping Market Revenue Million Forecast, by Import Market Analysis (Value & Volume) 2020 & 2033
- Table 28: Global Plants Phenotyping Market Revenue Million Forecast, by Export Market Analysis (Value & Volume) 2020 & 2033
- Table 29: Global Plants Phenotyping Market Revenue Million Forecast, by Price Trend Analysis 2020 & 2033
- Table 30: Global Plants Phenotyping Market Revenue Million Forecast, by Country 2020 & 2033
- Table 31: United Kingdom Plants Phenotyping Market Revenue (Million) Forecast, by Application 2020 & 2033
- Table 32: Germany Plants Phenotyping Market Revenue (Million) Forecast, by Application 2020 & 2033
- Table 33: France Plants Phenotyping Market Revenue (Million) Forecast, by Application 2020 & 2033
- Table 34: Italy Plants Phenotyping Market Revenue (Million) Forecast, by Application 2020 & 2033
- Table 35: Spain Plants Phenotyping Market Revenue (Million) Forecast, by Application 2020 & 2033
- Table 36: Russia Plants Phenotyping Market Revenue (Million) Forecast, by Application 2020 & 2033
- Table 37: Benelux Plants Phenotyping Market Revenue (Million) Forecast, by Application 2020 & 2033
- Table 38: Nordics Plants Phenotyping Market Revenue (Million) Forecast, by Application 2020 & 2033
- Table 39: Rest of Europe Plants Phenotyping Market Revenue (Million) Forecast, by Application 2020 & 2033
- Table 40: Global Plants Phenotyping Market Revenue Million Forecast, by Production Analysis 2020 & 2033
- Table 41: Global Plants Phenotyping Market Revenue Million Forecast, by Consumption Analysis 2020 & 2033
- Table 42: Global Plants Phenotyping Market Revenue Million Forecast, by Import Market Analysis (Value & Volume) 2020 & 2033
- Table 43: Global Plants Phenotyping Market Revenue Million Forecast, by Export Market Analysis (Value & Volume) 2020 & 2033
- Table 44: Global Plants Phenotyping Market Revenue Million Forecast, by Price Trend Analysis 2020 & 2033
- Table 45: Global Plants Phenotyping Market Revenue Million Forecast, by Country 2020 & 2033
- Table 46: Turkey Plants Phenotyping Market Revenue (Million) Forecast, by Application 2020 & 2033
- Table 47: Israel Plants Phenotyping Market Revenue (Million) Forecast, by Application 2020 & 2033
- Table 48: GCC Plants Phenotyping Market Revenue (Million) Forecast, by Application 2020 & 2033
- Table 49: North Africa Plants Phenotyping Market Revenue (Million) Forecast, by Application 2020 & 2033
- Table 50: South Africa Plants Phenotyping Market Revenue (Million) Forecast, by Application 2020 & 2033
- Table 51: Rest of Middle East & Africa Plants Phenotyping Market Revenue (Million) Forecast, by Application 2020 & 2033
- Table 52: Global Plants Phenotyping Market Revenue Million Forecast, by Production Analysis 2020 & 2033
- Table 53: Global Plants Phenotyping Market Revenue Million Forecast, by Consumption Analysis 2020 & 2033
- Table 54: Global Plants Phenotyping Market Revenue Million Forecast, by Import Market Analysis (Value & Volume) 2020 & 2033
- Table 55: Global Plants Phenotyping Market Revenue Million Forecast, by Export Market Analysis (Value & Volume) 2020 & 2033
- Table 56: Global Plants Phenotyping Market Revenue Million Forecast, by Price Trend Analysis 2020 & 2033
- Table 57: Global Plants Phenotyping Market Revenue Million Forecast, by Country 2020 & 2033
- Table 58: China Plants Phenotyping Market Revenue (Million) Forecast, by Application 2020 & 2033
- Table 59: India Plants Phenotyping Market Revenue (Million) Forecast, by Application 2020 & 2033
- Table 60: Japan Plants Phenotyping Market Revenue (Million) Forecast, by Application 2020 & 2033
- Table 61: South Korea Plants Phenotyping Market Revenue (Million) Forecast, by Application 2020 & 2033
- Table 62: ASEAN Plants Phenotyping Market Revenue (Million) Forecast, by Application 2020 & 2033
- Table 63: Oceania Plants Phenotyping Market Revenue (Million) Forecast, by Application 2020 & 2033
- Table 64: Rest of Asia Pacific Plants Phenotyping Market Revenue (Million) Forecast, by Application 2020 & 2033
Frequently Asked Questions
1. What is the projected Compound Annual Growth Rate (CAGR) of the Plants Phenotyping Market?
The projected CAGR is approximately 10.50%.
2. Which companies are prominent players in the Plants Phenotyping Market?
Key companies in the market include Rothamsted Research, Phenospex, Delta-T Devices, Keygene, PSI (Photon Systems Instruments), BASF SE (Crop Design), Heinz Walz GmbH, The Vienna Biocenter Core Facilities, LemnaTec GmbH, Phenomix, WP, Qubit Systems.
3. What are the main segments of the Plants Phenotyping Market?
The market segments include Production Analysis, Consumption Analysis, Import Market Analysis (Value & Volume), Export Market Analysis (Value & Volume), Price Trend Analysis.
4. Can you provide details about the market size?
The market size is estimated to be USD 281.32 Million as of 2022.
5. What are some drivers contributing to market growth?
Demand For Landscaping Maintenance; Adoption of Green Spaces and Green Roofs.
6. What are the notable trends driving market growth?
Increasing Number of Seed Borne Diseases is Driving the Market.
7. Are there any restraints impacting market growth?
Shortage of Labor In Landscaping; High Maintenance Cost of Lawn Mowers.
8. Can you provide examples of recent developments in the market?
N/A
9. What pricing options are available for accessing the report?
Pricing options include single-user, multi-user, and enterprise licenses priced at USD 4750, USD 5250, and USD 8750 respectively.
10. Is the market size provided in terms of value or volume?
The market size is provided in terms of value, measured in Million.
11. Are there any specific market keywords associated with the report?
Yes, the market keyword associated with the report is "Plants Phenotyping Market," which aids in identifying and referencing the specific market segment covered.
12. How do I determine which pricing option suits my needs best?
The pricing options vary based on user requirements and access needs. Individual users may opt for single-user licenses, while businesses requiring broader access may choose multi-user or enterprise licenses for cost-effective access to the report.
13. Are there any additional resources or data provided in the Plants Phenotyping Market report?
While the report offers comprehensive insights, it's advisable to review the specific contents or supplementary materials provided to ascertain if additional resources or data are available.
14. How can I stay updated on further developments or reports in the Plants Phenotyping Market?
To stay informed about further developments, trends, and reports in the Plants Phenotyping Market, consider subscribing to industry newsletters, following relevant companies and organizations, or regularly checking reputable industry news sources and publications.
Methodology
Step 1 - Identification of Relevant Samples Size from Population Database


Step 2 - Approaches for Defining Global Market Size (Value, Volume* & Price*)

Note*: In applicable scenarios
Step 3 - Data Sources
Primary Research
- Web Analytics
- Survey Reports
- Research Institute
- Latest Research Reports
- Opinion Leaders
Secondary Research
- Annual Reports
- White Paper
- Latest Press Release
- Industry Association
- Paid Database
- Investor Presentations

Step 4 - Data Triangulation
Involves using different sources of information in order to increase the validity of a study
These sources are likely to be stakeholders in a program - participants, other researchers, program staff, other community members, and so on.
Then we put all data in single framework & apply various statistical tools to find out the dynamic on the market.
During the analysis stage, feedback from the stakeholder groups would be compared to determine areas of agreement as well as areas of divergence