

Key Insights
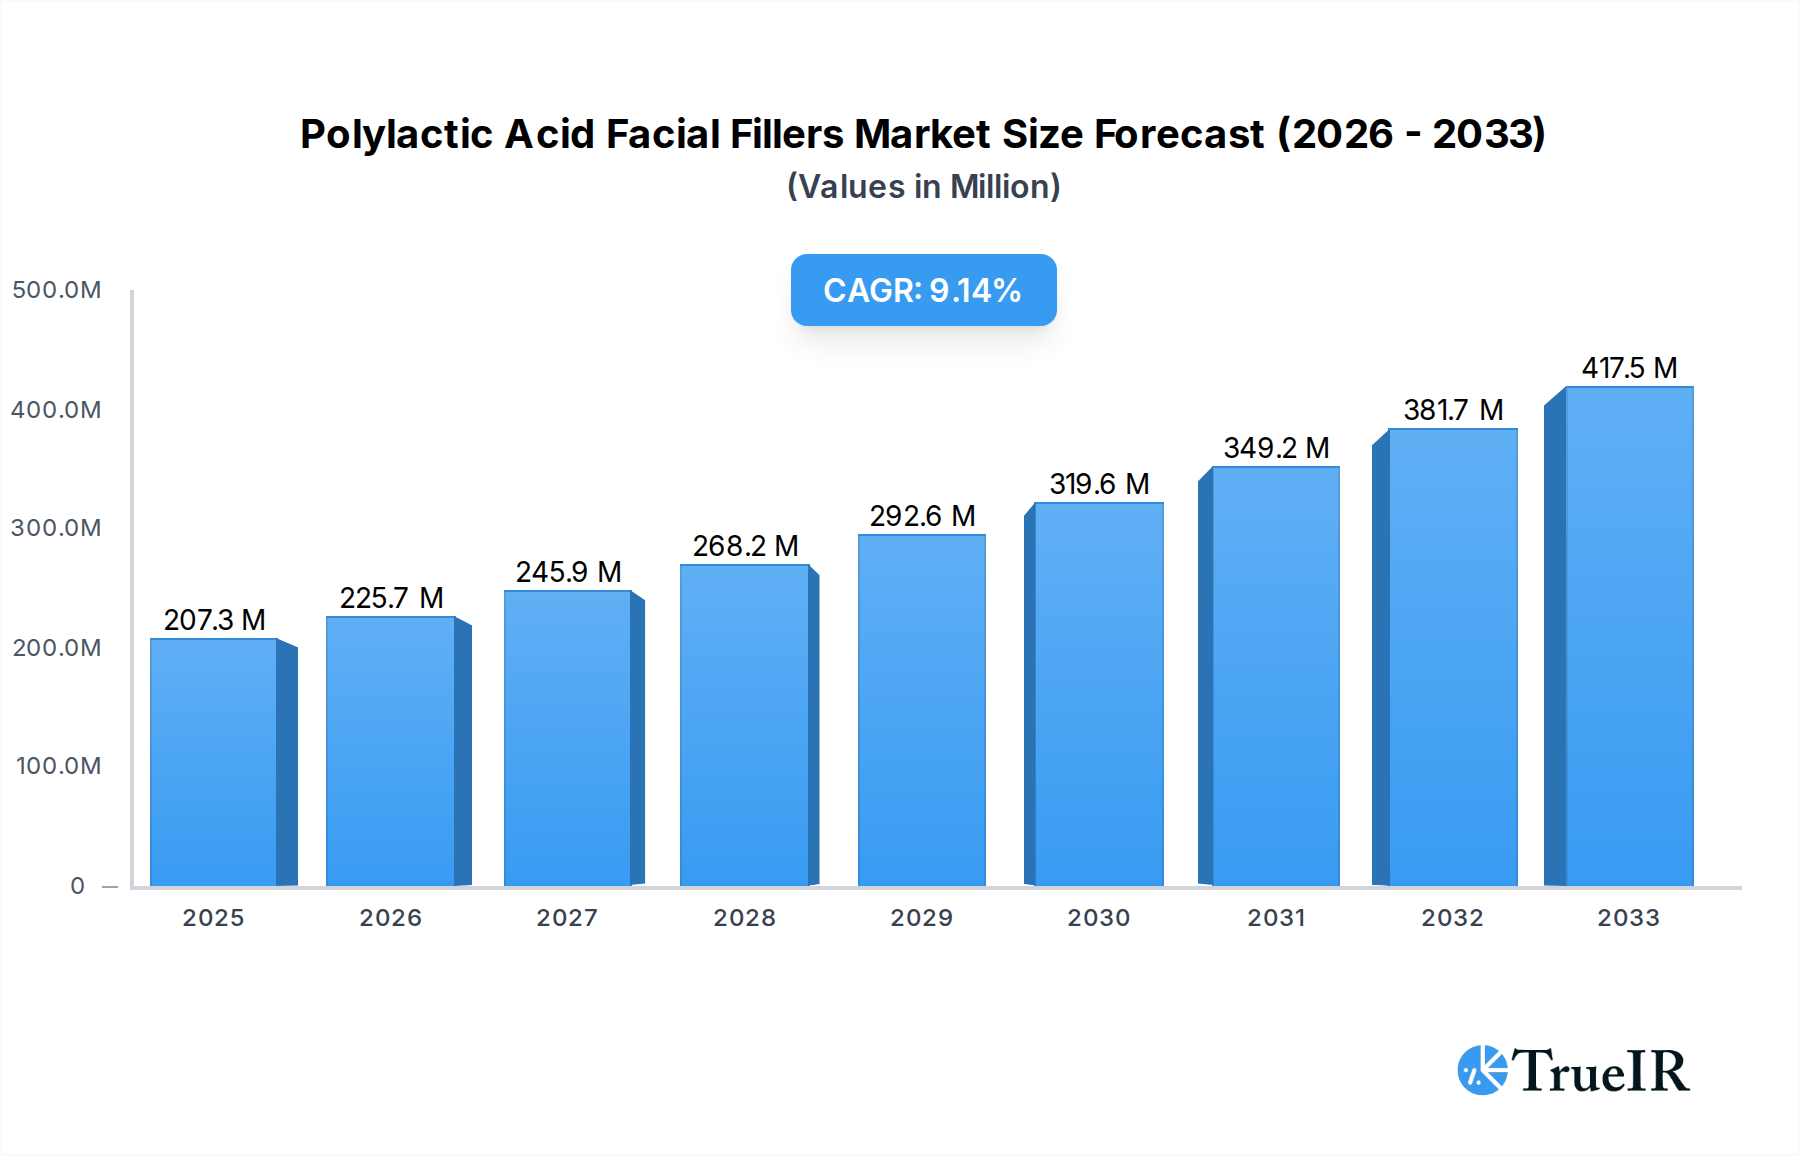
The Polylactic Acid (PLA) facial fillers market is poised for significant expansion, with a **market size of *207.3 million* in 2025** and projected to grow at a robust CAGR of 8.9% through 2033. This growth is primarily fueled by an increasing global demand for non-surgical aesthetic procedures, driven by rising consumer disposable incomes, a growing awareness of aesthetic enhancement, and a preference for minimally invasive treatments offering natural-looking results and longer-lasting effects compared to traditional hyaluronic acid fillers. The inherent properties of PLA, such as its collagen-stimulating capabilities, provide a gradual and sustained improvement in facial volume and skin texture, making it an attractive option for both consumers and practitioners. The market is segmented by application, with beauty salons representing a dominant segment due to their accessibility and focus on elective cosmetic treatments.

Polylactic Acid Facial Fillers Market Size (In Million)
Further bolstering market expansion are advancements in PLA formulation, leading to improved safety profiles and efficacy. While the market exhibits strong growth potential, certain restraints may influence its trajectory. These include the relatively higher cost of PLA fillers compared to some alternatives, the need for skilled practitioners due to specific injection techniques, and ongoing regulatory scrutiny in certain regions, which can impact market access and adoption rates. However, the ongoing research and development efforts aimed at creating more advanced and user-friendly PLA-based products, coupled with increasing patient acceptance and the successful incorporation of these fillers in diverse aesthetic applications beyond simple volumization, are expected to mitigate these challenges. The market is witnessing innovative product launches and strategic collaborations among key players, aiming to expand geographical reach and cater to evolving consumer preferences for personalized and effective aesthetic solutions.
Polylactic Acid Facial Fillers Company Market Share
Polylactic Acid Facial Fillers Market Structure & Competitive Landscape
The Polylactic Acid (PLA) facial fillers market is characterized by moderate to high concentration, with several key players vying for market share. Innovation is a primary driver, fueled by advancements in biocompatible material science and formulation techniques aimed at enhancing efficacy and longevity. Regulatory landscapes, particularly within regions like the US (FDA) and Europe (CE marking), significantly influence market entry and product development, creating a complex compliance environment. Product substitutes, including hyaluronic acid fillers and autologous fat grafting, present ongoing competitive pressures, compelling PLA filler manufacturers to emphasize unique selling propositions such as collagen stimulation and longer-lasting results. End-user segmentation reveals a growing preference for minimally invasive aesthetic procedures, driving demand in beauty salons and specialized clinics. Mergers and acquisitions (M&A) activity has been moderate, reflecting strategic moves by established companies to expand their portfolios and market reach. For instance, approximately 5 to 10 significant M&A transactions are projected annually in the broader dermal filler market, with PLA fillers being an increasingly targeted segment. The market's focus remains on developing fillers with superior biocompatibility, predictable resorption rates, and enhanced aesthetic outcomes, supported by robust clinical trials and a growing body of scientific evidence. The concentration ratio for the top 5 players is estimated to be around 60-70%, indicating a consolidated yet competitive landscape.
Polylactic Acid Facial Fillers Market Trends & Opportunities
The Polylactic Acid (PLA) facial fillers market is poised for substantial growth, with a projected market size reaching over $1,500 million by 2033. This expansion is underpinned by a Compound Annual Growth Rate (CAGR) of approximately 12.5% during the forecast period of 2025–2033. Key trends driving this upward trajectory include the escalating global demand for non-surgical aesthetic rejuvenation procedures. Consumers, increasingly educated about the benefits of collagen biostimulators, are seeking treatments that offer natural-looking results and address concerns like skin laxity, wrinkles, and volume loss with sustained efficacy. Technological advancements are central to this market's evolution. Innovations in PLA microparticle engineering have led to improved injectability, reduced risk of adverse events, and more predictable collagenesis. The development of novel formulations that allow for varying degrees of integration and resorption caters to diverse patient needs and physician preferences.
Consumer preferences are shifting towards treatments that provide long-term benefits rather than temporary fixes. PLA fillers, known for their ability to stimulate the body's own collagen production over time, align perfectly with this demand. This gradual, natural enhancement appeals to individuals seeking subtle yet significant improvements in skin quality and facial contouring. The market penetration rate for PLA fillers, while still lower than hyaluronic acid fillers, is rapidly increasing as awareness and adoption grow.
Competitive dynamics are intensifying, with both established aesthetic giants and emerging biotech firms investing heavily in research and development. This competition fosters a virtuous cycle of innovation, leading to improved product offerings and more accessible pricing. The market is ripe with opportunities for companies that can demonstrate superior product safety profiles, offer comprehensive training and support for medical practitioners, and effectively communicate the unique advantages of PLA-based collagen stimulators to a wider audience. Furthermore, the exploration of new applications for PLA, beyond traditional wrinkle correction and volume restoration, such as scar treatment and skin texture improvement, presents significant untapped potential. The increasing disposable income in emerging economies and the growing social media influence on beauty standards are also significant opportunities for market expansion. Strategic partnerships between manufacturers, distributors, and aesthetic clinics will be crucial for capitalizing on these emerging trends and solidifying market positions.
Dominant Markets & Segments in Polylactic Acid Facial Fillers
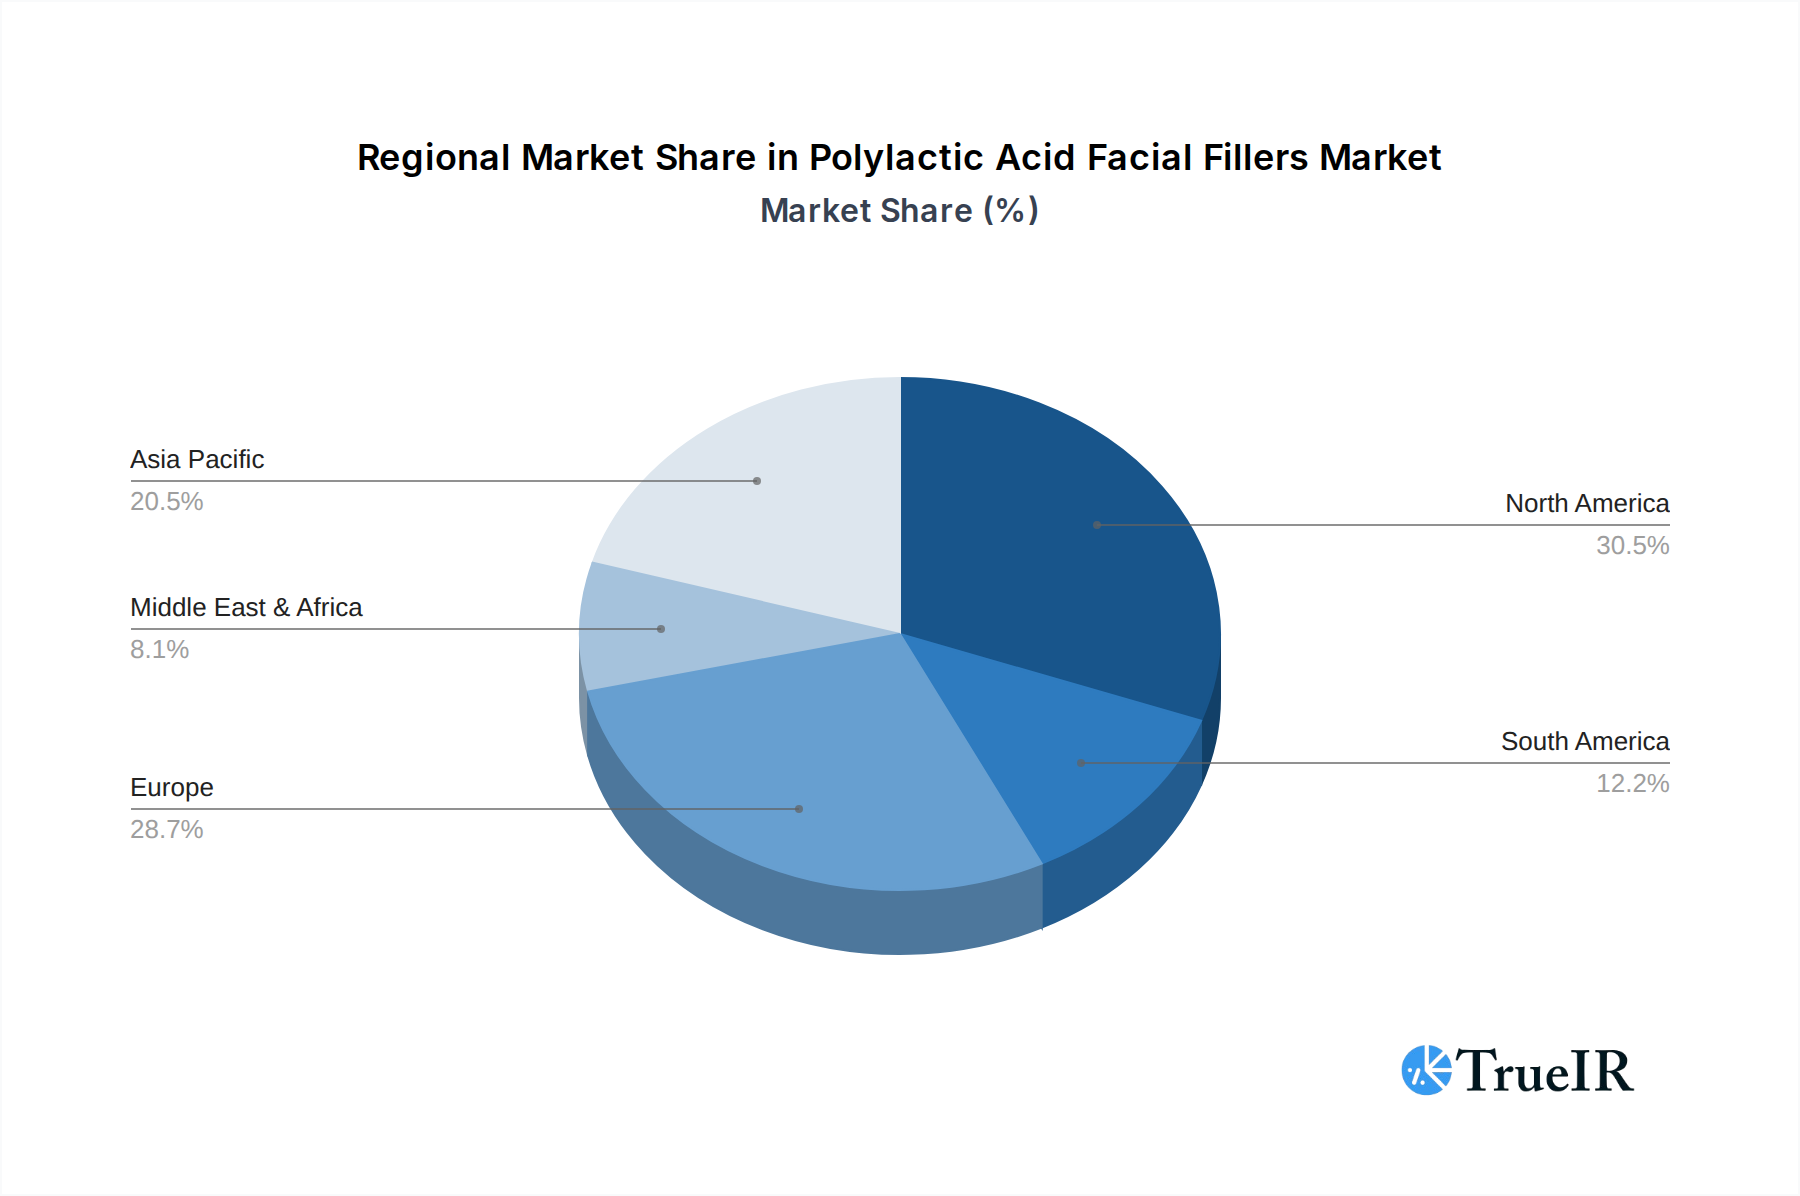
The Polylactic Acid (PLA) facial fillers market is witnessing robust growth across various applications and product types, with specific segments emerging as dominant forces. Regionally, North America and Europe currently lead the market due to high disposable incomes, a strong aesthetic consciousness among the population, and a well-established network of skilled practitioners. However, the Asia-Pacific region, particularly countries like China, South Korea, and Japan, is experiencing a significantly faster growth rate, driven by a rapidly expanding middle class, increasing adoption of aesthetic procedures, and supportive government initiatives promoting medical tourism and advanced healthcare.
Within the Application segment, Hospitals represent a significant market share, offering a controlled environment for these procedures and catering to a patient base that prefers comprehensive medical oversight. However, Beauty Salons are emerging as a rapidly growing channel. This expansion is attributed to their accessibility, lower per-procedure costs compared to hospitals, and targeted marketing towards a younger demographic seeking preventative and minor aesthetic enhancements. The "Other" application segment, which includes specialized aesthetic clinics and dermatology practices, also contributes substantially, leveraging advanced technologies and personalized treatment plans.
The Types segment, categorized by the duration of effect, highlights a clear trend towards longer-lasting solutions. While the 1 Year Below segment maintains a steady demand for immediate but less enduring results, the 1-2 Years and 2 Years Above segments are experiencing the most significant expansion. The 2 Years Above segment, in particular, is gaining traction as consumers prioritize treatments that offer sustained collagen stimulation and anti-aging benefits, reducing the need for frequent re-treatments. This preference is further amplified by the increasing sophistication of PLA formulations, which now offer predictable and prolonged therapeutic outcomes.
Key growth drivers for market dominance in these segments include:
- Technological Advancements: Continuous innovation in PLA particle size, concentration, and delivery systems enhances efficacy, safety, and patient experience, driving adoption across all application types.
- Increasing Consumer Awareness & Demand: Widespread dissemination of information through social media and influencer marketing, coupled with a growing desire for natural-looking rejuvenation, fuels demand, especially in beauty salons and specialized clinics.
- Regulatory Approvals & Support: Favorable regulatory pathways and approvals in key markets like the US and Europe, along with growing acceptance in emerging markets, pave the way for broader market penetration.
- Skilled Practitioner Base: The availability of well-trained dermatologists, plastic surgeons, and aestheticians adept at administering PLA fillers is crucial for ensuring patient safety and optimal results, bolstering the confidence of consumers seeking treatments in hospitals and specialized clinics.
- Growing Disposable Income: Rising disposable incomes, particularly in developing economies, empower a larger segment of the population to invest in elective aesthetic procedures, driving growth across all application and type segments.
Polylactic Acid Facial Fillers Product Analysis
Polylactic Acid (PLA) facial fillers represent a significant advancement in aesthetic medicine, offering a unique mechanism of action focused on stimulating the body's natural collagen production. Unlike traditional fillers that merely provide volume, PLA fillers work by initiating a biostimulatory response, gradually leading to improved skin texture, firmness, and reduction in wrinkles. Innovations in PLA microparticle technology have enabled finer particle sizes and optimized concentrations, enhancing injectability and minimizing adverse effects. These products boast competitive advantages such as extended longevity, with results often lasting 1-2 years or more, and a more natural, gradual enhancement compared to immediate volumizers. Their biocompatibility and biodegradable nature ensure safe resorption by the body.
Key Drivers, Barriers & Challenges in Polylactic Acid Facial Fillers
Key Drivers: The Polylactic Acid facial fillers market is propelled by a confluence of technological innovation, increasing consumer demand for non-surgical rejuvenation, and a growing awareness of the benefits of collagen biostimulation. Advances in material science have led to safer and more effective PLA formulations, while the desire for natural-looking, long-lasting results aligns perfectly with the inherent properties of these fillers. A supportive regulatory environment in major markets also facilitates wider adoption.
Key Barriers & Challenges: Despite the strong growth trajectory, the market faces several challenges. Regulatory complexities and differing approval pathways across regions can create hurdles for market entry. The initial cost of PLA fillers can be higher than some traditional alternatives, potentially limiting accessibility for some consumers. Furthermore, the need for specialized training for practitioners to administer these biostimulators effectively is a crucial factor impacting widespread adoption. Competitive pressure from established hyaluronic acid fillers and the need to educate consumers on the distinct advantages of PLA also present ongoing challenges. Supply chain vulnerabilities and the potential for limited availability of raw materials in certain regions could also impact market stability.
Growth Drivers in the Polylactic Acid Facial Fillers Market
The Polylactic Acid facial fillers market is primarily driven by escalating global demand for non-surgical aesthetic procedures and a heightened consumer preference for natural-looking, long-lasting rejuvenation. Technological advancements in PLA formulation, leading to improved efficacy, safety, and injectability, are paramount. The inherent collagen-stimulating properties of PLA fillers directly address the growing desire for improved skin quality and elasticity over time. Furthermore, favorable regulatory approvals in key markets and the expanding practitioner base equipped with specialized training are critical economic and policy-driven factors fostering market expansion. The increasing disposable incomes in emerging economies also play a significant role in driving this growth.
Challenges Impacting Polylactic Acid Facial Fillers Growth
Significant challenges impacting the growth of Polylactic Acid facial fillers include stringent and varied regulatory landscapes across different countries, which can slow down market entry and product diversification. Supply chain issues, such as the sourcing of high-quality raw materials and ensuring consistent production, can create bottlenecks. Competitive pressures from well-established hyaluronic acid fillers, which often offer immediate visible results, require continuous market education on the unique, long-term benefits of PLA. Moreover, the necessity for specialized training for practitioners to ensure safe and optimal administration of PLA fillers can limit its widespread adoption by less experienced professionals.
Key Players Shaping the Polylactic Acid Facial Fillers Market
- Galderma
- DERMA VEIL
- Regen Biotech
- Sinclair Pharma
- PRP SCIENCE
- Shengboma Biological Materials
- Aimeike Biotech
Significant Polylactic Acid Facial Fillers Industry Milestones
- 2019: Increased clinical research and publication on PLA filler efficacy and safety profiles.
- 2020: Launch of new generation PLA fillers with enhanced particle technology by key players.
- 2021: Expansion of PLA filler applications into areas like scar revision and improved skin texture.
- 2022: Growing regulatory approvals for PLA fillers in emerging markets, particularly in Asia.
- 2023: Strategic partnerships and collaborations to broaden distribution networks for PLA fillers.
- 2024: Significant investment in marketing and educational campaigns to boost consumer awareness of PLA benefits.
Future Outlook for Polylactic Acid Facial Fillers Market
The future outlook for the Polylactic Acid facial fillers market is exceptionally promising, fueled by a sustained demand for advanced, non-surgical aesthetic solutions. Continued innovation in PLA formulation, including novel delivery systems and combination therapies, is expected to further enhance product efficacy and patient satisfaction. The market will witness an increasing penetration into diverse demographic segments and geographical regions, driven by growing awareness and accessibility. Strategic opportunities lie in leveraging digital platforms for patient education and practitioner training, as well as exploring new therapeutic applications for PLA beyond traditional facial rejuvenation, such as body contouring and cellulite treatment. The focus on sustainable and biocompatible materials will also position PLA fillers favorably in the evolving aesthetic landscape.
Polylactic Acid Facial Fillers Segmentation
-
1. Application
- 1.1. Beauty Salon
- 1.2. Hospital
- 1.3. Other
-
2. Types
- 2.1. 1 Year Below
- 2.2. 1-2 Years
- 2.3. 2 Years Above
Polylactic Acid Facial Fillers Segmentation By Geography
-
1. North America
- 1.1. United States
- 1.2. Canada
- 1.3. Mexico
-
2. South America
- 2.1. Brazil
- 2.2. Argentina
- 2.3. Rest of South America
-
3. Europe
- 3.1. United Kingdom
- 3.2. Germany
- 3.3. France
- 3.4. Italy
- 3.5. Spain
- 3.6. Russia
- 3.7. Benelux
- 3.8. Nordics
- 3.9. Rest of Europe
-
4. Middle East & Africa
- 4.1. Turkey
- 4.2. Israel
- 4.3. GCC
- 4.4. North Africa
- 4.5. South Africa
- 4.6. Rest of Middle East & Africa
-
5. Asia Pacific
- 5.1. China
- 5.2. India
- 5.3. Japan
- 5.4. South Korea
- 5.5. ASEAN
- 5.6. Oceania
- 5.7. Rest of Asia Pacific
Polylactic Acid Facial Fillers Regional Market Share
Geographic Coverage of Polylactic Acid Facial Fillers
Polylactic Acid Facial Fillers REPORT HIGHLIGHTS
| Aspects | Details |
|---|---|
| Study Period | 2020-2034 |
| Base Year | 2025 |
| Estimated Year | 2026 |
| Forecast Period | 2026-2034 |
| Historical Period | 2020-2025 |
| Growth Rate | CAGR of 8.9% from 2020-2034 |
| Segmentation |
|
Table of Contents
- 1. Introduction
- 1.1. Research Scope
- 1.2. Market Segmentation
- 1.3. Research Objective
- 1.4. Definitions and Assumptions
- 2. Executive Summary
- 2.1. Market Snapshot
- 3. Market Dynamics
- 3.1. Market Drivers
- 3.2. Market Restrains
- 3.3. Market Trends
- 3.4. Market Opportunities
- 4. Market Factor Analysis
- 4.1. Porters Five Forces
- 4.1.1. Bargaining Power of Suppliers
- 4.1.2. Bargaining Power of Buyers
- 4.1.3. Threat of New Entrants
- 4.1.4. Threat of Substitutes
- 4.1.5. Competitive Rivalry
- 4.2. PESTEL analysis
- 4.3. BCG Analysis
- 4.3.1. Stars (High Growth, High Market Share)
- 4.3.2. Cash Cows (Low Growth, High Market Share)
- 4.3.3. Question Mark (High Growth, Low Market Share)
- 4.3.4. Dogs (Low Growth, Low Market Share)
- 4.4. Ansoff Matrix Analysis
- 4.5. Supply Chain Analysis
- 4.6. Regulatory Landscape
- 4.7. Current Market Potential and Opportunity Assessment (TAM–SAM–SOM Framework)
- 4.8. TIR Analyst Note
- 4.1. Porters Five Forces
- 5. Market Analysis, Insights and Forecast 2021-2033
- 5.1. Market Analysis, Insights and Forecast - by Application
- 5.1.1. Beauty Salon
- 5.1.2. Hospital
- 5.1.3. Other
- 5.2. Market Analysis, Insights and Forecast - by Types
- 5.2.1. 1 Year Below
- 5.2.2. 1-2 Years
- 5.2.3. 2 Years Above
- 5.3. Market Analysis, Insights and Forecast - by Region
- 5.3.1. North America
- 5.3.2. South America
- 5.3.3. Europe
- 5.3.4. Middle East & Africa
- 5.3.5. Asia Pacific
- 5.1. Market Analysis, Insights and Forecast - by Application
- 6. Global Polylactic Acid Facial Fillers Analysis, Insights and Forecast, 2021-2033
- 6.1. Market Analysis, Insights and Forecast - by Application
- 6.1.1. Beauty Salon
- 6.1.2. Hospital
- 6.1.3. Other
- 6.2. Market Analysis, Insights and Forecast - by Types
- 6.2.1. 1 Year Below
- 6.2.2. 1-2 Years
- 6.2.3. 2 Years Above
- 6.1. Market Analysis, Insights and Forecast - by Application
- 7. North America Polylactic Acid Facial Fillers Analysis, Insights and Forecast, 2020-2032
- 7.1. Market Analysis, Insights and Forecast - by Application
- 7.1.1. Beauty Salon
- 7.1.2. Hospital
- 7.1.3. Other
- 7.2. Market Analysis, Insights and Forecast - by Types
- 7.2.1. 1 Year Below
- 7.2.2. 1-2 Years
- 7.2.3. 2 Years Above
- 7.1. Market Analysis, Insights and Forecast - by Application
- 8. South America Polylactic Acid Facial Fillers Analysis, Insights and Forecast, 2020-2032
- 8.1. Market Analysis, Insights and Forecast - by Application
- 8.1.1. Beauty Salon
- 8.1.2. Hospital
- 8.1.3. Other
- 8.2. Market Analysis, Insights and Forecast - by Types
- 8.2.1. 1 Year Below
- 8.2.2. 1-2 Years
- 8.2.3. 2 Years Above
- 8.1. Market Analysis, Insights and Forecast - by Application
- 9. Europe Polylactic Acid Facial Fillers Analysis, Insights and Forecast, 2020-2032
- 9.1. Market Analysis, Insights and Forecast - by Application
- 9.1.1. Beauty Salon
- 9.1.2. Hospital
- 9.1.3. Other
- 9.2. Market Analysis, Insights and Forecast - by Types
- 9.2.1. 1 Year Below
- 9.2.2. 1-2 Years
- 9.2.3. 2 Years Above
- 9.1. Market Analysis, Insights and Forecast - by Application
- 10. Middle East & Africa Polylactic Acid Facial Fillers Analysis, Insights and Forecast, 2020-2032
- 10.1. Market Analysis, Insights and Forecast - by Application
- 10.1.1. Beauty Salon
- 10.1.2. Hospital
- 10.1.3. Other
- 10.2. Market Analysis, Insights and Forecast - by Types
- 10.2.1. 1 Year Below
- 10.2.2. 1-2 Years
- 10.2.3. 2 Years Above
- 10.1. Market Analysis, Insights and Forecast - by Application
- 11. Asia Pacific Polylactic Acid Facial Fillers Analysis, Insights and Forecast, 2020-2032
- 11.1. Market Analysis, Insights and Forecast - by Application
- 11.1.1. Beauty Salon
- 11.1.2. Hospital
- 11.1.3. Other
- 11.2. Market Analysis, Insights and Forecast - by Types
- 11.2.1. 1 Year Below
- 11.2.2. 1-2 Years
- 11.2.3. 2 Years Above
- 11.1. Market Analysis, Insights and Forecast - by Application
- 12. Competitive Analysis
- 12.1. Company Profiles
- 12.1.1 Galderma (Sculptra)
- 12.1.1.1. Company Overview
- 12.1.1.2. Products
- 12.1.1.3. Company Financials
- 12.1.1.4. SWOT Analysis
- 12.1.2 DERMA VEIL
- 12.1.2.1. Company Overview
- 12.1.2.2. Products
- 12.1.2.3. Company Financials
- 12.1.2.4. SWOT Analysis
- 12.1.3 Regen Biotech(AestheFill
- 12.1.3.1. Company Overview
- 12.1.3.2. Products
- 12.1.3.3. Company Financials
- 12.1.3.4. SWOT Analysis
- 12.1.4 PowerFill)
- 12.1.4.1. Company Overview
- 12.1.4.2. Products
- 12.1.4.3. Company Financials
- 12.1.4.4. SWOT Analysis
- 12.1.5 Sinclair Pharma (Lanluma)
- 12.1.5.1. Company Overview
- 12.1.5.2. Products
- 12.1.5.3. Company Financials
- 12.1.5.4. SWOT Analysis
- 12.1.6 PRP SCIENCE (OLIDIA)
- 12.1.6.1. Company Overview
- 12.1.6.2. Products
- 12.1.6.3. Company Financials
- 12.1.6.4. SWOT Analysis
- 12.1.7 Shengboma Biological Materials
- 12.1.7.1. Company Overview
- 12.1.7.2. Products
- 12.1.7.3. Company Financials
- 12.1.7.4. SWOT Analysis
- 12.1.8 Aimeike Biotech
- 12.1.8.1. Company Overview
- 12.1.8.2. Products
- 12.1.8.3. Company Financials
- 12.1.8.4. SWOT Analysis
- 12.1.1 Galderma (Sculptra)
- 12.2. Market Entropy
- 12.2.1 Company's Key Areas Served
- 12.2.2 Recent Developments
- 12.3. Company Market Share Analysis 2025
- 12.3.1 Top 5 Companies Market Share Analysis
- 12.3.2 Top 3 Companies Market Share Analysis
- 12.4. List of Potential Customers
- 13. Research Methodology
List of Figures
- Figure 1: Global Polylactic Acid Facial Fillers Revenue Breakdown (undefined, %) by Region 2025 & 2033
- Figure 2: North America Polylactic Acid Facial Fillers Revenue (undefined), by Application 2025 & 2033
- Figure 3: North America Polylactic Acid Facial Fillers Revenue Share (%), by Application 2025 & 2033
- Figure 4: North America Polylactic Acid Facial Fillers Revenue (undefined), by Types 2025 & 2033
- Figure 5: North America Polylactic Acid Facial Fillers Revenue Share (%), by Types 2025 & 2033
- Figure 6: North America Polylactic Acid Facial Fillers Revenue (undefined), by Country 2025 & 2033
- Figure 7: North America Polylactic Acid Facial Fillers Revenue Share (%), by Country 2025 & 2033
- Figure 8: South America Polylactic Acid Facial Fillers Revenue (undefined), by Application 2025 & 2033
- Figure 9: South America Polylactic Acid Facial Fillers Revenue Share (%), by Application 2025 & 2033
- Figure 10: South America Polylactic Acid Facial Fillers Revenue (undefined), by Types 2025 & 2033
- Figure 11: South America Polylactic Acid Facial Fillers Revenue Share (%), by Types 2025 & 2033
- Figure 12: South America Polylactic Acid Facial Fillers Revenue (undefined), by Country 2025 & 2033
- Figure 13: South America Polylactic Acid Facial Fillers Revenue Share (%), by Country 2025 & 2033
- Figure 14: Europe Polylactic Acid Facial Fillers Revenue (undefined), by Application 2025 & 2033
- Figure 15: Europe Polylactic Acid Facial Fillers Revenue Share (%), by Application 2025 & 2033
- Figure 16: Europe Polylactic Acid Facial Fillers Revenue (undefined), by Types 2025 & 2033
- Figure 17: Europe Polylactic Acid Facial Fillers Revenue Share (%), by Types 2025 & 2033
- Figure 18: Europe Polylactic Acid Facial Fillers Revenue (undefined), by Country 2025 & 2033
- Figure 19: Europe Polylactic Acid Facial Fillers Revenue Share (%), by Country 2025 & 2033
- Figure 20: Middle East & Africa Polylactic Acid Facial Fillers Revenue (undefined), by Application 2025 & 2033
- Figure 21: Middle East & Africa Polylactic Acid Facial Fillers Revenue Share (%), by Application 2025 & 2033
- Figure 22: Middle East & Africa Polylactic Acid Facial Fillers Revenue (undefined), by Types 2025 & 2033
- Figure 23: Middle East & Africa Polylactic Acid Facial Fillers Revenue Share (%), by Types 2025 & 2033
- Figure 24: Middle East & Africa Polylactic Acid Facial Fillers Revenue (undefined), by Country 2025 & 2033
- Figure 25: Middle East & Africa Polylactic Acid Facial Fillers Revenue Share (%), by Country 2025 & 2033
- Figure 26: Asia Pacific Polylactic Acid Facial Fillers Revenue (undefined), by Application 2025 & 2033
- Figure 27: Asia Pacific Polylactic Acid Facial Fillers Revenue Share (%), by Application 2025 & 2033
- Figure 28: Asia Pacific Polylactic Acid Facial Fillers Revenue (undefined), by Types 2025 & 2033
- Figure 29: Asia Pacific Polylactic Acid Facial Fillers Revenue Share (%), by Types 2025 & 2033
- Figure 30: Asia Pacific Polylactic Acid Facial Fillers Revenue (undefined), by Country 2025 & 2033
- Figure 31: Asia Pacific Polylactic Acid Facial Fillers Revenue Share (%), by Country 2025 & 2033
List of Tables
- Table 1: Global Polylactic Acid Facial Fillers Revenue undefined Forecast, by Application 2020 & 2033
- Table 2: Global Polylactic Acid Facial Fillers Revenue undefined Forecast, by Types 2020 & 2033
- Table 3: Global Polylactic Acid Facial Fillers Revenue undefined Forecast, by Region 2020 & 2033
- Table 4: Global Polylactic Acid Facial Fillers Revenue undefined Forecast, by Application 2020 & 2033
- Table 5: Global Polylactic Acid Facial Fillers Revenue undefined Forecast, by Types 2020 & 2033
- Table 6: Global Polylactic Acid Facial Fillers Revenue undefined Forecast, by Country 2020 & 2033
- Table 7: United States Polylactic Acid Facial Fillers Revenue (undefined) Forecast, by Application 2020 & 2033
- Table 8: Canada Polylactic Acid Facial Fillers Revenue (undefined) Forecast, by Application 2020 & 2033
- Table 9: Mexico Polylactic Acid Facial Fillers Revenue (undefined) Forecast, by Application 2020 & 2033
- Table 10: Global Polylactic Acid Facial Fillers Revenue undefined Forecast, by Application 2020 & 2033
- Table 11: Global Polylactic Acid Facial Fillers Revenue undefined Forecast, by Types 2020 & 2033
- Table 12: Global Polylactic Acid Facial Fillers Revenue undefined Forecast, by Country 2020 & 2033
- Table 13: Brazil Polylactic Acid Facial Fillers Revenue (undefined) Forecast, by Application 2020 & 2033
- Table 14: Argentina Polylactic Acid Facial Fillers Revenue (undefined) Forecast, by Application 2020 & 2033
- Table 15: Rest of South America Polylactic Acid Facial Fillers Revenue (undefined) Forecast, by Application 2020 & 2033
- Table 16: Global Polylactic Acid Facial Fillers Revenue undefined Forecast, by Application 2020 & 2033
- Table 17: Global Polylactic Acid Facial Fillers Revenue undefined Forecast, by Types 2020 & 2033
- Table 18: Global Polylactic Acid Facial Fillers Revenue undefined Forecast, by Country 2020 & 2033
- Table 19: United Kingdom Polylactic Acid Facial Fillers Revenue (undefined) Forecast, by Application 2020 & 2033
- Table 20: Germany Polylactic Acid Facial Fillers Revenue (undefined) Forecast, by Application 2020 & 2033
- Table 21: France Polylactic Acid Facial Fillers Revenue (undefined) Forecast, by Application 2020 & 2033
- Table 22: Italy Polylactic Acid Facial Fillers Revenue (undefined) Forecast, by Application 2020 & 2033
- Table 23: Spain Polylactic Acid Facial Fillers Revenue (undefined) Forecast, by Application 2020 & 2033
- Table 24: Russia Polylactic Acid Facial Fillers Revenue (undefined) Forecast, by Application 2020 & 2033
- Table 25: Benelux Polylactic Acid Facial Fillers Revenue (undefined) Forecast, by Application 2020 & 2033
- Table 26: Nordics Polylactic Acid Facial Fillers Revenue (undefined) Forecast, by Application 2020 & 2033
- Table 27: Rest of Europe Polylactic Acid Facial Fillers Revenue (undefined) Forecast, by Application 2020 & 2033
- Table 28: Global Polylactic Acid Facial Fillers Revenue undefined Forecast, by Application 2020 & 2033
- Table 29: Global Polylactic Acid Facial Fillers Revenue undefined Forecast, by Types 2020 & 2033
- Table 30: Global Polylactic Acid Facial Fillers Revenue undefined Forecast, by Country 2020 & 2033
- Table 31: Turkey Polylactic Acid Facial Fillers Revenue (undefined) Forecast, by Application 2020 & 2033
- Table 32: Israel Polylactic Acid Facial Fillers Revenue (undefined) Forecast, by Application 2020 & 2033
- Table 33: GCC Polylactic Acid Facial Fillers Revenue (undefined) Forecast, by Application 2020 & 2033
- Table 34: North Africa Polylactic Acid Facial Fillers Revenue (undefined) Forecast, by Application 2020 & 2033
- Table 35: South Africa Polylactic Acid Facial Fillers Revenue (undefined) Forecast, by Application 2020 & 2033
- Table 36: Rest of Middle East & Africa Polylactic Acid Facial Fillers Revenue (undefined) Forecast, by Application 2020 & 2033
- Table 37: Global Polylactic Acid Facial Fillers Revenue undefined Forecast, by Application 2020 & 2033
- Table 38: Global Polylactic Acid Facial Fillers Revenue undefined Forecast, by Types 2020 & 2033
- Table 39: Global Polylactic Acid Facial Fillers Revenue undefined Forecast, by Country 2020 & 2033
- Table 40: China Polylactic Acid Facial Fillers Revenue (undefined) Forecast, by Application 2020 & 2033
- Table 41: India Polylactic Acid Facial Fillers Revenue (undefined) Forecast, by Application 2020 & 2033
- Table 42: Japan Polylactic Acid Facial Fillers Revenue (undefined) Forecast, by Application 2020 & 2033
- Table 43: South Korea Polylactic Acid Facial Fillers Revenue (undefined) Forecast, by Application 2020 & 2033
- Table 44: ASEAN Polylactic Acid Facial Fillers Revenue (undefined) Forecast, by Application 2020 & 2033
- Table 45: Oceania Polylactic Acid Facial Fillers Revenue (undefined) Forecast, by Application 2020 & 2033
- Table 46: Rest of Asia Pacific Polylactic Acid Facial Fillers Revenue (undefined) Forecast, by Application 2020 & 2033
Frequently Asked Questions
1. What is the projected Compound Annual Growth Rate (CAGR) of the Polylactic Acid Facial Fillers?
The projected CAGR is approximately 8.9%.
2. Which companies are prominent players in the Polylactic Acid Facial Fillers?
Key companies in the market include Galderma (Sculptra), DERMA VEIL, Regen Biotech(AestheFill, PowerFill), Sinclair Pharma (Lanluma), PRP SCIENCE (OLIDIA), Shengboma Biological Materials, Aimeike Biotech.
3. What are the main segments of the Polylactic Acid Facial Fillers?
The market segments include Application, Types.
4. Can you provide details about the market size?
The market size is estimated to be USD XXX N/A as of 2022.
5. What are some drivers contributing to market growth?
N/A
6. What are the notable trends driving market growth?
N/A
7. Are there any restraints impacting market growth?
N/A
8. Can you provide examples of recent developments in the market?
N/A
9. What pricing options are available for accessing the report?
Pricing options include single-user, multi-user, and enterprise licenses priced at USD 4900.00, USD 7350.00, and USD 9800.00 respectively.
10. Is the market size provided in terms of value or volume?
The market size is provided in terms of value, measured in N/A.
11. Are there any specific market keywords associated with the report?
Yes, the market keyword associated with the report is "Polylactic Acid Facial Fillers," which aids in identifying and referencing the specific market segment covered.
12. How do I determine which pricing option suits my needs best?
The pricing options vary based on user requirements and access needs. Individual users may opt for single-user licenses, while businesses requiring broader access may choose multi-user or enterprise licenses for cost-effective access to the report.
13. Are there any additional resources or data provided in the Polylactic Acid Facial Fillers report?
While the report offers comprehensive insights, it's advisable to review the specific contents or supplementary materials provided to ascertain if additional resources or data are available.
14. How can I stay updated on further developments or reports in the Polylactic Acid Facial Fillers?
To stay informed about further developments, trends, and reports in the Polylactic Acid Facial Fillers, consider subscribing to industry newsletters, following relevant companies and organizations, or regularly checking reputable industry news sources and publications.
Methodology
Step 1 - Identification of Relevant Samples Size from Population Database


Step 2 - Approaches for Defining Global Market Size (Value, Volume* & Price*)

Note*: In applicable scenarios
Step 3 - Data Sources
Primary Research
- Web Analytics
- Survey Reports
- Research Institute
- Latest Research Reports
- Opinion Leaders
Secondary Research
- Annual Reports
- White Paper
- Latest Press Release
- Industry Association
- Paid Database
- Investor Presentations

Step 4 - Data Triangulation
Involves using different sources of information in order to increase the validity of a study
These sources are likely to be stakeholders in a program - participants, other researchers, program staff, other community members, and so on.
Then we put all data in single framework & apply various statistical tools to find out the dynamic on the market.
During the analysis stage, feedback from the stakeholder groups would be compared to determine areas of agreement as well as areas of divergence