

Key Insights
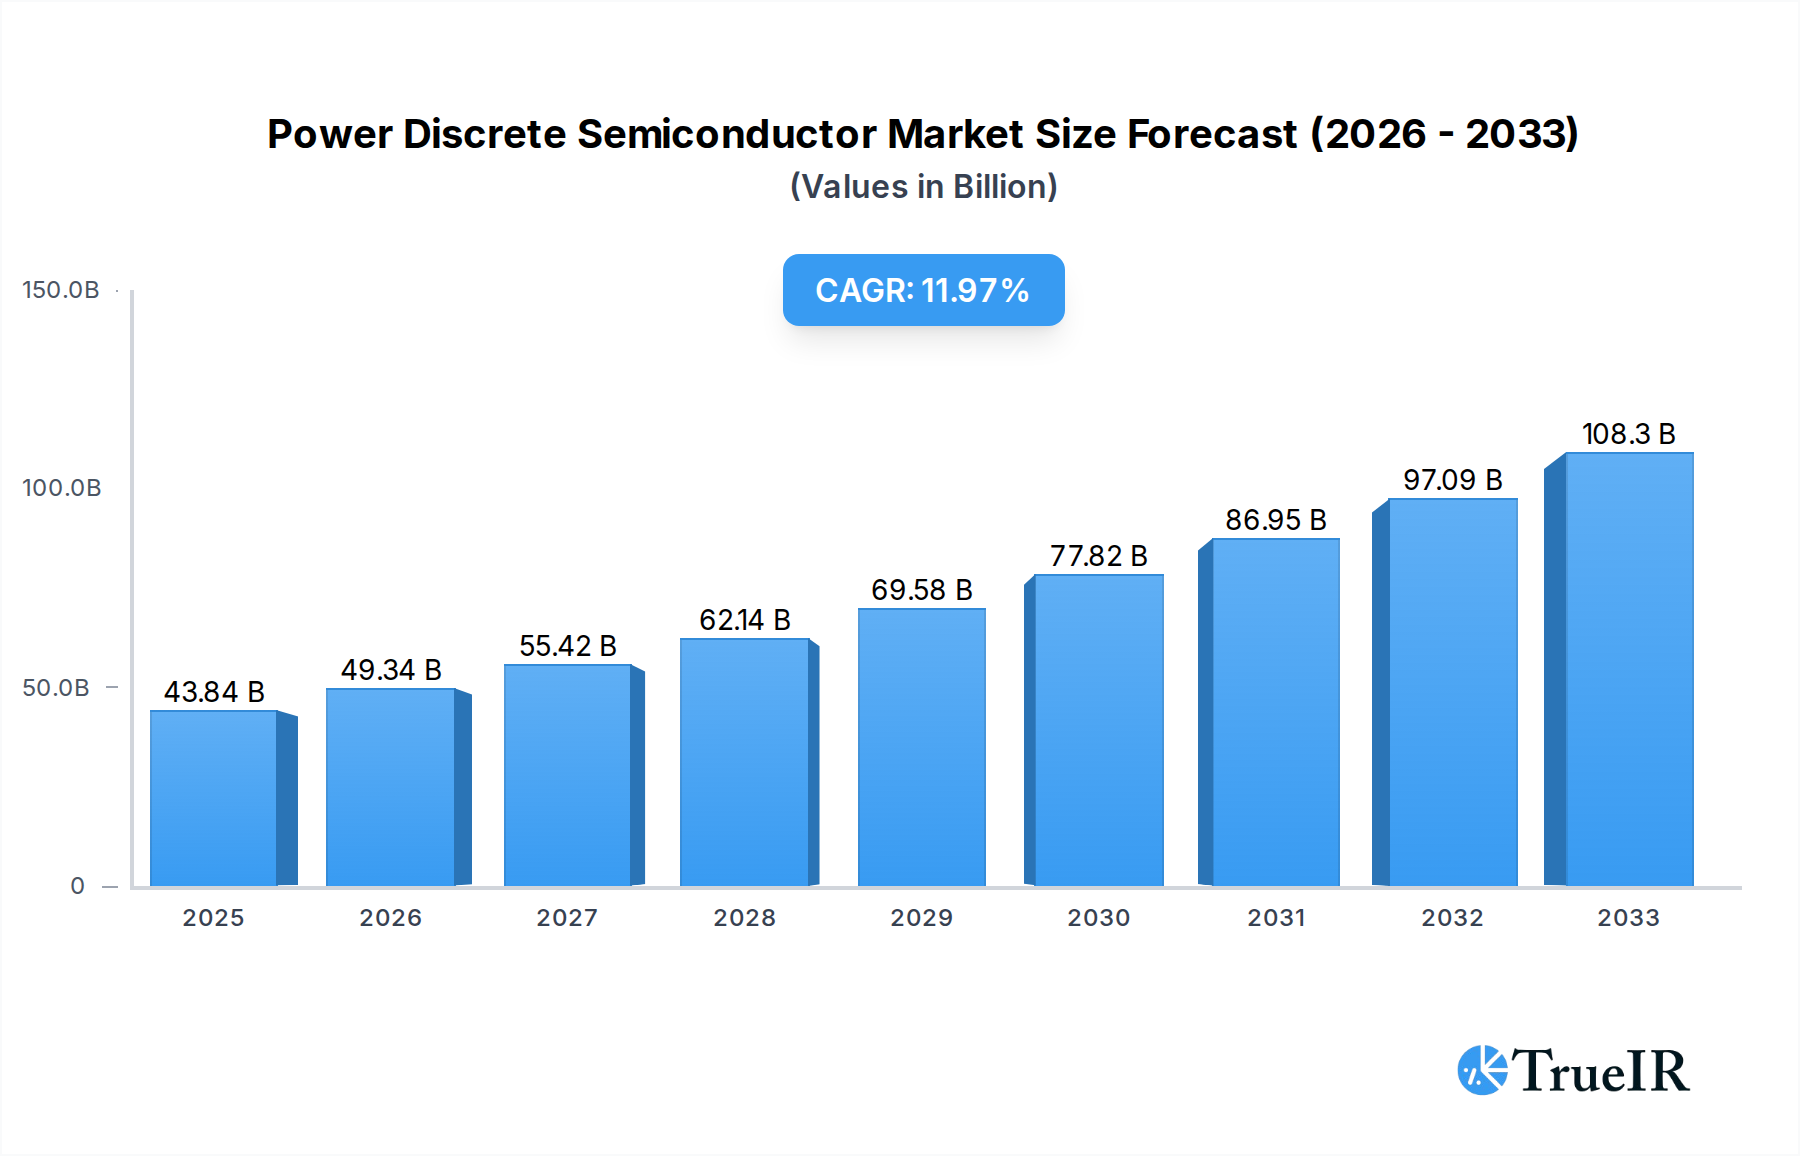
The power discrete semiconductor market is experiencing robust growth, driven by the increasing demand for energy-efficient electronics across diverse sectors. The market, estimated at $25 billion in 2025, is projected to exhibit a compound annual growth rate (CAGR) of approximately 7% from 2025 to 2033, reaching an estimated $40 billion by 2033. This expansion is fueled by several key factors, including the proliferation of electric vehicles (EVs), renewable energy adoption (solar, wind), and the rising penetration of power management integrated circuits (PMICs) in consumer electronics and industrial automation. The automotive industry, in particular, is a significant driver, with power discrete semiconductors crucial for inverters, onboard chargers, and motor control units in EVs. Furthermore, the growing demand for high-power applications in data centers and industrial settings contributes significantly to market growth.

Power Discrete Semiconductor Market Size (In Billion)
While the market presents significant opportunities, certain restraints exist. These include the fluctuating prices of raw materials (like silicon), potential supply chain disruptions, and the ongoing development and adoption of alternative semiconductor technologies. Despite these challenges, the continuous innovation in power semiconductor materials (like silicon carbide and gallium nitride) and packaging technologies is anticipated to mitigate some of these restraints and further propel market growth. Key players like Infineon, Onsemi, STMicroelectronics, and others are investing heavily in research and development to enhance efficiency, power density, and reliability, solidifying their market positions and driving further technological advancements. Market segmentation based on device type (diodes, transistors, thyristors), application (automotive, industrial, consumer electronics), and geography will offer further granular insights into market dynamics and opportunities for focused growth.
Power Discrete Semiconductor Company Market Share
Power Discrete Semiconductor Market Report: 2019-2033
This comprehensive report provides a detailed analysis of the global power discrete semiconductor market, offering invaluable insights for industry stakeholders. Covering the period from 2019 to 2033, with a focus on 2025, this report examines market structure, competitive dynamics, growth drivers, and future trends. Millions of dollars are used for all value estimations.
Power Discrete Semiconductor Market Structure & Competitive Landscape
The power discrete semiconductor market is characterized by a moderately concentrated landscape with several key players commanding significant market share. The Herfindahl-Hirschman Index (HHI) for 2025 is estimated at xx, indicating a moderately consolidated market. Innovation is a key driver, with companies investing heavily in research and development to improve efficiency, power density, and reliability. Stringent regulatory requirements related to energy efficiency and environmental standards significantly impact market dynamics. The emergence of alternative power technologies presents some substitution pressure, albeit currently limited. The market is segmented by application (automotive, industrial, consumer electronics, etc.) and geography, with significant variations in growth rates across segments. Mergers and acquisitions (M&A) activity has been robust in recent years, with a total estimated value of xx million in deals between 2019 and 2024.
- Top 5 players account for approximately xx% of the market share in 2025.
- Key M&A activities involved companies such as: xx, resulting in increased market concentration.
- Regulatory compliance (e.g., RoHS, REACH) drives innovation and shapes product development strategies.
- End-user segmentation is crucial, with the automotive and industrial sectors driving substantial demand.
Power Discrete Semiconductor Market Trends & Opportunities
The global power discrete semiconductor market is experiencing robust growth, with an estimated Compound Annual Growth Rate (CAGR) of xx% during the forecast period (2025-2033). This growth is primarily fueled by the increasing demand for energy-efficient devices across various applications, including electric vehicles (EVs), renewable energy systems, and industrial automation. Technological advancements such as the adoption of wide bandgap semiconductors (SiC and GaN) are significantly transforming the market landscape. Consumer preference for energy-efficient electronics further bolsters demand. The competitive dynamics are characterized by intense competition among established players and emerging entrants, particularly in the wide-bandgap semiconductor segment, leading to price competition and product innovation. Market penetration rates for SiC and GaN devices are currently relatively low but are projected to increase significantly over the next decade.
Dominant Markets & Segments in Power Discrete Semiconductor
The Asia-Pacific region is expected to dominate the power discrete semiconductor market throughout the forecast period, driven by robust growth in the electronics manufacturing sector and strong government support for renewable energy initiatives. China, specifically, is a major growth driver due to its massive automotive market and rapid industrialization.
Key Growth Drivers in Asia-Pacific:
- Rapid expansion of the automotive industry (EVs and hybrid vehicles).
- Significant investments in renewable energy infrastructure (solar, wind).
- Government support for the development of the semiconductor industry.
- Growing demand from consumer electronics manufacturing.
The market dominance of the Asia-Pacific region is attributed to several factors, including the presence of major manufacturing hubs, significant government investments in renewable energy and industrial automation, and a large and growing consumer market.
Power Discrete Semiconductor Product Analysis
Recent innovations focus on increasing power density, enhancing efficiency, improving thermal management, and reducing costs. Wide bandgap semiconductors (SiC and GaN) are gaining significant traction due to their superior performance characteristics compared to traditional silicon-based devices. These advancements are driving adoption across various applications, particularly in high-power electronics and electric vehicles. The competitive advantage lies in achieving higher efficiency, greater power density, and superior reliability at competitive price points.
Key Drivers, Barriers & Challenges in Power Discrete Semiconductor
Key Drivers: The rapid growth of the electric vehicle market, increasing demand for renewable energy solutions, and the rising adoption of energy-efficient industrial automation are key drivers propelling the power discrete semiconductor market. Government regulations promoting energy efficiency also contribute.
Key Challenges: The power discrete semiconductor market faces challenges like volatile raw material prices, geopolitical uncertainties impacting supply chains, and intense competition leading to price pressure. Regulatory compliance complexities and high R&D costs also pose significant barriers. These challenges can collectively reduce market growth by an estimated xx million annually.
Growth Drivers in the Power Discrete Semiconductor Market
Growth is fueled by the electrification of transportation (EVs), the expansion of renewable energy infrastructure (solar, wind), the increasing adoption of industrial automation, and government initiatives promoting energy efficiency. Technological advancements like SiC and GaN are also crucial.
Challenges Impacting Power Discrete Semiconductor Growth
Supply chain disruptions, geopolitical risks, and intense price competition from manufacturers pose significant challenges. Regulatory complexities and the high cost of R&D further hinder growth.
Key Players Shaping the Power Discrete Semiconductor Market
- Infineon
- Onsemi
- STMicroelectronics
- Mitsubishi Electric (Vincotech)
- Nexperia
- Vishay Intertechnology
- Toshiba
- Fuji Electric
- Rohm
- Renesas Electronics
- Diodes Incorporated
- Littelfuse (IXYS)
- Alpha & Omega Semiconductor
- SEMIKRON
- Hitachi Power Semiconductor Device
- Microchip
- Sanken Electric
- Semtech
- MagnaChip
- Danfoss
- Bosch
- Texas Instruments
- KEC Corporation
- Cree (Wolfspeed)
- PANJIT Group
- Unisonic Technologies (UTC)
- Niko Semiconductor
- Hangzhou Silan Microelectronics
- Yangzhou Yangjie Electronic Technology
- China Resources Microelectronics Limited
- Jilin Sino-Microelectronics
- StarPower
- NCEPOWER
- Hangzhou Li-On Microelectronics Corporation
- Jiangsu Jiejie Microelectronics
- OmniVision Technologies
- Suzhou Good-Ark Electronics
- Zhuzhou CRRC Times Electric
- WeEn Semiconductors
- Changzhou Galaxy Century Microelectronics
- MacMic Science & Technolog
- BYD
- Hubei TECH Semiconductors
- JSC Mikron
Significant Power Discrete Semiconductor Industry Milestones
- 2020: Infineon launches its next-generation SiC MOSFETs.
- 2021: STMicroelectronics and GlobalFoundries announce a joint venture to expand SiC production capacity.
- 2022: Onsemi acquires GT Advanced Technologies to strengthen its SiC capabilities.
- 2023: xx (Insert a significant industry milestone for 2023)
- 2024: xx (Insert a significant industry milestone for 2024)
Future Outlook for Power Discrete Semiconductor Market
The power discrete semiconductor market is poised for continued strong growth, driven by sustained demand from electric vehicles, renewable energy, and industrial automation. The increasing adoption of wide bandgap semiconductors will further accelerate this growth. Strategic opportunities exist for companies to invest in R&D, expand production capacity, and develop innovative products to meet the growing market demand. The market potential is substantial, with the market size expected to reach xx million by 2033.
Power Discrete Semiconductor Segmentation
-
1. Application
- 1.1. Automotive & Transportation
- 1.2. Industrial
- 1.3. Consumer
- 1.4. Communication
- 1.5. Others
-
2. Types
- 2.1. MOSFETs
- 2.2. Rectifiers
- 2.3. Discrete IGBTs
- 2.4. Bipolar Power Transistors
- 2.5. Thyristors
- 2.6. Standard IGBT Modules
- 2.7. Intelligent Power Modules
- 2.8. Thyristor Modules
- 2.9. Power Integrated Modules
- 2.10. Others
Power Discrete Semiconductor Segmentation By Geography
-
1. North America
- 1.1. United States
- 1.2. Canada
- 1.3. Mexico
-
2. South America
- 2.1. Brazil
- 2.2. Argentina
- 2.3. Rest of South America
-
3. Europe
- 3.1. United Kingdom
- 3.2. Germany
- 3.3. France
- 3.4. Italy
- 3.5. Spain
- 3.6. Russia
- 3.7. Benelux
- 3.8. Nordics
- 3.9. Rest of Europe
-
4. Middle East & Africa
- 4.1. Turkey
- 4.2. Israel
- 4.3. GCC
- 4.4. North Africa
- 4.5. South Africa
- 4.6. Rest of Middle East & Africa
-
5. Asia Pacific
- 5.1. China
- 5.2. India
- 5.3. Japan
- 5.4. South Korea
- 5.5. ASEAN
- 5.6. Oceania
- 5.7. Rest of Asia Pacific
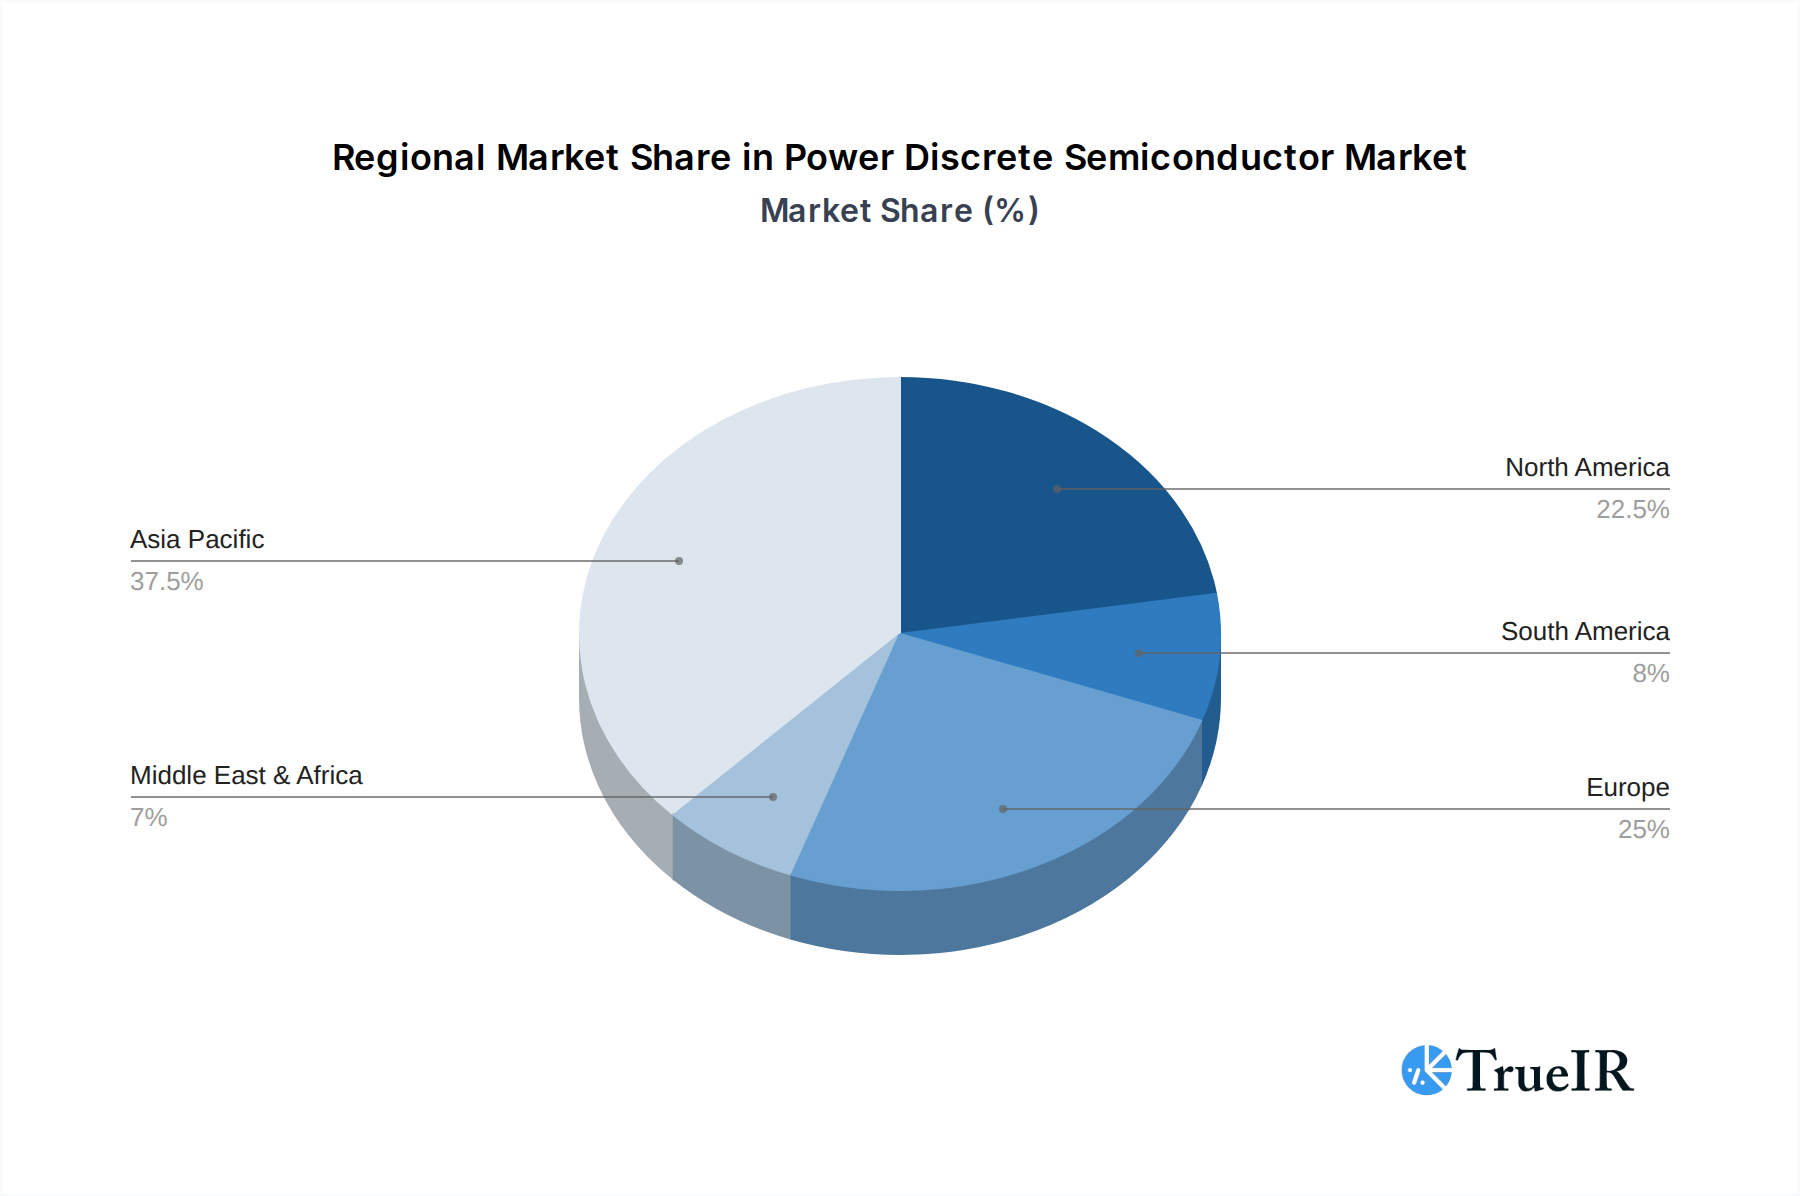
Power Discrete Semiconductor Regional Market Share
Geographic Coverage of Power Discrete Semiconductor
Power Discrete Semiconductor REPORT HIGHLIGHTS
| Aspects | Details |
|---|---|
| Study Period | 2020-2034 |
| Base Year | 2025 |
| Estimated Year | 2026 |
| Forecast Period | 2026-2034 |
| Historical Period | 2020-2025 |
| Growth Rate | CAGR of 11.9% from 2020-2034 |
| Segmentation |
|
Table of Contents
- 1. Introduction
- 1.1. Research Scope
- 1.2. Market Segmentation
- 1.3. Research Objective
- 1.4. Definitions and Assumptions
- 2. Executive Summary
- 2.1. Market Snapshot
- 3. Market Dynamics
- 3.1. Market Drivers
- 3.2. Market Restrains
- 3.3. Market Trends
- 3.4. Market Opportunities
- 4. Market Factor Analysis
- 4.1. Porters Five Forces
- 4.1.1. Bargaining Power of Suppliers
- 4.1.2. Bargaining Power of Buyers
- 4.1.3. Threat of New Entrants
- 4.1.4. Threat of Substitutes
- 4.1.5. Competitive Rivalry
- 4.2. PESTEL analysis
- 4.3. BCG Analysis
- 4.3.1. Stars (High Growth, High Market Share)
- 4.3.2. Cash Cows (Low Growth, High Market Share)
- 4.3.3. Question Mark (High Growth, Low Market Share)
- 4.3.4. Dogs (Low Growth, Low Market Share)
- 4.4. Ansoff Matrix Analysis
- 4.5. Supply Chain Analysis
- 4.6. Regulatory Landscape
- 4.7. Current Market Potential and Opportunity Assessment (TAM–SAM–SOM Framework)
- 4.8. TIR Analyst Note
- 4.1. Porters Five Forces
- 5. Market Analysis, Insights and Forecast 2021-2033
- 5.1. Market Analysis, Insights and Forecast - by Application
- 5.1.1. Automotive & Transportation
- 5.1.2. Industrial
- 5.1.3. Consumer
- 5.1.4. Communication
- 5.1.5. Others
- 5.2. Market Analysis, Insights and Forecast - by Types
- 5.2.1. MOSFETs
- 5.2.2. Rectifiers
- 5.2.3. Discrete IGBTs
- 5.2.4. Bipolar Power Transistors
- 5.2.5. Thyristors
- 5.2.6. Standard IGBT Modules
- 5.2.7. Intelligent Power Modules
- 5.2.8. Thyristor Modules
- 5.2.9. Power Integrated Modules
- 5.2.10. Others
- 5.3. Market Analysis, Insights and Forecast - by Region
- 5.3.1. North America
- 5.3.2. South America
- 5.3.3. Europe
- 5.3.4. Middle East & Africa
- 5.3.5. Asia Pacific
- 5.1. Market Analysis, Insights and Forecast - by Application
- 6. Global Power Discrete Semiconductor Analysis, Insights and Forecast, 2021-2033
- 6.1. Market Analysis, Insights and Forecast - by Application
- 6.1.1. Automotive & Transportation
- 6.1.2. Industrial
- 6.1.3. Consumer
- 6.1.4. Communication
- 6.1.5. Others
- 6.2. Market Analysis, Insights and Forecast - by Types
- 6.2.1. MOSFETs
- 6.2.2. Rectifiers
- 6.2.3. Discrete IGBTs
- 6.2.4. Bipolar Power Transistors
- 6.2.5. Thyristors
- 6.2.6. Standard IGBT Modules
- 6.2.7. Intelligent Power Modules
- 6.2.8. Thyristor Modules
- 6.2.9. Power Integrated Modules
- 6.2.10. Others
- 6.1. Market Analysis, Insights and Forecast - by Application
- 7. North America Power Discrete Semiconductor Analysis, Insights and Forecast, 2020-2032
- 7.1. Market Analysis, Insights and Forecast - by Application
- 7.1.1. Automotive & Transportation
- 7.1.2. Industrial
- 7.1.3. Consumer
- 7.1.4. Communication
- 7.1.5. Others
- 7.2. Market Analysis, Insights and Forecast - by Types
- 7.2.1. MOSFETs
- 7.2.2. Rectifiers
- 7.2.3. Discrete IGBTs
- 7.2.4. Bipolar Power Transistors
- 7.2.5. Thyristors
- 7.2.6. Standard IGBT Modules
- 7.2.7. Intelligent Power Modules
- 7.2.8. Thyristor Modules
- 7.2.9. Power Integrated Modules
- 7.2.10. Others
- 7.1. Market Analysis, Insights and Forecast - by Application
- 8. South America Power Discrete Semiconductor Analysis, Insights and Forecast, 2020-2032
- 8.1. Market Analysis, Insights and Forecast - by Application
- 8.1.1. Automotive & Transportation
- 8.1.2. Industrial
- 8.1.3. Consumer
- 8.1.4. Communication
- 8.1.5. Others
- 8.2. Market Analysis, Insights and Forecast - by Types
- 8.2.1. MOSFETs
- 8.2.2. Rectifiers
- 8.2.3. Discrete IGBTs
- 8.2.4. Bipolar Power Transistors
- 8.2.5. Thyristors
- 8.2.6. Standard IGBT Modules
- 8.2.7. Intelligent Power Modules
- 8.2.8. Thyristor Modules
- 8.2.9. Power Integrated Modules
- 8.2.10. Others
- 8.1. Market Analysis, Insights and Forecast - by Application
- 9. Europe Power Discrete Semiconductor Analysis, Insights and Forecast, 2020-2032
- 9.1. Market Analysis, Insights and Forecast - by Application
- 9.1.1. Automotive & Transportation
- 9.1.2. Industrial
- 9.1.3. Consumer
- 9.1.4. Communication
- 9.1.5. Others
- 9.2. Market Analysis, Insights and Forecast - by Types
- 9.2.1. MOSFETs
- 9.2.2. Rectifiers
- 9.2.3. Discrete IGBTs
- 9.2.4. Bipolar Power Transistors
- 9.2.5. Thyristors
- 9.2.6. Standard IGBT Modules
- 9.2.7. Intelligent Power Modules
- 9.2.8. Thyristor Modules
- 9.2.9. Power Integrated Modules
- 9.2.10. Others
- 9.1. Market Analysis, Insights and Forecast - by Application
- 10. Middle East & Africa Power Discrete Semiconductor Analysis, Insights and Forecast, 2020-2032
- 10.1. Market Analysis, Insights and Forecast - by Application
- 10.1.1. Automotive & Transportation
- 10.1.2. Industrial
- 10.1.3. Consumer
- 10.1.4. Communication
- 10.1.5. Others
- 10.2. Market Analysis, Insights and Forecast - by Types
- 10.2.1. MOSFETs
- 10.2.2. Rectifiers
- 10.2.3. Discrete IGBTs
- 10.2.4. Bipolar Power Transistors
- 10.2.5. Thyristors
- 10.2.6. Standard IGBT Modules
- 10.2.7. Intelligent Power Modules
- 10.2.8. Thyristor Modules
- 10.2.9. Power Integrated Modules
- 10.2.10. Others
- 10.1. Market Analysis, Insights and Forecast - by Application
- 11. Asia Pacific Power Discrete Semiconductor Analysis, Insights and Forecast, 2020-2032
- 11.1. Market Analysis, Insights and Forecast - by Application
- 11.1.1. Automotive & Transportation
- 11.1.2. Industrial
- 11.1.3. Consumer
- 11.1.4. Communication
- 11.1.5. Others
- 11.2. Market Analysis, Insights and Forecast - by Types
- 11.2.1. MOSFETs
- 11.2.2. Rectifiers
- 11.2.3. Discrete IGBTs
- 11.2.4. Bipolar Power Transistors
- 11.2.5. Thyristors
- 11.2.6. Standard IGBT Modules
- 11.2.7. Intelligent Power Modules
- 11.2.8. Thyristor Modules
- 11.2.9. Power Integrated Modules
- 11.2.10. Others
- 11.1. Market Analysis, Insights and Forecast - by Application
- 12. Competitive Analysis
- 12.1. Company Profiles
- 12.1.1 Infineon
- 12.1.1.1. Company Overview
- 12.1.1.2. Products
- 12.1.1.3. Company Financials
- 12.1.1.4. SWOT Analysis
- 12.1.2 Onsemi
- 12.1.2.1. Company Overview
- 12.1.2.2. Products
- 12.1.2.3. Company Financials
- 12.1.2.4. SWOT Analysis
- 12.1.3 ST Microelectronics
- 12.1.3.1. Company Overview
- 12.1.3.2. Products
- 12.1.3.3. Company Financials
- 12.1.3.4. SWOT Analysis
- 12.1.4 Mitsubishi Electric (Vincotech)
- 12.1.4.1. Company Overview
- 12.1.4.2. Products
- 12.1.4.3. Company Financials
- 12.1.4.4. SWOT Analysis
- 12.1.5 Nexperia
- 12.1.5.1. Company Overview
- 12.1.5.2. Products
- 12.1.5.3. Company Financials
- 12.1.5.4. SWOT Analysis
- 12.1.6 Vishay Intertechnology
- 12.1.6.1. Company Overview
- 12.1.6.2. Products
- 12.1.6.3. Company Financials
- 12.1.6.4. SWOT Analysis
- 12.1.7 Toshiba
- 12.1.7.1. Company Overview
- 12.1.7.2. Products
- 12.1.7.3. Company Financials
- 12.1.7.4. SWOT Analysis
- 12.1.8 Fuji Electric
- 12.1.8.1. Company Overview
- 12.1.8.2. Products
- 12.1.8.3. Company Financials
- 12.1.8.4. SWOT Analysis
- 12.1.9 Rohm
- 12.1.9.1. Company Overview
- 12.1.9.2. Products
- 12.1.9.3. Company Financials
- 12.1.9.4. SWOT Analysis
- 12.1.10 Renesas Electronics
- 12.1.10.1. Company Overview
- 12.1.10.2. Products
- 12.1.10.3. Company Financials
- 12.1.10.4. SWOT Analysis
- 12.1.11 Diodes Incorporated
- 12.1.11.1. Company Overview
- 12.1.11.2. Products
- 12.1.11.3. Company Financials
- 12.1.11.4. SWOT Analysis
- 12.1.12 Littelfuse (IXYS)
- 12.1.12.1. Company Overview
- 12.1.12.2. Products
- 12.1.12.3. Company Financials
- 12.1.12.4. SWOT Analysis
- 12.1.13 Alpha & Omega Semiconductor
- 12.1.13.1. Company Overview
- 12.1.13.2. Products
- 12.1.13.3. Company Financials
- 12.1.13.4. SWOT Analysis
- 12.1.14 SEMIKRON
- 12.1.14.1. Company Overview
- 12.1.14.2. Products
- 12.1.14.3. Company Financials
- 12.1.14.4. SWOT Analysis
- 12.1.15 Hitachi Power Semiconductor Device
- 12.1.15.1. Company Overview
- 12.1.15.2. Products
- 12.1.15.3. Company Financials
- 12.1.15.4. SWOT Analysis
- 12.1.16 Microchip
- 12.1.16.1. Company Overview
- 12.1.16.2. Products
- 12.1.16.3. Company Financials
- 12.1.16.4. SWOT Analysis
- 12.1.17 Sanken Electric
- 12.1.17.1. Company Overview
- 12.1.17.2. Products
- 12.1.17.3. Company Financials
- 12.1.17.4. SWOT Analysis
- 12.1.18 Semtech
- 12.1.18.1. Company Overview
- 12.1.18.2. Products
- 12.1.18.3. Company Financials
- 12.1.18.4. SWOT Analysis
- 12.1.19 MagnaChip
- 12.1.19.1. Company Overview
- 12.1.19.2. Products
- 12.1.19.3. Company Financials
- 12.1.19.4. SWOT Analysis
- 12.1.20 Danfoss
- 12.1.20.1. Company Overview
- 12.1.20.2. Products
- 12.1.20.3. Company Financials
- 12.1.20.4. SWOT Analysis
- 12.1.21 Bosch
- 12.1.21.1. Company Overview
- 12.1.21.2. Products
- 12.1.21.3. Company Financials
- 12.1.21.4. SWOT Analysis
- 12.1.22 Texas Instruments
- 12.1.22.1. Company Overview
- 12.1.22.2. Products
- 12.1.22.3. Company Financials
- 12.1.22.4. SWOT Analysis
- 12.1.23 KEC Corporation
- 12.1.23.1. Company Overview
- 12.1.23.2. Products
- 12.1.23.3. Company Financials
- 12.1.23.4. SWOT Analysis
- 12.1.24 Cree (Wolfspeed)
- 12.1.24.1. Company Overview
- 12.1.24.2. Products
- 12.1.24.3. Company Financials
- 12.1.24.4. SWOT Analysis
- 12.1.25 PANJIT Group
- 12.1.25.1. Company Overview
- 12.1.25.2. Products
- 12.1.25.3. Company Financials
- 12.1.25.4. SWOT Analysis
- 12.1.26 Unisonic Technologies (UTC)
- 12.1.26.1. Company Overview
- 12.1.26.2. Products
- 12.1.26.3. Company Financials
- 12.1.26.4. SWOT Analysis
- 12.1.27 Niko Semiconductor
- 12.1.27.1. Company Overview
- 12.1.27.2. Products
- 12.1.27.3. Company Financials
- 12.1.27.4. SWOT Analysis
- 12.1.28 Hangzhou Silan Microelectronics
- 12.1.28.1. Company Overview
- 12.1.28.2. Products
- 12.1.28.3. Company Financials
- 12.1.28.4. SWOT Analysis
- 12.1.29 Yangzhou Yangjie Electronic Technology
- 12.1.29.1. Company Overview
- 12.1.29.2. Products
- 12.1.29.3. Company Financials
- 12.1.29.4. SWOT Analysis
- 12.1.30 China Resources Microelectronics Limited
- 12.1.30.1. Company Overview
- 12.1.30.2. Products
- 12.1.30.3. Company Financials
- 12.1.30.4. SWOT Analysis
- 12.1.31 Jilin Sino-Microelectronics
- 12.1.31.1. Company Overview
- 12.1.31.2. Products
- 12.1.31.3. Company Financials
- 12.1.31.4. SWOT Analysis
- 12.1.32 StarPower
- 12.1.32.1. Company Overview
- 12.1.32.2. Products
- 12.1.32.3. Company Financials
- 12.1.32.4. SWOT Analysis
- 12.1.33 NCEPOWER
- 12.1.33.1. Company Overview
- 12.1.33.2. Products
- 12.1.33.3. Company Financials
- 12.1.33.4. SWOT Analysis
- 12.1.34 Hangzhou Li-On Microelectronics Corporation
- 12.1.34.1. Company Overview
- 12.1.34.2. Products
- 12.1.34.3. Company Financials
- 12.1.34.4. SWOT Analysis
- 12.1.35 Jiangsu Jiejie Microelectronics
- 12.1.35.1. Company Overview
- 12.1.35.2. Products
- 12.1.35.3. Company Financials
- 12.1.35.4. SWOT Analysis
- 12.1.36 OmniVision Technologies
- 12.1.36.1. Company Overview
- 12.1.36.2. Products
- 12.1.36.3. Company Financials
- 12.1.36.4. SWOT Analysis
- 12.1.37 Suzhou Good-Ark Electronics
- 12.1.37.1. Company Overview
- 12.1.37.2. Products
- 12.1.37.3. Company Financials
- 12.1.37.4. SWOT Analysis
- 12.1.38 Zhuzhou CRRC Times Electric
- 12.1.38.1. Company Overview
- 12.1.38.2. Products
- 12.1.38.3. Company Financials
- 12.1.38.4. SWOT Analysis
- 12.1.39 WeEn Semiconductors
- 12.1.39.1. Company Overview
- 12.1.39.2. Products
- 12.1.39.3. Company Financials
- 12.1.39.4. SWOT Analysis
- 12.1.40 Changzhou Galaxy Century Microelectronics
- 12.1.40.1. Company Overview
- 12.1.40.2. Products
- 12.1.40.3. Company Financials
- 12.1.40.4. SWOT Analysis
- 12.1.41 MacMic Science & Technolog
- 12.1.41.1. Company Overview
- 12.1.41.2. Products
- 12.1.41.3. Company Financials
- 12.1.41.4. SWOT Analysis
- 12.1.42 BYD
- 12.1.42.1. Company Overview
- 12.1.42.2. Products
- 12.1.42.3. Company Financials
- 12.1.42.4. SWOT Analysis
- 12.1.43 Hubei TECH Semiconductors
- 12.1.43.1. Company Overview
- 12.1.43.2. Products
- 12.1.43.3. Company Financials
- 12.1.43.4. SWOT Analysis
- 12.1.44 JSC Mikron
- 12.1.44.1. Company Overview
- 12.1.44.2. Products
- 12.1.44.3. Company Financials
- 12.1.44.4. SWOT Analysis
- 12.1.1 Infineon
- 12.2. Market Entropy
- 12.2.1 Company's Key Areas Served
- 12.2.2 Recent Developments
- 12.3. Company Market Share Analysis 2025
- 12.3.1 Top 5 Companies Market Share Analysis
- 12.3.2 Top 3 Companies Market Share Analysis
- 12.4. List of Potential Customers
- 13. Research Methodology
List of Figures
- Figure 1: Global Power Discrete Semiconductor Revenue Breakdown (undefined, %) by Region 2025 & 2033
- Figure 2: North America Power Discrete Semiconductor Revenue (undefined), by Application 2025 & 2033
- Figure 3: North America Power Discrete Semiconductor Revenue Share (%), by Application 2025 & 2033
- Figure 4: North America Power Discrete Semiconductor Revenue (undefined), by Types 2025 & 2033
- Figure 5: North America Power Discrete Semiconductor Revenue Share (%), by Types 2025 & 2033
- Figure 6: North America Power Discrete Semiconductor Revenue (undefined), by Country 2025 & 2033
- Figure 7: North America Power Discrete Semiconductor Revenue Share (%), by Country 2025 & 2033
- Figure 8: South America Power Discrete Semiconductor Revenue (undefined), by Application 2025 & 2033
- Figure 9: South America Power Discrete Semiconductor Revenue Share (%), by Application 2025 & 2033
- Figure 10: South America Power Discrete Semiconductor Revenue (undefined), by Types 2025 & 2033
- Figure 11: South America Power Discrete Semiconductor Revenue Share (%), by Types 2025 & 2033
- Figure 12: South America Power Discrete Semiconductor Revenue (undefined), by Country 2025 & 2033
- Figure 13: South America Power Discrete Semiconductor Revenue Share (%), by Country 2025 & 2033
- Figure 14: Europe Power Discrete Semiconductor Revenue (undefined), by Application 2025 & 2033
- Figure 15: Europe Power Discrete Semiconductor Revenue Share (%), by Application 2025 & 2033
- Figure 16: Europe Power Discrete Semiconductor Revenue (undefined), by Types 2025 & 2033
- Figure 17: Europe Power Discrete Semiconductor Revenue Share (%), by Types 2025 & 2033
- Figure 18: Europe Power Discrete Semiconductor Revenue (undefined), by Country 2025 & 2033
- Figure 19: Europe Power Discrete Semiconductor Revenue Share (%), by Country 2025 & 2033
- Figure 20: Middle East & Africa Power Discrete Semiconductor Revenue (undefined), by Application 2025 & 2033
- Figure 21: Middle East & Africa Power Discrete Semiconductor Revenue Share (%), by Application 2025 & 2033
- Figure 22: Middle East & Africa Power Discrete Semiconductor Revenue (undefined), by Types 2025 & 2033
- Figure 23: Middle East & Africa Power Discrete Semiconductor Revenue Share (%), by Types 2025 & 2033
- Figure 24: Middle East & Africa Power Discrete Semiconductor Revenue (undefined), by Country 2025 & 2033
- Figure 25: Middle East & Africa Power Discrete Semiconductor Revenue Share (%), by Country 2025 & 2033
- Figure 26: Asia Pacific Power Discrete Semiconductor Revenue (undefined), by Application 2025 & 2033
- Figure 27: Asia Pacific Power Discrete Semiconductor Revenue Share (%), by Application 2025 & 2033
- Figure 28: Asia Pacific Power Discrete Semiconductor Revenue (undefined), by Types 2025 & 2033
- Figure 29: Asia Pacific Power Discrete Semiconductor Revenue Share (%), by Types 2025 & 2033
- Figure 30: Asia Pacific Power Discrete Semiconductor Revenue (undefined), by Country 2025 & 2033
- Figure 31: Asia Pacific Power Discrete Semiconductor Revenue Share (%), by Country 2025 & 2033
List of Tables
- Table 1: Global Power Discrete Semiconductor Revenue undefined Forecast, by Application 2020 & 2033
- Table 2: Global Power Discrete Semiconductor Revenue undefined Forecast, by Types 2020 & 2033
- Table 3: Global Power Discrete Semiconductor Revenue undefined Forecast, by Region 2020 & 2033
- Table 4: Global Power Discrete Semiconductor Revenue undefined Forecast, by Application 2020 & 2033
- Table 5: Global Power Discrete Semiconductor Revenue undefined Forecast, by Types 2020 & 2033
- Table 6: Global Power Discrete Semiconductor Revenue undefined Forecast, by Country 2020 & 2033
- Table 7: United States Power Discrete Semiconductor Revenue (undefined) Forecast, by Application 2020 & 2033
- Table 8: Canada Power Discrete Semiconductor Revenue (undefined) Forecast, by Application 2020 & 2033
- Table 9: Mexico Power Discrete Semiconductor Revenue (undefined) Forecast, by Application 2020 & 2033
- Table 10: Global Power Discrete Semiconductor Revenue undefined Forecast, by Application 2020 & 2033
- Table 11: Global Power Discrete Semiconductor Revenue undefined Forecast, by Types 2020 & 2033
- Table 12: Global Power Discrete Semiconductor Revenue undefined Forecast, by Country 2020 & 2033
- Table 13: Brazil Power Discrete Semiconductor Revenue (undefined) Forecast, by Application 2020 & 2033
- Table 14: Argentina Power Discrete Semiconductor Revenue (undefined) Forecast, by Application 2020 & 2033
- Table 15: Rest of South America Power Discrete Semiconductor Revenue (undefined) Forecast, by Application 2020 & 2033
- Table 16: Global Power Discrete Semiconductor Revenue undefined Forecast, by Application 2020 & 2033
- Table 17: Global Power Discrete Semiconductor Revenue undefined Forecast, by Types 2020 & 2033
- Table 18: Global Power Discrete Semiconductor Revenue undefined Forecast, by Country 2020 & 2033
- Table 19: United Kingdom Power Discrete Semiconductor Revenue (undefined) Forecast, by Application 2020 & 2033
- Table 20: Germany Power Discrete Semiconductor Revenue (undefined) Forecast, by Application 2020 & 2033
- Table 21: France Power Discrete Semiconductor Revenue (undefined) Forecast, by Application 2020 & 2033
- Table 22: Italy Power Discrete Semiconductor Revenue (undefined) Forecast, by Application 2020 & 2033
- Table 23: Spain Power Discrete Semiconductor Revenue (undefined) Forecast, by Application 2020 & 2033
- Table 24: Russia Power Discrete Semiconductor Revenue (undefined) Forecast, by Application 2020 & 2033
- Table 25: Benelux Power Discrete Semiconductor Revenue (undefined) Forecast, by Application 2020 & 2033
- Table 26: Nordics Power Discrete Semiconductor Revenue (undefined) Forecast, by Application 2020 & 2033
- Table 27: Rest of Europe Power Discrete Semiconductor Revenue (undefined) Forecast, by Application 2020 & 2033
- Table 28: Global Power Discrete Semiconductor Revenue undefined Forecast, by Application 2020 & 2033
- Table 29: Global Power Discrete Semiconductor Revenue undefined Forecast, by Types 2020 & 2033
- Table 30: Global Power Discrete Semiconductor Revenue undefined Forecast, by Country 2020 & 2033
- Table 31: Turkey Power Discrete Semiconductor Revenue (undefined) Forecast, by Application 2020 & 2033
- Table 32: Israel Power Discrete Semiconductor Revenue (undefined) Forecast, by Application 2020 & 2033
- Table 33: GCC Power Discrete Semiconductor Revenue (undefined) Forecast, by Application 2020 & 2033
- Table 34: North Africa Power Discrete Semiconductor Revenue (undefined) Forecast, by Application 2020 & 2033
- Table 35: South Africa Power Discrete Semiconductor Revenue (undefined) Forecast, by Application 2020 & 2033
- Table 36: Rest of Middle East & Africa Power Discrete Semiconductor Revenue (undefined) Forecast, by Application 2020 & 2033
- Table 37: Global Power Discrete Semiconductor Revenue undefined Forecast, by Application 2020 & 2033
- Table 38: Global Power Discrete Semiconductor Revenue undefined Forecast, by Types 2020 & 2033
- Table 39: Global Power Discrete Semiconductor Revenue undefined Forecast, by Country 2020 & 2033
- Table 40: China Power Discrete Semiconductor Revenue (undefined) Forecast, by Application 2020 & 2033
- Table 41: India Power Discrete Semiconductor Revenue (undefined) Forecast, by Application 2020 & 2033
- Table 42: Japan Power Discrete Semiconductor Revenue (undefined) Forecast, by Application 2020 & 2033
- Table 43: South Korea Power Discrete Semiconductor Revenue (undefined) Forecast, by Application 2020 & 2033
- Table 44: ASEAN Power Discrete Semiconductor Revenue (undefined) Forecast, by Application 2020 & 2033
- Table 45: Oceania Power Discrete Semiconductor Revenue (undefined) Forecast, by Application 2020 & 2033
- Table 46: Rest of Asia Pacific Power Discrete Semiconductor Revenue (undefined) Forecast, by Application 2020 & 2033
Frequently Asked Questions
1. What is the projected Compound Annual Growth Rate (CAGR) of the Power Discrete Semiconductor?
The projected CAGR is approximately 11.9%.
2. Which companies are prominent players in the Power Discrete Semiconductor?
Key companies in the market include Infineon, Onsemi, ST Microelectronics, Mitsubishi Electric (Vincotech), Nexperia, Vishay Intertechnology, Toshiba, Fuji Electric, Rohm, Renesas Electronics, Diodes Incorporated, Littelfuse (IXYS), Alpha & Omega Semiconductor, SEMIKRON, Hitachi Power Semiconductor Device, Microchip, Sanken Electric, Semtech, MagnaChip, Danfoss, Bosch, Texas Instruments, KEC Corporation, Cree (Wolfspeed), PANJIT Group, Unisonic Technologies (UTC), Niko Semiconductor, Hangzhou Silan Microelectronics, Yangzhou Yangjie Electronic Technology, China Resources Microelectronics Limited, Jilin Sino-Microelectronics, StarPower, NCEPOWER, Hangzhou Li-On Microelectronics Corporation, Jiangsu Jiejie Microelectronics, OmniVision Technologies, Suzhou Good-Ark Electronics, Zhuzhou CRRC Times Electric, WeEn Semiconductors, Changzhou Galaxy Century Microelectronics, MacMic Science & Technolog, BYD, Hubei TECH Semiconductors, JSC Mikron.
3. What are the main segments of the Power Discrete Semiconductor?
The market segments include Application, Types.
4. Can you provide details about the market size?
The market size is estimated to be USD XXX N/A as of 2022.
5. What are some drivers contributing to market growth?
N/A
6. What are the notable trends driving market growth?
N/A
7. Are there any restraints impacting market growth?
N/A
8. Can you provide examples of recent developments in the market?
N/A
9. What pricing options are available for accessing the report?
Pricing options include single-user, multi-user, and enterprise licenses priced at USD 2900.00, USD 4350.00, and USD 5800.00 respectively.
10. Is the market size provided in terms of value or volume?
The market size is provided in terms of value, measured in N/A.
11. Are there any specific market keywords associated with the report?
Yes, the market keyword associated with the report is "Power Discrete Semiconductor," which aids in identifying and referencing the specific market segment covered.
12. How do I determine which pricing option suits my needs best?
The pricing options vary based on user requirements and access needs. Individual users may opt for single-user licenses, while businesses requiring broader access may choose multi-user or enterprise licenses for cost-effective access to the report.
13. Are there any additional resources or data provided in the Power Discrete Semiconductor report?
While the report offers comprehensive insights, it's advisable to review the specific contents or supplementary materials provided to ascertain if additional resources or data are available.
14. How can I stay updated on further developments or reports in the Power Discrete Semiconductor?
To stay informed about further developments, trends, and reports in the Power Discrete Semiconductor, consider subscribing to industry newsletters, following relevant companies and organizations, or regularly checking reputable industry news sources and publications.
Methodology
Step 1 - Identification of Relevant Samples Size from Population Database


Step 2 - Approaches for Defining Global Market Size (Value, Volume* & Price*)

Note*: In applicable scenarios
Step 3 - Data Sources
Primary Research
- Web Analytics
- Survey Reports
- Research Institute
- Latest Research Reports
- Opinion Leaders
Secondary Research
- Annual Reports
- White Paper
- Latest Press Release
- Industry Association
- Paid Database
- Investor Presentations

Step 4 - Data Triangulation
Involves using different sources of information in order to increase the validity of a study
These sources are likely to be stakeholders in a program - participants, other researchers, program staff, other community members, and so on.
Then we put all data in single framework & apply various statistical tools to find out the dynamic on the market.
During the analysis stage, feedback from the stakeholder groups would be compared to determine areas of agreement as well as areas of divergence