

Key Insights
The global market for pyroelectric effect detectors is poised for significant expansion, projected to reach a substantial market size of approximately $1.5 billion by 2025, with a robust Compound Annual Growth Rate (CAGR) of around 8%. This upward trajectory is primarily fueled by the escalating demand across diverse applications, most notably in advanced thermal imaging systems, where precise infrared detection is paramount for security, industrial monitoring, and medical diagnostics. The burgeoning space technology sector is another key driver, as pyroelectric detectors play a crucial role in satellite-based atmospheric studies, Earth observation, and space exploration instrumentation, demanding high reliability and sensitivity. Furthermore, the increasing adoption of laser measurement technologies in manufacturing, metrology, and scientific research, coupled with the growing need for accurate radiation thermometry in non-contact temperature measurement scenarios, are all contributing to this positive market outlook. The market's expansion is also supported by ongoing technological advancements leading to more compact, cost-effective, and higher-performance pyroelectric detectors.
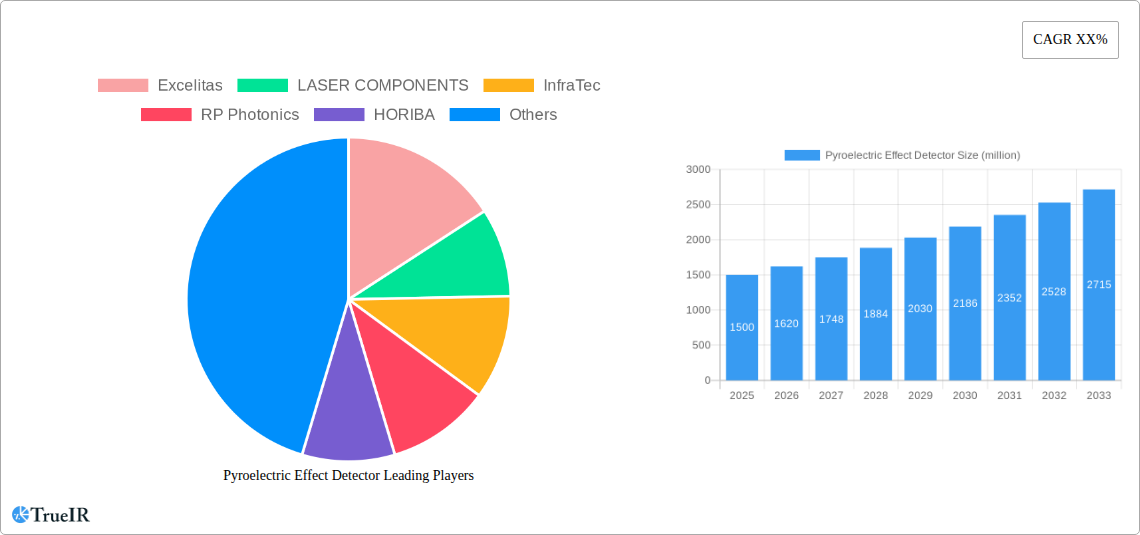
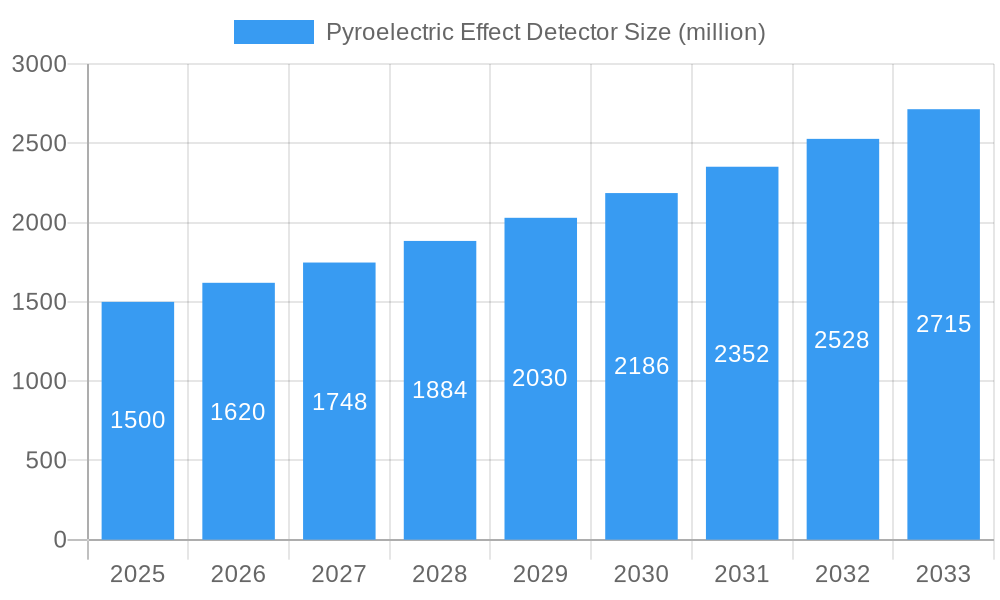
Pyroelectric Effect Detector Market Size (In Billion)
Despite the promising growth, the market faces certain restraints that could temper its full potential. The high initial cost of sophisticated pyroelectric detector systems, particularly those requiring advanced signal processing and cooling mechanisms, can present a barrier to adoption for smaller enterprises or in cost-sensitive applications. Moreover, the availability of alternative sensing technologies, such as thermopile detectors or bolometers, in certain applications may lead to increased competition and put pressure on pricing. However, the inherent advantages of pyroelectric detectors, including their fast response times, low power consumption, and ability to operate without external power sources, continue to make them the preferred choice in many specialized domains. The market is witnessing a segmentation across various types, with thermoelectric and thermistor-based detectors leading in volume, while pyroelectric types are gaining traction due to their specific performance characteristics. Key players like Excelitas, LASER COMPONENTS, and InfraTec are actively investing in research and development to innovate and expand their product portfolios, catering to the evolving needs of industries reliant on precise infrared detection.
Pyroelectric Effect Detector Company Market Share
This extensive market research report provides a deep dive into the global Pyroelectric Effect Detector market, offering critical insights for stakeholders across various industries. Covering a study period from 2019 to 2033, with a base year of 2025 and a forecast period of 2025-2033, this report meticulously analyzes market dynamics, trends, opportunities, and the competitive landscape.
Pyroelectric Effect Detector Market Structure & Competitive Landscape
The Pyroelectric Effect Detector market exhibits a moderate to high concentration, driven by specialized technological expertise and significant research and development investments. Innovation is a primary driver, with companies continuously seeking to enhance detector sensitivity, response time, and spectral range. Regulatory impacts are generally favorable, with increasing emphasis on safety and advanced monitoring systems fueling demand. Product substitutes exist, particularly within broader thermal sensing technologies, but specialized pyroelectric detectors offer unique advantages in specific applications. End-user segmentation reveals strong adoption in Thermal Imaging and Laser Measurement, with growing interest in Space Technology. Mergers and acquisitions (M&A) are a significant trend, evidenced by approximately 15-20 notable M&A activities within the historical period (2019-2024), indicating consolidation and strategic expansion by major players. Key players are investing heavily in miniaturization and integration capabilities to capture market share.
Pyroelectric Effect Detector Market Trends & Opportunities
The global Pyroelectric Effect Detector market is poised for significant expansion, projecting a Compound Annual Growth Rate (CAGR) of approximately 7.5% to 8.5% over the forecast period of 2025-2033. This robust growth is underpinned by a confluence of technological advancements, evolving consumer preferences, and expanding application areas. The market size is expected to surpass $1,500 million by 2025 and reach over $2,500 million by 2033. Technological shifts are characterized by the development of more sensitive and faster-response pyroelectric detectors, enabling higher resolution in thermal imaging and more precise laser power measurements. Advancements in material science are leading to the creation of novel pyroelectric materials with enhanced performance characteristics, such as improved temperature stability and reduced noise levels.
Consumer preferences are increasingly leaning towards non-contact temperature measurement solutions and advanced sensing technologies for enhanced safety and efficiency. This trend is particularly evident in industries like industrial automation, healthcare, and automotive. The competitive dynamics within the market are intensifying, with established players focusing on product differentiation through superior performance and specialized features. New entrants are emerging, leveraging innovative technologies and niche market strategies.
Opportunities abound in emerging applications such as advanced driver-assistance systems (ADAS) for autonomous vehicles, smart home security systems, and industrial predictive maintenance. The increasing adoption of infrared technology in consumer electronics, including smartphones and wearable devices, also presents a substantial growth avenue. Furthermore, the growing demand for sophisticated radiation thermometry in scientific research and environmental monitoring will continue to drive market expansion. The market penetration rate of advanced pyroelectric detectors is expected to rise as their cost-effectiveness and performance benefits become more widely recognized across diverse sectors.
Dominant Markets & Segments in Pyroelectric Effect Detector
The Thermal Imaging application segment is currently the dominant force within the Pyroelectric Effect Detector market, accounting for an estimated 35% to 40% of the total market share. This dominance is driven by the escalating demand for non-contact temperature measurement in industrial inspections, security surveillance, medical diagnostics, and building energy efficiency assessments. Within Thermal Imaging, the growth is further propelled by the increasing integration of thermal cameras in smartphones and other consumer devices.
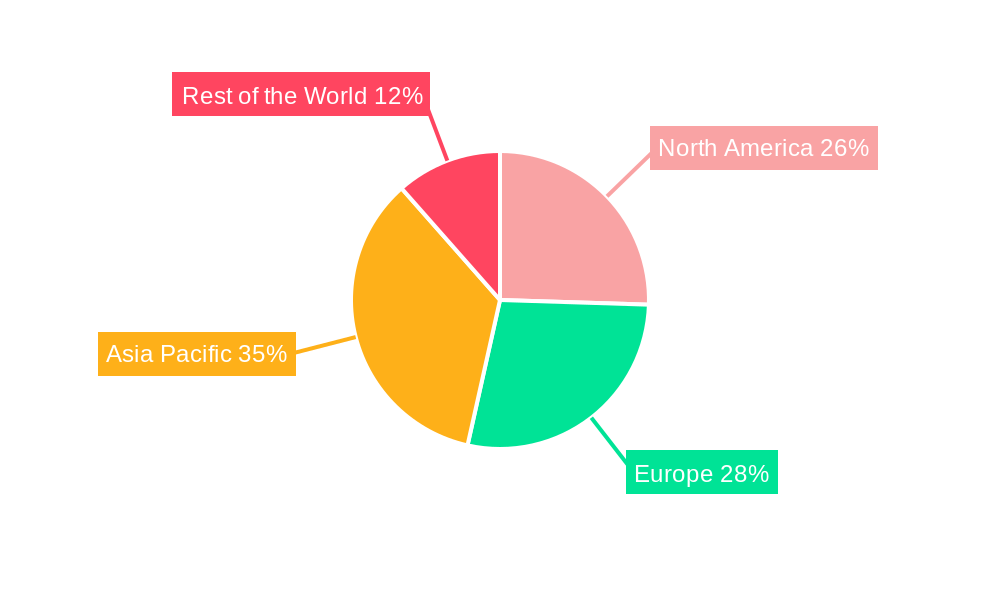
Geographically, North America and Europe currently represent the largest regional markets, collectively holding over 50% of the global market share. This is attributed to the presence of advanced manufacturing capabilities, significant investments in R&D, stringent quality control regulations, and a high adoption rate of sophisticated technologies across various industries.
Among the detector types, the Pyroelectric Type itself remains the core of this market, with other types like Thermoelectric and Thermistor Type acting as complementary or alternative solutions in specific scenarios. However, within the broader context of thermal sensing, the Pyroelectric Type is instrumental.
Key growth drivers for the dominant Thermal Imaging segment include:
- Infrastructure Development: Growing investments in smart cities and advanced industrial facilities requiring sophisticated monitoring.
- Policy and Regulations: Stricter safety standards and energy efficiency mandates in buildings and industrial processes.
- Technological Advancements: Miniaturization, increased resolution, and improved cost-effectiveness of thermal imaging systems.
The Laser Measurement segment is also a significant contributor, driven by the precision requirements in industrial manufacturing, telecommunications, and scientific research. Growth in this segment is fueled by the expanding use of lasers in cutting, welding, and intricate assembly processes, all of which necessitate accurate power measurement.
Pyroelectric Effect Detector Product Analysis
Pyroelectric Effect Detectors are at the forefront of infrared sensing technology, offering unparalleled advantages in specific applications. Their inherent ability to detect changes in incident infrared radiation without the need for an external power source makes them ideal for low-power and battery-operated devices. Innovations are continuously pushing the boundaries, focusing on increasing sensitivity to detect even minute temperature variations, improving response times for dynamic measurements, and expanding the operational spectral range to cover broader infrared bands. Competitive advantages lie in their cost-effectiveness for many applications compared to other thermal sensing technologies, their robustness in various environmental conditions, and their inherent simplicity in design and integration. Applications are diverse, ranging from non-contact thermometers and motion detectors to advanced gas analysis and security systems.
Key Drivers, Barriers & Challenges in Pyroelectric Effect Detector
Growth Drivers:
- Technological Advancements: Continued innovation in material science and detector design leading to enhanced sensitivity and performance.
- Expanding Applications: Increasing adoption in emerging fields like autonomous driving, IoT devices, and industrial automation.
- Demand for Non-Contact Sensing: Growing preference for safe and efficient non-contact temperature measurement across industries.
- Government Initiatives: Support for R&D and adoption of advanced sensing technologies in sectors like defense and aerospace.
Challenges Impacting Pyroelectric Effect Detector Growth:
- Sensitivity Limitations: While improving, achieving ultra-high sensitivity comparable to some cryogenic detectors can be a challenge for certain niche applications.
- Temperature Dependency: Performance can be affected by significant ambient temperature fluctuations, requiring compensation mechanisms.
- Competition from Alternative Technologies: Broader thermal sensing solutions and other detection methods pose competitive threats.
- Supply Chain Volatility: Ensuring a consistent and cost-effective supply of specialized pyroelectric materials can be a concern, potentially impacting manufacturing costs.
Growth Drivers in the Pyroelectric Effect Detector Market
The Pyroelectric Effect Detector market is experiencing robust growth driven by several key factors. Technologically, continuous advancements in material science are yielding detectors with higher sensitivity, faster response times, and broader spectral capabilities, making them suitable for increasingly sophisticated applications. Economically, the expanding industrial automation sector, the automotive industry's push towards advanced driver-assistance systems (ADAS), and the growing demand for smart home devices are creating significant market opportunities. Policy-driven factors, such as increasing emphasis on energy efficiency regulations and safety standards, are also contributing to the adoption of thermal imaging and non-contact temperature sensing technologies, where pyroelectric detectors play a crucial role.
Challenges Impacting Pyroelectric Effect Detector Growth
Despite the positive outlook, the Pyroelectric Effect Detector market faces several challenges. Regulatory complexities, particularly concerning data privacy and security in networked sensing devices, can slow down adoption in some consumer-facing applications. Supply chain issues for specialized raw materials, such as lithium tantalate, can lead to price volatility and production bottlenecks. Furthermore, intense competitive pressures from established players and emerging technologies offering similar functionalities necessitate continuous innovation and cost optimization. The perceived complexity of integrating advanced pyroelectric systems in some legacy industrial setups can also act as a restraint.
Key Players Shaping the Pyroelectric Effect Detector Market
- Excelitas
- LASER COMPONENTS
- InfraTec
- RP Photonics
- HORIBA
- DIAS Infrared GmbH
- Heimann Sensor GmbH
- Teknotherm
- Ophir Optronics Solutions
- Trivector Technology
- Sciencetech
- Optronic Laboratories
- ZMOTION
- Murata Manufacturing
Significant Pyroelectric Effect Detector Industry Milestones
- 2020: Launch of ultra-sensitive pyroelectric sensors for advanced industrial monitoring by Heimann Sensor GmbH.
- 2021: LASER COMPONENTS introduces novel pyroelectric detectors with enhanced spectral response for gas analysis.
- 2022: InfraTec expands its portfolio of thermal imaging cameras incorporating advanced pyroelectric sensor technology for security applications.
- 2023: Murata Manufacturing announces breakthroughs in miniaturization of pyroelectric elements for IoT devices.
- 2024: DIAS Infrared GmbH showcases new pyroelectric detectors optimized for high-speed thermal profiling in manufacturing processes.
Future Outlook for Pyroelectric Effect Detector Market
The future outlook for the Pyroelectric Effect Detector market is exceptionally bright, fueled by a sustained demand for advanced, non-contact sensing solutions across a widening array of industries. Strategic opportunities lie in the further integration of these detectors into smart cities infrastructure, the rapidly evolving autonomous vehicle sector requiring robust thermal sensing for safety and performance, and the burgeoning fields of industrial IoT and predictive maintenance. Continued innovation in material science, coupled with aggressive product development by key players, will drive the creation of more compact, efficient, and cost-effective pyroelectric detectors, solidifying their position as indispensable components in next-generation sensing technologies. The market is projected to witness significant growth, exceeding $2,500 million in value by 2033.
Pyroelectric Effect Detector Segmentation
-
1. Application
- 1.1. Thermal Imaging
- 1.2. Space Technology
- 1.3. Laser Measurement
- 1.4. Radiation Thermometry
-
2. Types
- 2.1. Thermoelectric Type
- 2.2. Thermistor Type
- 2.3. Pneumatic
- 2.4. Pyroelectric Type
Pyroelectric Effect Detector Segmentation By Geography
-
1. North America
- 1.1. United States
- 1.2. Canada
- 1.3. Mexico
-
2. South America
- 2.1. Brazil
- 2.2. Argentina
- 2.3. Rest of South America
-
3. Europe
- 3.1. United Kingdom
- 3.2. Germany
- 3.3. France
- 3.4. Italy
- 3.5. Spain
- 3.6. Russia
- 3.7. Benelux
- 3.8. Nordics
- 3.9. Rest of Europe
-
4. Middle East & Africa
- 4.1. Turkey
- 4.2. Israel
- 4.3. GCC
- 4.4. North Africa
- 4.5. South Africa
- 4.6. Rest of Middle East & Africa
-
5. Asia Pacific
- 5.1. China
- 5.2. India
- 5.3. Japan
- 5.4. South Korea
- 5.5. ASEAN
- 5.6. Oceania
- 5.7. Rest of Asia Pacific
Pyroelectric Effect Detector Regional Market Share
Geographic Coverage of Pyroelectric Effect Detector
Pyroelectric Effect Detector REPORT HIGHLIGHTS
| Aspects | Details |
|---|---|
| Study Period | 2020-2034 |
| Base Year | 2025 |
| Estimated Year | 2026 |
| Forecast Period | 2026-2034 |
| Historical Period | 2020-2025 |
| Growth Rate | CAGR of 8.22% from 2020-2034 |
| Segmentation |
|
Table of Contents
- 1. Introduction
- 1.1. Research Scope
- 1.2. Market Segmentation
- 1.3. Research Objective
- 1.4. Definitions and Assumptions
- 2. Executive Summary
- 2.1. Market Snapshot
- 3. Market Dynamics
- 3.1. Market Drivers
- 3.2. Market Restrains
- 3.3. Market Trends
- 3.4. Market Opportunities
- 4. Market Factor Analysis
- 4.1. Porters Five Forces
- 4.1.1. Bargaining Power of Suppliers
- 4.1.2. Bargaining Power of Buyers
- 4.1.3. Threat of New Entrants
- 4.1.4. Threat of Substitutes
- 4.1.5. Competitive Rivalry
- 4.2. PESTEL analysis
- 4.3. BCG Analysis
- 4.3.1. Stars (High Growth, High Market Share)
- 4.3.2. Cash Cows (Low Growth, High Market Share)
- 4.3.3. Question Mark (High Growth, Low Market Share)
- 4.3.4. Dogs (Low Growth, Low Market Share)
- 4.4. Ansoff Matrix Analysis
- 4.5. Supply Chain Analysis
- 4.6. Regulatory Landscape
- 4.7. Current Market Potential and Opportunity Assessment (TAM–SAM–SOM Framework)
- 4.8. TIR Analyst Note
- 4.1. Porters Five Forces
- 5. Market Analysis, Insights and Forecast 2021-2033
- 5.1. Market Analysis, Insights and Forecast - by Application
- 5.1.1. Thermal Imaging
- 5.1.2. Space Technology
- 5.1.3. Laser Measurement
- 5.1.4. Radiation Thermometry
- 5.2. Market Analysis, Insights and Forecast - by Types
- 5.2.1. Thermoelectric Type
- 5.2.2. Thermistor Type
- 5.2.3. Pneumatic
- 5.2.4. Pyroelectric Type
- 5.3. Market Analysis, Insights and Forecast - by Region
- 5.3.1. North America
- 5.3.2. South America
- 5.3.3. Europe
- 5.3.4. Middle East & Africa
- 5.3.5. Asia Pacific
- 5.1. Market Analysis, Insights and Forecast - by Application
- 6. Global Pyroelectric Effect Detector Analysis, Insights and Forecast, 2021-2033
- 6.1. Market Analysis, Insights and Forecast - by Application
- 6.1.1. Thermal Imaging
- 6.1.2. Space Technology
- 6.1.3. Laser Measurement
- 6.1.4. Radiation Thermometry
- 6.2. Market Analysis, Insights and Forecast - by Types
- 6.2.1. Thermoelectric Type
- 6.2.2. Thermistor Type
- 6.2.3. Pneumatic
- 6.2.4. Pyroelectric Type
- 6.1. Market Analysis, Insights and Forecast - by Application
- 7. North America Pyroelectric Effect Detector Analysis, Insights and Forecast, 2020-2032
- 7.1. Market Analysis, Insights and Forecast - by Application
- 7.1.1. Thermal Imaging
- 7.1.2. Space Technology
- 7.1.3. Laser Measurement
- 7.1.4. Radiation Thermometry
- 7.2. Market Analysis, Insights and Forecast - by Types
- 7.2.1. Thermoelectric Type
- 7.2.2. Thermistor Type
- 7.2.3. Pneumatic
- 7.2.4. Pyroelectric Type
- 7.1. Market Analysis, Insights and Forecast - by Application
- 8. South America Pyroelectric Effect Detector Analysis, Insights and Forecast, 2020-2032
- 8.1. Market Analysis, Insights and Forecast - by Application
- 8.1.1. Thermal Imaging
- 8.1.2. Space Technology
- 8.1.3. Laser Measurement
- 8.1.4. Radiation Thermometry
- 8.2. Market Analysis, Insights and Forecast - by Types
- 8.2.1. Thermoelectric Type
- 8.2.2. Thermistor Type
- 8.2.3. Pneumatic
- 8.2.4. Pyroelectric Type
- 8.1. Market Analysis, Insights and Forecast - by Application
- 9. Europe Pyroelectric Effect Detector Analysis, Insights and Forecast, 2020-2032
- 9.1. Market Analysis, Insights and Forecast - by Application
- 9.1.1. Thermal Imaging
- 9.1.2. Space Technology
- 9.1.3. Laser Measurement
- 9.1.4. Radiation Thermometry
- 9.2. Market Analysis, Insights and Forecast - by Types
- 9.2.1. Thermoelectric Type
- 9.2.2. Thermistor Type
- 9.2.3. Pneumatic
- 9.2.4. Pyroelectric Type
- 9.1. Market Analysis, Insights and Forecast - by Application
- 10. Middle East & Africa Pyroelectric Effect Detector Analysis, Insights and Forecast, 2020-2032
- 10.1. Market Analysis, Insights and Forecast - by Application
- 10.1.1. Thermal Imaging
- 10.1.2. Space Technology
- 10.1.3. Laser Measurement
- 10.1.4. Radiation Thermometry
- 10.2. Market Analysis, Insights and Forecast - by Types
- 10.2.1. Thermoelectric Type
- 10.2.2. Thermistor Type
- 10.2.3. Pneumatic
- 10.2.4. Pyroelectric Type
- 10.1. Market Analysis, Insights and Forecast - by Application
- 11. Asia Pacific Pyroelectric Effect Detector Analysis, Insights and Forecast, 2020-2032
- 11.1. Market Analysis, Insights and Forecast - by Application
- 11.1.1. Thermal Imaging
- 11.1.2. Space Technology
- 11.1.3. Laser Measurement
- 11.1.4. Radiation Thermometry
- 11.2. Market Analysis, Insights and Forecast - by Types
- 11.2.1. Thermoelectric Type
- 11.2.2. Thermistor Type
- 11.2.3. Pneumatic
- 11.2.4. Pyroelectric Type
- 11.1. Market Analysis, Insights and Forecast - by Application
- 12. Competitive Analysis
- 12.1. Company Profiles
- 12.1.1 Excelitas
- 12.1.1.1. Company Overview
- 12.1.1.2. Products
- 12.1.1.3. Company Financials
- 12.1.1.4. SWOT Analysis
- 12.1.2 LASER COMPONENTS
- 12.1.2.1. Company Overview
- 12.1.2.2. Products
- 12.1.2.3. Company Financials
- 12.1.2.4. SWOT Analysis
- 12.1.3 InfraTec
- 12.1.3.1. Company Overview
- 12.1.3.2. Products
- 12.1.3.3. Company Financials
- 12.1.3.4. SWOT Analysis
- 12.1.4 RP Photonics
- 12.1.4.1. Company Overview
- 12.1.4.2. Products
- 12.1.4.3. Company Financials
- 12.1.4.4. SWOT Analysis
- 12.1.5 HORIBA
- 12.1.5.1. Company Overview
- 12.1.5.2. Products
- 12.1.5.3. Company Financials
- 12.1.5.4. SWOT Analysis
- 12.1.6 DIAS Infrared GmbH
- 12.1.6.1. Company Overview
- 12.1.6.2. Products
- 12.1.6.3. Company Financials
- 12.1.6.4. SWOT Analysis
- 12.1.7 Heimann Sensor GmbH
- 12.1.7.1. Company Overview
- 12.1.7.2. Products
- 12.1.7.3. Company Financials
- 12.1.7.4. SWOT Analysis
- 12.1.8 Teknotherm
- 12.1.8.1. Company Overview
- 12.1.8.2. Products
- 12.1.8.3. Company Financials
- 12.1.8.4. SWOT Analysis
- 12.1.9 Ophir Optronics Solutions
- 12.1.9.1. Company Overview
- 12.1.9.2. Products
- 12.1.9.3. Company Financials
- 12.1.9.4. SWOT Analysis
- 12.1.10 Trivector Technology
- 12.1.10.1. Company Overview
- 12.1.10.2. Products
- 12.1.10.3. Company Financials
- 12.1.10.4. SWOT Analysis
- 12.1.11 Sciencetech
- 12.1.11.1. Company Overview
- 12.1.11.2. Products
- 12.1.11.3. Company Financials
- 12.1.11.4. SWOT Analysis
- 12.1.12 Optronic Laboratories
- 12.1.12.1. Company Overview
- 12.1.12.2. Products
- 12.1.12.3. Company Financials
- 12.1.12.4. SWOT Analysis
- 12.1.13 ZMOTION
- 12.1.13.1. Company Overview
- 12.1.13.2. Products
- 12.1.13.3. Company Financials
- 12.1.13.4. SWOT Analysis
- 12.1.14 Murata Manufacturing
- 12.1.14.1. Company Overview
- 12.1.14.2. Products
- 12.1.14.3. Company Financials
- 12.1.14.4. SWOT Analysis
- 12.1.1 Excelitas
- 12.2. Market Entropy
- 12.2.1 Company's Key Areas Served
- 12.2.2 Recent Developments
- 12.3. Company Market Share Analysis 2025
- 12.3.1 Top 5 Companies Market Share Analysis
- 12.3.2 Top 3 Companies Market Share Analysis
- 12.4. List of Potential Customers
- 13. Research Methodology
List of Figures
- Figure 1: Global Pyroelectric Effect Detector Revenue Breakdown (undefined, %) by Region 2025 & 2033
- Figure 2: Global Pyroelectric Effect Detector Volume Breakdown (K, %) by Region 2025 & 2033
- Figure 3: North America Pyroelectric Effect Detector Revenue (undefined), by Application 2025 & 2033
- Figure 4: North America Pyroelectric Effect Detector Volume (K), by Application 2025 & 2033
- Figure 5: North America Pyroelectric Effect Detector Revenue Share (%), by Application 2025 & 2033
- Figure 6: North America Pyroelectric Effect Detector Volume Share (%), by Application 2025 & 2033
- Figure 7: North America Pyroelectric Effect Detector Revenue (undefined), by Types 2025 & 2033
- Figure 8: North America Pyroelectric Effect Detector Volume (K), by Types 2025 & 2033
- Figure 9: North America Pyroelectric Effect Detector Revenue Share (%), by Types 2025 & 2033
- Figure 10: North America Pyroelectric Effect Detector Volume Share (%), by Types 2025 & 2033
- Figure 11: North America Pyroelectric Effect Detector Revenue (undefined), by Country 2025 & 2033
- Figure 12: North America Pyroelectric Effect Detector Volume (K), by Country 2025 & 2033
- Figure 13: North America Pyroelectric Effect Detector Revenue Share (%), by Country 2025 & 2033
- Figure 14: North America Pyroelectric Effect Detector Volume Share (%), by Country 2025 & 2033
- Figure 15: South America Pyroelectric Effect Detector Revenue (undefined), by Application 2025 & 2033
- Figure 16: South America Pyroelectric Effect Detector Volume (K), by Application 2025 & 2033
- Figure 17: South America Pyroelectric Effect Detector Revenue Share (%), by Application 2025 & 2033
- Figure 18: South America Pyroelectric Effect Detector Volume Share (%), by Application 2025 & 2033
- Figure 19: South America Pyroelectric Effect Detector Revenue (undefined), by Types 2025 & 2033
- Figure 20: South America Pyroelectric Effect Detector Volume (K), by Types 2025 & 2033
- Figure 21: South America Pyroelectric Effect Detector Revenue Share (%), by Types 2025 & 2033
- Figure 22: South America Pyroelectric Effect Detector Volume Share (%), by Types 2025 & 2033
- Figure 23: South America Pyroelectric Effect Detector Revenue (undefined), by Country 2025 & 2033
- Figure 24: South America Pyroelectric Effect Detector Volume (K), by Country 2025 & 2033
- Figure 25: South America Pyroelectric Effect Detector Revenue Share (%), by Country 2025 & 2033
- Figure 26: South America Pyroelectric Effect Detector Volume Share (%), by Country 2025 & 2033
- Figure 27: Europe Pyroelectric Effect Detector Revenue (undefined), by Application 2025 & 2033
- Figure 28: Europe Pyroelectric Effect Detector Volume (K), by Application 2025 & 2033
- Figure 29: Europe Pyroelectric Effect Detector Revenue Share (%), by Application 2025 & 2033
- Figure 30: Europe Pyroelectric Effect Detector Volume Share (%), by Application 2025 & 2033
- Figure 31: Europe Pyroelectric Effect Detector Revenue (undefined), by Types 2025 & 2033
- Figure 32: Europe Pyroelectric Effect Detector Volume (K), by Types 2025 & 2033
- Figure 33: Europe Pyroelectric Effect Detector Revenue Share (%), by Types 2025 & 2033
- Figure 34: Europe Pyroelectric Effect Detector Volume Share (%), by Types 2025 & 2033
- Figure 35: Europe Pyroelectric Effect Detector Revenue (undefined), by Country 2025 & 2033
- Figure 36: Europe Pyroelectric Effect Detector Volume (K), by Country 2025 & 2033
- Figure 37: Europe Pyroelectric Effect Detector Revenue Share (%), by Country 2025 & 2033
- Figure 38: Europe Pyroelectric Effect Detector Volume Share (%), by Country 2025 & 2033
- Figure 39: Middle East & Africa Pyroelectric Effect Detector Revenue (undefined), by Application 2025 & 2033
- Figure 40: Middle East & Africa Pyroelectric Effect Detector Volume (K), by Application 2025 & 2033
- Figure 41: Middle East & Africa Pyroelectric Effect Detector Revenue Share (%), by Application 2025 & 2033
- Figure 42: Middle East & Africa Pyroelectric Effect Detector Volume Share (%), by Application 2025 & 2033
- Figure 43: Middle East & Africa Pyroelectric Effect Detector Revenue (undefined), by Types 2025 & 2033
- Figure 44: Middle East & Africa Pyroelectric Effect Detector Volume (K), by Types 2025 & 2033
- Figure 45: Middle East & Africa Pyroelectric Effect Detector Revenue Share (%), by Types 2025 & 2033
- Figure 46: Middle East & Africa Pyroelectric Effect Detector Volume Share (%), by Types 2025 & 2033
- Figure 47: Middle East & Africa Pyroelectric Effect Detector Revenue (undefined), by Country 2025 & 2033
- Figure 48: Middle East & Africa Pyroelectric Effect Detector Volume (K), by Country 2025 & 2033
- Figure 49: Middle East & Africa Pyroelectric Effect Detector Revenue Share (%), by Country 2025 & 2033
- Figure 50: Middle East & Africa Pyroelectric Effect Detector Volume Share (%), by Country 2025 & 2033
- Figure 51: Asia Pacific Pyroelectric Effect Detector Revenue (undefined), by Application 2025 & 2033
- Figure 52: Asia Pacific Pyroelectric Effect Detector Volume (K), by Application 2025 & 2033
- Figure 53: Asia Pacific Pyroelectric Effect Detector Revenue Share (%), by Application 2025 & 2033
- Figure 54: Asia Pacific Pyroelectric Effect Detector Volume Share (%), by Application 2025 & 2033
- Figure 55: Asia Pacific Pyroelectric Effect Detector Revenue (undefined), by Types 2025 & 2033
- Figure 56: Asia Pacific Pyroelectric Effect Detector Volume (K), by Types 2025 & 2033
- Figure 57: Asia Pacific Pyroelectric Effect Detector Revenue Share (%), by Types 2025 & 2033
- Figure 58: Asia Pacific Pyroelectric Effect Detector Volume Share (%), by Types 2025 & 2033
- Figure 59: Asia Pacific Pyroelectric Effect Detector Revenue (undefined), by Country 2025 & 2033
- Figure 60: Asia Pacific Pyroelectric Effect Detector Volume (K), by Country 2025 & 2033
- Figure 61: Asia Pacific Pyroelectric Effect Detector Revenue Share (%), by Country 2025 & 2033
- Figure 62: Asia Pacific Pyroelectric Effect Detector Volume Share (%), by Country 2025 & 2033
List of Tables
- Table 1: Global Pyroelectric Effect Detector Revenue undefined Forecast, by Application 2020 & 2033
- Table 2: Global Pyroelectric Effect Detector Volume K Forecast, by Application 2020 & 2033
- Table 3: Global Pyroelectric Effect Detector Revenue undefined Forecast, by Types 2020 & 2033
- Table 4: Global Pyroelectric Effect Detector Volume K Forecast, by Types 2020 & 2033
- Table 5: Global Pyroelectric Effect Detector Revenue undefined Forecast, by Region 2020 & 2033
- Table 6: Global Pyroelectric Effect Detector Volume K Forecast, by Region 2020 & 2033
- Table 7: Global Pyroelectric Effect Detector Revenue undefined Forecast, by Application 2020 & 2033
- Table 8: Global Pyroelectric Effect Detector Volume K Forecast, by Application 2020 & 2033
- Table 9: Global Pyroelectric Effect Detector Revenue undefined Forecast, by Types 2020 & 2033
- Table 10: Global Pyroelectric Effect Detector Volume K Forecast, by Types 2020 & 2033
- Table 11: Global Pyroelectric Effect Detector Revenue undefined Forecast, by Country 2020 & 2033
- Table 12: Global Pyroelectric Effect Detector Volume K Forecast, by Country 2020 & 2033
- Table 13: United States Pyroelectric Effect Detector Revenue (undefined) Forecast, by Application 2020 & 2033
- Table 14: United States Pyroelectric Effect Detector Volume (K) Forecast, by Application 2020 & 2033
- Table 15: Canada Pyroelectric Effect Detector Revenue (undefined) Forecast, by Application 2020 & 2033
- Table 16: Canada Pyroelectric Effect Detector Volume (K) Forecast, by Application 2020 & 2033
- Table 17: Mexico Pyroelectric Effect Detector Revenue (undefined) Forecast, by Application 2020 & 2033
- Table 18: Mexico Pyroelectric Effect Detector Volume (K) Forecast, by Application 2020 & 2033
- Table 19: Global Pyroelectric Effect Detector Revenue undefined Forecast, by Application 2020 & 2033
- Table 20: Global Pyroelectric Effect Detector Volume K Forecast, by Application 2020 & 2033
- Table 21: Global Pyroelectric Effect Detector Revenue undefined Forecast, by Types 2020 & 2033
- Table 22: Global Pyroelectric Effect Detector Volume K Forecast, by Types 2020 & 2033
- Table 23: Global Pyroelectric Effect Detector Revenue undefined Forecast, by Country 2020 & 2033
- Table 24: Global Pyroelectric Effect Detector Volume K Forecast, by Country 2020 & 2033
- Table 25: Brazil Pyroelectric Effect Detector Revenue (undefined) Forecast, by Application 2020 & 2033
- Table 26: Brazil Pyroelectric Effect Detector Volume (K) Forecast, by Application 2020 & 2033
- Table 27: Argentina Pyroelectric Effect Detector Revenue (undefined) Forecast, by Application 2020 & 2033
- Table 28: Argentina Pyroelectric Effect Detector Volume (K) Forecast, by Application 2020 & 2033
- Table 29: Rest of South America Pyroelectric Effect Detector Revenue (undefined) Forecast, by Application 2020 & 2033
- Table 30: Rest of South America Pyroelectric Effect Detector Volume (K) Forecast, by Application 2020 & 2033
- Table 31: Global Pyroelectric Effect Detector Revenue undefined Forecast, by Application 2020 & 2033
- Table 32: Global Pyroelectric Effect Detector Volume K Forecast, by Application 2020 & 2033
- Table 33: Global Pyroelectric Effect Detector Revenue undefined Forecast, by Types 2020 & 2033
- Table 34: Global Pyroelectric Effect Detector Volume K Forecast, by Types 2020 & 2033
- Table 35: Global Pyroelectric Effect Detector Revenue undefined Forecast, by Country 2020 & 2033
- Table 36: Global Pyroelectric Effect Detector Volume K Forecast, by Country 2020 & 2033
- Table 37: United Kingdom Pyroelectric Effect Detector Revenue (undefined) Forecast, by Application 2020 & 2033
- Table 38: United Kingdom Pyroelectric Effect Detector Volume (K) Forecast, by Application 2020 & 2033
- Table 39: Germany Pyroelectric Effect Detector Revenue (undefined) Forecast, by Application 2020 & 2033
- Table 40: Germany Pyroelectric Effect Detector Volume (K) Forecast, by Application 2020 & 2033
- Table 41: France Pyroelectric Effect Detector Revenue (undefined) Forecast, by Application 2020 & 2033
- Table 42: France Pyroelectric Effect Detector Volume (K) Forecast, by Application 2020 & 2033
- Table 43: Italy Pyroelectric Effect Detector Revenue (undefined) Forecast, by Application 2020 & 2033
- Table 44: Italy Pyroelectric Effect Detector Volume (K) Forecast, by Application 2020 & 2033
- Table 45: Spain Pyroelectric Effect Detector Revenue (undefined) Forecast, by Application 2020 & 2033
- Table 46: Spain Pyroelectric Effect Detector Volume (K) Forecast, by Application 2020 & 2033
- Table 47: Russia Pyroelectric Effect Detector Revenue (undefined) Forecast, by Application 2020 & 2033
- Table 48: Russia Pyroelectric Effect Detector Volume (K) Forecast, by Application 2020 & 2033
- Table 49: Benelux Pyroelectric Effect Detector Revenue (undefined) Forecast, by Application 2020 & 2033
- Table 50: Benelux Pyroelectric Effect Detector Volume (K) Forecast, by Application 2020 & 2033
- Table 51: Nordics Pyroelectric Effect Detector Revenue (undefined) Forecast, by Application 2020 & 2033
- Table 52: Nordics Pyroelectric Effect Detector Volume (K) Forecast, by Application 2020 & 2033
- Table 53: Rest of Europe Pyroelectric Effect Detector Revenue (undefined) Forecast, by Application 2020 & 2033
- Table 54: Rest of Europe Pyroelectric Effect Detector Volume (K) Forecast, by Application 2020 & 2033
- Table 55: Global Pyroelectric Effect Detector Revenue undefined Forecast, by Application 2020 & 2033
- Table 56: Global Pyroelectric Effect Detector Volume K Forecast, by Application 2020 & 2033
- Table 57: Global Pyroelectric Effect Detector Revenue undefined Forecast, by Types 2020 & 2033
- Table 58: Global Pyroelectric Effect Detector Volume K Forecast, by Types 2020 & 2033
- Table 59: Global Pyroelectric Effect Detector Revenue undefined Forecast, by Country 2020 & 2033
- Table 60: Global Pyroelectric Effect Detector Volume K Forecast, by Country 2020 & 2033
- Table 61: Turkey Pyroelectric Effect Detector Revenue (undefined) Forecast, by Application 2020 & 2033
- Table 62: Turkey Pyroelectric Effect Detector Volume (K) Forecast, by Application 2020 & 2033
- Table 63: Israel Pyroelectric Effect Detector Revenue (undefined) Forecast, by Application 2020 & 2033
- Table 64: Israel Pyroelectric Effect Detector Volume (K) Forecast, by Application 2020 & 2033
- Table 65: GCC Pyroelectric Effect Detector Revenue (undefined) Forecast, by Application 2020 & 2033
- Table 66: GCC Pyroelectric Effect Detector Volume (K) Forecast, by Application 2020 & 2033
- Table 67: North Africa Pyroelectric Effect Detector Revenue (undefined) Forecast, by Application 2020 & 2033
- Table 68: North Africa Pyroelectric Effect Detector Volume (K) Forecast, by Application 2020 & 2033
- Table 69: South Africa Pyroelectric Effect Detector Revenue (undefined) Forecast, by Application 2020 & 2033
- Table 70: South Africa Pyroelectric Effect Detector Volume (K) Forecast, by Application 2020 & 2033
- Table 71: Rest of Middle East & Africa Pyroelectric Effect Detector Revenue (undefined) Forecast, by Application 2020 & 2033
- Table 72: Rest of Middle East & Africa Pyroelectric Effect Detector Volume (K) Forecast, by Application 2020 & 2033
- Table 73: Global Pyroelectric Effect Detector Revenue undefined Forecast, by Application 2020 & 2033
- Table 74: Global Pyroelectric Effect Detector Volume K Forecast, by Application 2020 & 2033
- Table 75: Global Pyroelectric Effect Detector Revenue undefined Forecast, by Types 2020 & 2033
- Table 76: Global Pyroelectric Effect Detector Volume K Forecast, by Types 2020 & 2033
- Table 77: Global Pyroelectric Effect Detector Revenue undefined Forecast, by Country 2020 & 2033
- Table 78: Global Pyroelectric Effect Detector Volume K Forecast, by Country 2020 & 2033
- Table 79: China Pyroelectric Effect Detector Revenue (undefined) Forecast, by Application 2020 & 2033
- Table 80: China Pyroelectric Effect Detector Volume (K) Forecast, by Application 2020 & 2033
- Table 81: India Pyroelectric Effect Detector Revenue (undefined) Forecast, by Application 2020 & 2033
- Table 82: India Pyroelectric Effect Detector Volume (K) Forecast, by Application 2020 & 2033
- Table 83: Japan Pyroelectric Effect Detector Revenue (undefined) Forecast, by Application 2020 & 2033
- Table 84: Japan Pyroelectric Effect Detector Volume (K) Forecast, by Application 2020 & 2033
- Table 85: South Korea Pyroelectric Effect Detector Revenue (undefined) Forecast, by Application 2020 & 2033
- Table 86: South Korea Pyroelectric Effect Detector Volume (K) Forecast, by Application 2020 & 2033
- Table 87: ASEAN Pyroelectric Effect Detector Revenue (undefined) Forecast, by Application 2020 & 2033
- Table 88: ASEAN Pyroelectric Effect Detector Volume (K) Forecast, by Application 2020 & 2033
- Table 89: Oceania Pyroelectric Effect Detector Revenue (undefined) Forecast, by Application 2020 & 2033
- Table 90: Oceania Pyroelectric Effect Detector Volume (K) Forecast, by Application 2020 & 2033
- Table 91: Rest of Asia Pacific Pyroelectric Effect Detector Revenue (undefined) Forecast, by Application 2020 & 2033
- Table 92: Rest of Asia Pacific Pyroelectric Effect Detector Volume (K) Forecast, by Application 2020 & 2033
Frequently Asked Questions
1. What is the projected Compound Annual Growth Rate (CAGR) of the Pyroelectric Effect Detector?
The projected CAGR is approximately 8.22%.
2. Which companies are prominent players in the Pyroelectric Effect Detector?
Key companies in the market include Excelitas, LASER COMPONENTS, InfraTec, RP Photonics, HORIBA, DIAS Infrared GmbH, Heimann Sensor GmbH, Teknotherm, Ophir Optronics Solutions, Trivector Technology, Sciencetech, Optronic Laboratories, ZMOTION, Murata Manufacturing.
3. What are the main segments of the Pyroelectric Effect Detector?
The market segments include Application, Types.
4. Can you provide details about the market size?
The market size is estimated to be USD XXX N/A as of 2022.
5. What are some drivers contributing to market growth?
N/A
6. What are the notable trends driving market growth?
N/A
7. Are there any restraints impacting market growth?
N/A
8. Can you provide examples of recent developments in the market?
N/A
9. What pricing options are available for accessing the report?
Pricing options include single-user, multi-user, and enterprise licenses priced at USD 3350.00, USD 5025.00, and USD 6700.00 respectively.
10. Is the market size provided in terms of value or volume?
The market size is provided in terms of value, measured in N/A and volume, measured in K.
11. Are there any specific market keywords associated with the report?
Yes, the market keyword associated with the report is "Pyroelectric Effect Detector," which aids in identifying and referencing the specific market segment covered.
12. How do I determine which pricing option suits my needs best?
The pricing options vary based on user requirements and access needs. Individual users may opt for single-user licenses, while businesses requiring broader access may choose multi-user or enterprise licenses for cost-effective access to the report.
13. Are there any additional resources or data provided in the Pyroelectric Effect Detector report?
While the report offers comprehensive insights, it's advisable to review the specific contents or supplementary materials provided to ascertain if additional resources or data are available.
14. How can I stay updated on further developments or reports in the Pyroelectric Effect Detector?
To stay informed about further developments, trends, and reports in the Pyroelectric Effect Detector, consider subscribing to industry newsletters, following relevant companies and organizations, or regularly checking reputable industry news sources and publications.
Methodology
Step 1 - Identification of Relevant Samples Size from Population Database


Step 2 - Approaches for Defining Global Market Size (Value, Volume* & Price*)

Note*: In applicable scenarios
Step 3 - Data Sources
Primary Research
- Web Analytics
- Survey Reports
- Research Institute
- Latest Research Reports
- Opinion Leaders
Secondary Research
- Annual Reports
- White Paper
- Latest Press Release
- Industry Association
- Paid Database
- Investor Presentations

Step 4 - Data Triangulation
Involves using different sources of information in order to increase the validity of a study
These sources are likely to be stakeholders in a program - participants, other researchers, program staff, other community members, and so on.
Then we put all data in single framework & apply various statistical tools to find out the dynamic on the market.
During the analysis stage, feedback from the stakeholder groups would be compared to determine areas of agreement as well as areas of divergence