

Key Insights
The global ride height sensor market is experiencing robust growth, driven by increasing adoption in the automotive industry, particularly within the burgeoning electric vehicle (EV) and advanced driver-assistance systems (ADAS) sectors. The market's expansion is fueled by the rising demand for enhanced vehicle safety and improved ride comfort. Technological advancements leading to more accurate and reliable sensor technologies, coupled with miniaturization and cost reductions, are further propelling market growth. While the automotive OEM segment currently dominates, the automotive aftermarket segment is projected to witness significant growth due to the increasing number of older vehicles requiring sensor replacements and upgrades. The 200mm type sensors currently hold a larger market share, but the 500mm type sensors are expected to gain traction due to their superior performance characteristics in specific applications. Key players like KA Sensors, Arnott, and Dorman Products are actively investing in R&D and strategic partnerships to maintain their market positions and capitalize on emerging opportunities. Geographic growth is diverse, with North America and Europe leading the market currently, but the Asia-Pacific region, particularly China and India, is poised for significant expansion due to rapid automotive production growth in these markets. Challenges include the high initial cost of implementation and potential supply chain disruptions, however, continuous technological innovation and increasing demand are likely to offset these restraints.
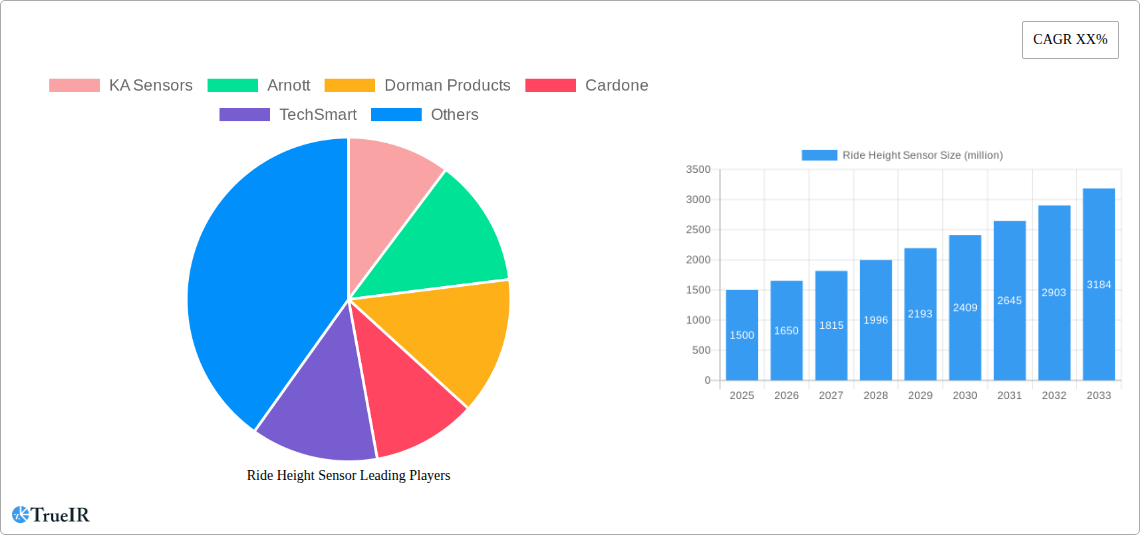
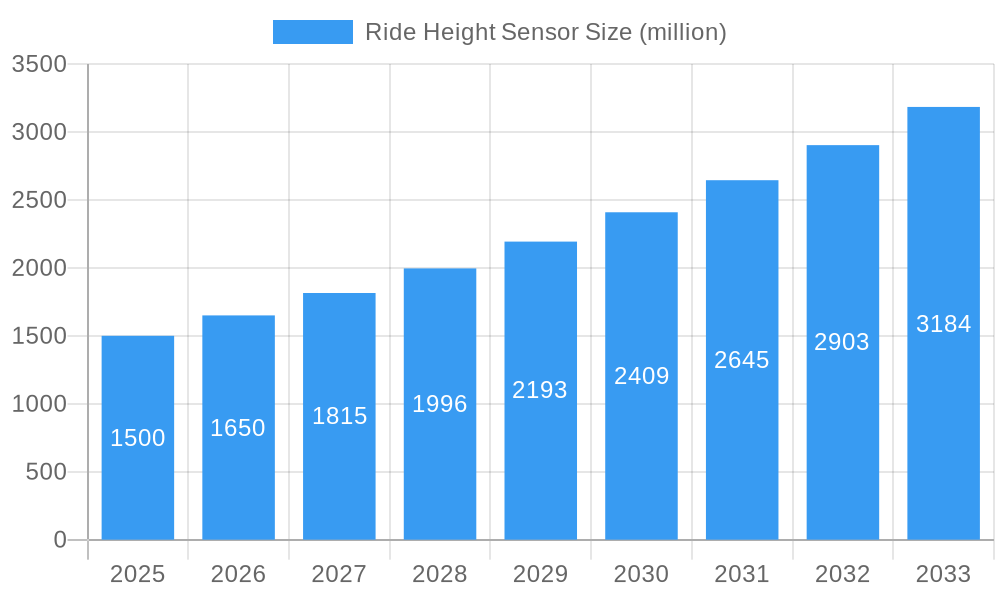
Ride Height Sensor Market Size (In Billion)
The forecast period from 2025 to 2033 anticipates a substantial increase in market value, fueled by the factors mentioned above. Competition is expected to intensify among existing players and new entrants, leading to innovation and price optimization. To maintain a competitive edge, manufacturers are focusing on developing sensors with improved durability, accuracy, and integration capabilities. The market segmentation by application (OEM vs. Aftermarket) and sensor type (200mm, 500mm, etc.) provides valuable insights for strategic decision-making. Further growth will be influenced by evolving government regulations regarding vehicle safety and emissions, along with advancements in autonomous driving technologies which are strongly reliant on precise ride height measurement.
Ride Height Sensor Company Market Share
Ride Height Sensor Market Report: A Comprehensive Analysis of a Multi-Million Dollar Industry (2019-2033)
This dynamic report provides a comprehensive analysis of the global Ride Height Sensor market, projecting a multi-million dollar valuation by 2033. It delves into market structure, competitive dynamics, technological advancements, and growth opportunities within the automotive OEM and aftermarket segments. The study covers the historical period (2019-2024), base year (2025), and forecast period (2025-2033), offering invaluable insights for businesses and investors. Key players like KA Sensors, Arnott, Dorman Products, Cardone, TechSmart, Acuity, and Variohm are analyzed in detail. The report also explores various sensor types, including 200mm type and 500mm type, providing a granular understanding of market segmentation and future trends.
Ride Height Sensor Market Structure & Competitive Landscape
The global ride height sensor market is characterized by a moderately concentrated structure, with the top five players holding an estimated xx% market share in 2025. Innovation in sensor technology, particularly in areas like improved accuracy and durability, is a key driver. Stringent regulatory requirements concerning vehicle safety and emissions are impacting market dynamics, pushing manufacturers towards more advanced sensor solutions. The increasing preference for advanced driver-assistance systems (ADAS) and autonomous driving technologies further fuels market growth. Product substitutes, such as alternative suspension systems, pose a limited threat due to the critical role ride height sensors play in vehicle safety and performance. The automotive OEM segment currently dominates, but the aftermarket segment is experiencing significant growth driven by increasing vehicle age and the need for repair and replacement. M&A activity in the industry has been moderate, with approximately xx mergers and acquisitions recorded between 2019 and 2024, primarily focused on expanding product portfolios and geographic reach. Future consolidation is anticipated, driven by the need for scale and technological expertise.
- Market Concentration: Top 5 players hold xx% market share (2025).
- Innovation Drivers: Improved accuracy, durability, integration with ADAS.
- Regulatory Impacts: Stringent safety and emission standards.
- Product Substitutes: Limited threat from alternative suspension systems.
- End-User Segmentation: Automotive OEM (dominant), Automotive Aftermarket (growing).
- M&A Trends: Approximately xx M&A deals between 2019 and 2024.
Ride Height Sensor Market Trends & Opportunities
The global ride height sensor market is poised for substantial growth, exhibiting a projected Compound Annual Growth Rate (CAGR) of xx% during the forecast period (2025-2033). This expansion is fueled by several factors including the rising adoption of advanced driver-assistance systems (ADAS) in vehicles globally. The increasing demand for enhanced vehicle safety features and the growing popularity of electric and hybrid vehicles are further contributing to market growth. Technological advancements, such as the miniaturization of sensors and the development of more robust and reliable components, are also enhancing market prospects. Consumer preference for improved ride comfort and vehicle handling, coupled with stricter emission regulations, is driving the adoption of advanced sensor technologies. The competitive landscape is characterized by both established players and emerging entrants, leading to intense competition and continuous innovation. Market penetration rates are increasing in developing economies as vehicle ownership expands, further supporting market growth. The shift towards connected cars and the integration of ride height sensors with vehicle telematics systems present significant opportunities for future growth. The market is expected to reach approximately $xx million by 2033.
Dominant Markets & Segments in Ride Height Sensor
The automotive OEM segment represents the largest application area for ride height sensors, accounting for approximately xx% of the market in 2025. The Asia-Pacific region is projected to be the leading market during the forecast period, driven by substantial automotive production and rising vehicle sales. Within sensor types, the 200mm type holds the largest market share due to its widespread application in various vehicle models.
Key Growth Drivers (Asia-Pacific):
- Rapid automotive production growth.
- Increasing vehicle sales.
- Growing adoption of ADAS and autonomous driving technologies.
- Government support for automotive industry development.
Automotive OEM Segment Dominance:
- High demand for new vehicle production.
- Integration with ADAS and safety features.
200mm Type Market Leadership:
- Wide compatibility with various vehicle platforms.
- Cost-effectiveness.
Ride Height Sensor Product Analysis
Technological advancements in ride height sensors are primarily focused on improving accuracy, reliability, and durability. Miniaturization efforts are also ongoing to allow for seamless integration into modern vehicle designs. The development of sensors with enhanced capabilities, such as improved environmental resistance and increased operational lifespan, is improving market fit and competitive advantage. These advancements are enhancing the overall performance and longevity of vehicle suspension systems, providing a compelling value proposition to OEMs and aftermarket customers.
Key Drivers, Barriers & Challenges in Ride Height Sensor
Key Drivers: The increasing adoption of ADAS and autonomous driving technologies is a primary driver, along with stringent vehicle safety regulations and the rising demand for enhanced vehicle ride comfort and handling. The growth of the electric vehicle market also presents a significant opportunity for ride height sensors as EVs often have more complex suspension systems.
Challenges: Supply chain disruptions can significantly impact sensor production and availability. Stricter regulatory compliance requirements increase development costs and time-to-market. Intense competition from both established and emerging players puts pressure on pricing and profitability. These challenges, if not properly addressed, could hinder the growth of the ride height sensor market.
Growth Drivers in the Ride Height Sensor Market
Technological advancements, such as the development of miniaturized, highly accurate, and environmentally resistant sensors, are driving market expansion. The increasing demand for improved vehicle safety features and the growth of the electric vehicle market are further fueling growth. Stringent government regulations concerning vehicle emissions and safety also stimulate the adoption of advanced sensor technologies.
Challenges Impacting Ride Height Sensor Growth
Supply chain vulnerabilities and geopolitical uncertainties pose significant challenges. The complexity and cost associated with meeting stringent regulatory standards can hinder market penetration. Intense competition from established and emerging players creates pricing pressures and impacts profitability.
Key Players Shaping the Ride Height Sensor Market
- KA Sensors
- Arnott
- Dorman Products
- Cardone
- TechSmart
- Acuity
- Variohm
Significant Ride Height Sensor Industry Milestones
- 2021: KA Sensors launched a new line of highly accurate ride height sensors.
- 2022: Arnott acquired a smaller competitor, expanding its product portfolio.
- 2023: New regulations concerning sensor accuracy came into effect in several key markets.
Future Outlook for Ride Height Sensor Market
The ride height sensor market is poised for continued growth, driven by the ongoing trends of technological advancement, increasing vehicle safety regulations, and the expansion of the EV market. Strategic partnerships and collaborations between sensor manufacturers and automotive OEMs are anticipated, further accelerating market growth and innovation. The market presents substantial opportunities for companies that can deliver high-quality, reliable, and cost-effective sensor solutions. The integration of ride height sensors with vehicle telematics and autonomous driving systems will unlock new growth avenues in the coming years.
Ride Height Sensor Segmentation
-
1. Application
- 1.1. Automotive OEM
- 1.2. Automotive Aftermarket
-
2. Types
- 2.1. 200mm Type
- 2.2. 500mm Type
- 2.3. Other
Ride Height Sensor Segmentation By Geography
-
1. North America
- 1.1. United States
- 1.2. Canada
- 1.3. Mexico
-
2. South America
- 2.1. Brazil
- 2.2. Argentina
- 2.3. Rest of South America
-
3. Europe
- 3.1. United Kingdom
- 3.2. Germany
- 3.3. France
- 3.4. Italy
- 3.5. Spain
- 3.6. Russia
- 3.7. Benelux
- 3.8. Nordics
- 3.9. Rest of Europe
-
4. Middle East & Africa
- 4.1. Turkey
- 4.2. Israel
- 4.3. GCC
- 4.4. North Africa
- 4.5. South Africa
- 4.6. Rest of Middle East & Africa
-
5. Asia Pacific
- 5.1. China
- 5.2. India
- 5.3. Japan
- 5.4. South Korea
- 5.5. ASEAN
- 5.6. Oceania
- 5.7. Rest of Asia Pacific
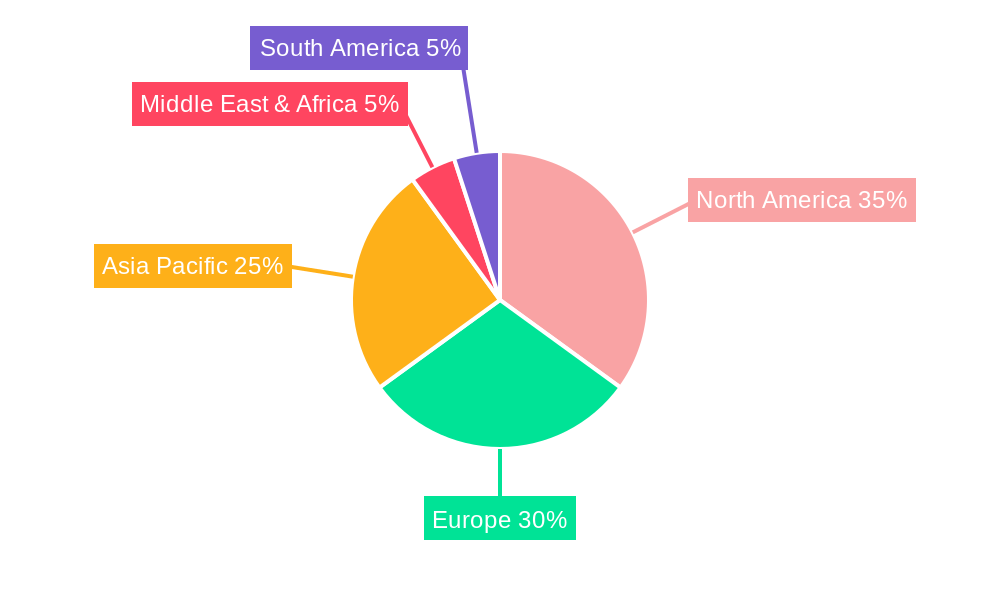
Ride Height Sensor Regional Market Share
Geographic Coverage of Ride Height Sensor
Ride Height Sensor REPORT HIGHLIGHTS
| Aspects | Details |
|---|---|
| Study Period | 2020-2034 |
| Base Year | 2025 |
| Estimated Year | 2026 |
| Forecast Period | 2026-2034 |
| Historical Period | 2020-2025 |
| Growth Rate | CAGR of 10.42% from 2020-2034 |
| Segmentation |
|
Table of Contents
- 1. Introduction
- 1.1. Research Scope
- 1.2. Market Segmentation
- 1.3. Research Objective
- 1.4. Definitions and Assumptions
- 2. Executive Summary
- 2.1. Market Snapshot
- 3. Market Dynamics
- 3.1. Market Drivers
- 3.2. Market Restrains
- 3.3. Market Trends
- 3.4. Market Opportunities
- 4. Market Factor Analysis
- 4.1. Porters Five Forces
- 4.1.1. Bargaining Power of Suppliers
- 4.1.2. Bargaining Power of Buyers
- 4.1.3. Threat of New Entrants
- 4.1.4. Threat of Substitutes
- 4.1.5. Competitive Rivalry
- 4.2. PESTEL analysis
- 4.3. BCG Analysis
- 4.3.1. Stars (High Growth, High Market Share)
- 4.3.2. Cash Cows (Low Growth, High Market Share)
- 4.3.3. Question Mark (High Growth, Low Market Share)
- 4.3.4. Dogs (Low Growth, Low Market Share)
- 4.4. Ansoff Matrix Analysis
- 4.5. Supply Chain Analysis
- 4.6. Regulatory Landscape
- 4.7. Current Market Potential and Opportunity Assessment (TAM–SAM–SOM Framework)
- 4.8. TIR Analyst Note
- 4.1. Porters Five Forces
- 5. Market Analysis, Insights and Forecast 2021-2033
- 5.1. Market Analysis, Insights and Forecast - by Application
- 5.1.1. Automotive OEM
- 5.1.2. Automotive Aftermarket
- 5.2. Market Analysis, Insights and Forecast - by Types
- 5.2.1. 200mm Type
- 5.2.2. 500mm Type
- 5.2.3. Other
- 5.3. Market Analysis, Insights and Forecast - by Region
- 5.3.1. North America
- 5.3.2. South America
- 5.3.3. Europe
- 5.3.4. Middle East & Africa
- 5.3.5. Asia Pacific
- 5.1. Market Analysis, Insights and Forecast - by Application
- 6. Global Ride Height Sensor Analysis, Insights and Forecast, 2021-2033
- 6.1. Market Analysis, Insights and Forecast - by Application
- 6.1.1. Automotive OEM
- 6.1.2. Automotive Aftermarket
- 6.2. Market Analysis, Insights and Forecast - by Types
- 6.2.1. 200mm Type
- 6.2.2. 500mm Type
- 6.2.3. Other
- 6.1. Market Analysis, Insights and Forecast - by Application
- 7. North America Ride Height Sensor Analysis, Insights and Forecast, 2020-2032
- 7.1. Market Analysis, Insights and Forecast - by Application
- 7.1.1. Automotive OEM
- 7.1.2. Automotive Aftermarket
- 7.2. Market Analysis, Insights and Forecast - by Types
- 7.2.1. 200mm Type
- 7.2.2. 500mm Type
- 7.2.3. Other
- 7.1. Market Analysis, Insights and Forecast - by Application
- 8. South America Ride Height Sensor Analysis, Insights and Forecast, 2020-2032
- 8.1. Market Analysis, Insights and Forecast - by Application
- 8.1.1. Automotive OEM
- 8.1.2. Automotive Aftermarket
- 8.2. Market Analysis, Insights and Forecast - by Types
- 8.2.1. 200mm Type
- 8.2.2. 500mm Type
- 8.2.3. Other
- 8.1. Market Analysis, Insights and Forecast - by Application
- 9. Europe Ride Height Sensor Analysis, Insights and Forecast, 2020-2032
- 9.1. Market Analysis, Insights and Forecast - by Application
- 9.1.1. Automotive OEM
- 9.1.2. Automotive Aftermarket
- 9.2. Market Analysis, Insights and Forecast - by Types
- 9.2.1. 200mm Type
- 9.2.2. 500mm Type
- 9.2.3. Other
- 9.1. Market Analysis, Insights and Forecast - by Application
- 10. Middle East & Africa Ride Height Sensor Analysis, Insights and Forecast, 2020-2032
- 10.1. Market Analysis, Insights and Forecast - by Application
- 10.1.1. Automotive OEM
- 10.1.2. Automotive Aftermarket
- 10.2. Market Analysis, Insights and Forecast - by Types
- 10.2.1. 200mm Type
- 10.2.2. 500mm Type
- 10.2.3. Other
- 10.1. Market Analysis, Insights and Forecast - by Application
- 11. Asia Pacific Ride Height Sensor Analysis, Insights and Forecast, 2020-2032
- 11.1. Market Analysis, Insights and Forecast - by Application
- 11.1.1. Automotive OEM
- 11.1.2. Automotive Aftermarket
- 11.2. Market Analysis, Insights and Forecast - by Types
- 11.2.1. 200mm Type
- 11.2.2. 500mm Type
- 11.2.3. Other
- 11.1. Market Analysis, Insights and Forecast - by Application
- 12. Competitive Analysis
- 12.1. Company Profiles
- 12.1.1 KA Sensors
- 12.1.1.1. Company Overview
- 12.1.1.2. Products
- 12.1.1.3. Company Financials
- 12.1.1.4. SWOT Analysis
- 12.1.2 Arnott
- 12.1.2.1. Company Overview
- 12.1.2.2. Products
- 12.1.2.3. Company Financials
- 12.1.2.4. SWOT Analysis
- 12.1.3 Dorman Products
- 12.1.3.1. Company Overview
- 12.1.3.2. Products
- 12.1.3.3. Company Financials
- 12.1.3.4. SWOT Analysis
- 12.1.4 Cardone
- 12.1.4.1. Company Overview
- 12.1.4.2. Products
- 12.1.4.3. Company Financials
- 12.1.4.4. SWOT Analysis
- 12.1.5 TechSmart
- 12.1.5.1. Company Overview
- 12.1.5.2. Products
- 12.1.5.3. Company Financials
- 12.1.5.4. SWOT Analysis
- 12.1.6 Acuity
- 12.1.6.1. Company Overview
- 12.1.6.2. Products
- 12.1.6.3. Company Financials
- 12.1.6.4. SWOT Analysis
- 12.1.7 Variohm
- 12.1.7.1. Company Overview
- 12.1.7.2. Products
- 12.1.7.3. Company Financials
- 12.1.7.4. SWOT Analysis
- 12.1.1 KA Sensors
- 12.2. Market Entropy
- 12.2.1 Company's Key Areas Served
- 12.2.2 Recent Developments
- 12.3. Company Market Share Analysis 2025
- 12.3.1 Top 5 Companies Market Share Analysis
- 12.3.2 Top 3 Companies Market Share Analysis
- 12.4. List of Potential Customers
- 13. Research Methodology
List of Figures
- Figure 1: Global Ride Height Sensor Revenue Breakdown (undefined, %) by Region 2025 & 2033
- Figure 2: North America Ride Height Sensor Revenue (undefined), by Application 2025 & 2033
- Figure 3: North America Ride Height Sensor Revenue Share (%), by Application 2025 & 2033
- Figure 4: North America Ride Height Sensor Revenue (undefined), by Types 2025 & 2033
- Figure 5: North America Ride Height Sensor Revenue Share (%), by Types 2025 & 2033
- Figure 6: North America Ride Height Sensor Revenue (undefined), by Country 2025 & 2033
- Figure 7: North America Ride Height Sensor Revenue Share (%), by Country 2025 & 2033
- Figure 8: South America Ride Height Sensor Revenue (undefined), by Application 2025 & 2033
- Figure 9: South America Ride Height Sensor Revenue Share (%), by Application 2025 & 2033
- Figure 10: South America Ride Height Sensor Revenue (undefined), by Types 2025 & 2033
- Figure 11: South America Ride Height Sensor Revenue Share (%), by Types 2025 & 2033
- Figure 12: South America Ride Height Sensor Revenue (undefined), by Country 2025 & 2033
- Figure 13: South America Ride Height Sensor Revenue Share (%), by Country 2025 & 2033
- Figure 14: Europe Ride Height Sensor Revenue (undefined), by Application 2025 & 2033
- Figure 15: Europe Ride Height Sensor Revenue Share (%), by Application 2025 & 2033
- Figure 16: Europe Ride Height Sensor Revenue (undefined), by Types 2025 & 2033
- Figure 17: Europe Ride Height Sensor Revenue Share (%), by Types 2025 & 2033
- Figure 18: Europe Ride Height Sensor Revenue (undefined), by Country 2025 & 2033
- Figure 19: Europe Ride Height Sensor Revenue Share (%), by Country 2025 & 2033
- Figure 20: Middle East & Africa Ride Height Sensor Revenue (undefined), by Application 2025 & 2033
- Figure 21: Middle East & Africa Ride Height Sensor Revenue Share (%), by Application 2025 & 2033
- Figure 22: Middle East & Africa Ride Height Sensor Revenue (undefined), by Types 2025 & 2033
- Figure 23: Middle East & Africa Ride Height Sensor Revenue Share (%), by Types 2025 & 2033
- Figure 24: Middle East & Africa Ride Height Sensor Revenue (undefined), by Country 2025 & 2033
- Figure 25: Middle East & Africa Ride Height Sensor Revenue Share (%), by Country 2025 & 2033
- Figure 26: Asia Pacific Ride Height Sensor Revenue (undefined), by Application 2025 & 2033
- Figure 27: Asia Pacific Ride Height Sensor Revenue Share (%), by Application 2025 & 2033
- Figure 28: Asia Pacific Ride Height Sensor Revenue (undefined), by Types 2025 & 2033
- Figure 29: Asia Pacific Ride Height Sensor Revenue Share (%), by Types 2025 & 2033
- Figure 30: Asia Pacific Ride Height Sensor Revenue (undefined), by Country 2025 & 2033
- Figure 31: Asia Pacific Ride Height Sensor Revenue Share (%), by Country 2025 & 2033
List of Tables
- Table 1: Global Ride Height Sensor Revenue undefined Forecast, by Application 2020 & 2033
- Table 2: Global Ride Height Sensor Revenue undefined Forecast, by Types 2020 & 2033
- Table 3: Global Ride Height Sensor Revenue undefined Forecast, by Region 2020 & 2033
- Table 4: Global Ride Height Sensor Revenue undefined Forecast, by Application 2020 & 2033
- Table 5: Global Ride Height Sensor Revenue undefined Forecast, by Types 2020 & 2033
- Table 6: Global Ride Height Sensor Revenue undefined Forecast, by Country 2020 & 2033
- Table 7: United States Ride Height Sensor Revenue (undefined) Forecast, by Application 2020 & 2033
- Table 8: Canada Ride Height Sensor Revenue (undefined) Forecast, by Application 2020 & 2033
- Table 9: Mexico Ride Height Sensor Revenue (undefined) Forecast, by Application 2020 & 2033
- Table 10: Global Ride Height Sensor Revenue undefined Forecast, by Application 2020 & 2033
- Table 11: Global Ride Height Sensor Revenue undefined Forecast, by Types 2020 & 2033
- Table 12: Global Ride Height Sensor Revenue undefined Forecast, by Country 2020 & 2033
- Table 13: Brazil Ride Height Sensor Revenue (undefined) Forecast, by Application 2020 & 2033
- Table 14: Argentina Ride Height Sensor Revenue (undefined) Forecast, by Application 2020 & 2033
- Table 15: Rest of South America Ride Height Sensor Revenue (undefined) Forecast, by Application 2020 & 2033
- Table 16: Global Ride Height Sensor Revenue undefined Forecast, by Application 2020 & 2033
- Table 17: Global Ride Height Sensor Revenue undefined Forecast, by Types 2020 & 2033
- Table 18: Global Ride Height Sensor Revenue undefined Forecast, by Country 2020 & 2033
- Table 19: United Kingdom Ride Height Sensor Revenue (undefined) Forecast, by Application 2020 & 2033
- Table 20: Germany Ride Height Sensor Revenue (undefined) Forecast, by Application 2020 & 2033
- Table 21: France Ride Height Sensor Revenue (undefined) Forecast, by Application 2020 & 2033
- Table 22: Italy Ride Height Sensor Revenue (undefined) Forecast, by Application 2020 & 2033
- Table 23: Spain Ride Height Sensor Revenue (undefined) Forecast, by Application 2020 & 2033
- Table 24: Russia Ride Height Sensor Revenue (undefined) Forecast, by Application 2020 & 2033
- Table 25: Benelux Ride Height Sensor Revenue (undefined) Forecast, by Application 2020 & 2033
- Table 26: Nordics Ride Height Sensor Revenue (undefined) Forecast, by Application 2020 & 2033
- Table 27: Rest of Europe Ride Height Sensor Revenue (undefined) Forecast, by Application 2020 & 2033
- Table 28: Global Ride Height Sensor Revenue undefined Forecast, by Application 2020 & 2033
- Table 29: Global Ride Height Sensor Revenue undefined Forecast, by Types 2020 & 2033
- Table 30: Global Ride Height Sensor Revenue undefined Forecast, by Country 2020 & 2033
- Table 31: Turkey Ride Height Sensor Revenue (undefined) Forecast, by Application 2020 & 2033
- Table 32: Israel Ride Height Sensor Revenue (undefined) Forecast, by Application 2020 & 2033
- Table 33: GCC Ride Height Sensor Revenue (undefined) Forecast, by Application 2020 & 2033
- Table 34: North Africa Ride Height Sensor Revenue (undefined) Forecast, by Application 2020 & 2033
- Table 35: South Africa Ride Height Sensor Revenue (undefined) Forecast, by Application 2020 & 2033
- Table 36: Rest of Middle East & Africa Ride Height Sensor Revenue (undefined) Forecast, by Application 2020 & 2033
- Table 37: Global Ride Height Sensor Revenue undefined Forecast, by Application 2020 & 2033
- Table 38: Global Ride Height Sensor Revenue undefined Forecast, by Types 2020 & 2033
- Table 39: Global Ride Height Sensor Revenue undefined Forecast, by Country 2020 & 2033
- Table 40: China Ride Height Sensor Revenue (undefined) Forecast, by Application 2020 & 2033
- Table 41: India Ride Height Sensor Revenue (undefined) Forecast, by Application 2020 & 2033
- Table 42: Japan Ride Height Sensor Revenue (undefined) Forecast, by Application 2020 & 2033
- Table 43: South Korea Ride Height Sensor Revenue (undefined) Forecast, by Application 2020 & 2033
- Table 44: ASEAN Ride Height Sensor Revenue (undefined) Forecast, by Application 2020 & 2033
- Table 45: Oceania Ride Height Sensor Revenue (undefined) Forecast, by Application 2020 & 2033
- Table 46: Rest of Asia Pacific Ride Height Sensor Revenue (undefined) Forecast, by Application 2020 & 2033
Frequently Asked Questions
1. What is the projected Compound Annual Growth Rate (CAGR) of the Ride Height Sensor?
The projected CAGR is approximately 10.42%.
2. Which companies are prominent players in the Ride Height Sensor?
Key companies in the market include KA Sensors, Arnott, Dorman Products, Cardone, TechSmart, Acuity, Variohm.
3. What are the main segments of the Ride Height Sensor?
The market segments include Application, Types.
4. Can you provide details about the market size?
The market size is estimated to be USD XXX N/A as of 2022.
5. What are some drivers contributing to market growth?
N/A
6. What are the notable trends driving market growth?
N/A
7. Are there any restraints impacting market growth?
N/A
8. Can you provide examples of recent developments in the market?
N/A
9. What pricing options are available for accessing the report?
Pricing options include single-user, multi-user, and enterprise licenses priced at USD 2900.00, USD 4350.00, and USD 5800.00 respectively.
10. Is the market size provided in terms of value or volume?
The market size is provided in terms of value, measured in N/A.
11. Are there any specific market keywords associated with the report?
Yes, the market keyword associated with the report is "Ride Height Sensor," which aids in identifying and referencing the specific market segment covered.
12. How do I determine which pricing option suits my needs best?
The pricing options vary based on user requirements and access needs. Individual users may opt for single-user licenses, while businesses requiring broader access may choose multi-user or enterprise licenses for cost-effective access to the report.
13. Are there any additional resources or data provided in the Ride Height Sensor report?
While the report offers comprehensive insights, it's advisable to review the specific contents or supplementary materials provided to ascertain if additional resources or data are available.
14. How can I stay updated on further developments or reports in the Ride Height Sensor?
To stay informed about further developments, trends, and reports in the Ride Height Sensor, consider subscribing to industry newsletters, following relevant companies and organizations, or regularly checking reputable industry news sources and publications.
Methodology
Step 1 - Identification of Relevant Samples Size from Population Database


Step 2 - Approaches for Defining Global Market Size (Value, Volume* & Price*)

Note*: In applicable scenarios
Step 3 - Data Sources
Primary Research
- Web Analytics
- Survey Reports
- Research Institute
- Latest Research Reports
- Opinion Leaders
Secondary Research
- Annual Reports
- White Paper
- Latest Press Release
- Industry Association
- Paid Database
- Investor Presentations

Step 4 - Data Triangulation
Involves using different sources of information in order to increase the validity of a study
These sources are likely to be stakeholders in a program - participants, other researchers, program staff, other community members, and so on.
Then we put all data in single framework & apply various statistical tools to find out the dynamic on the market.
During the analysis stage, feedback from the stakeholder groups would be compared to determine areas of agreement as well as areas of divergence