

Key Insights
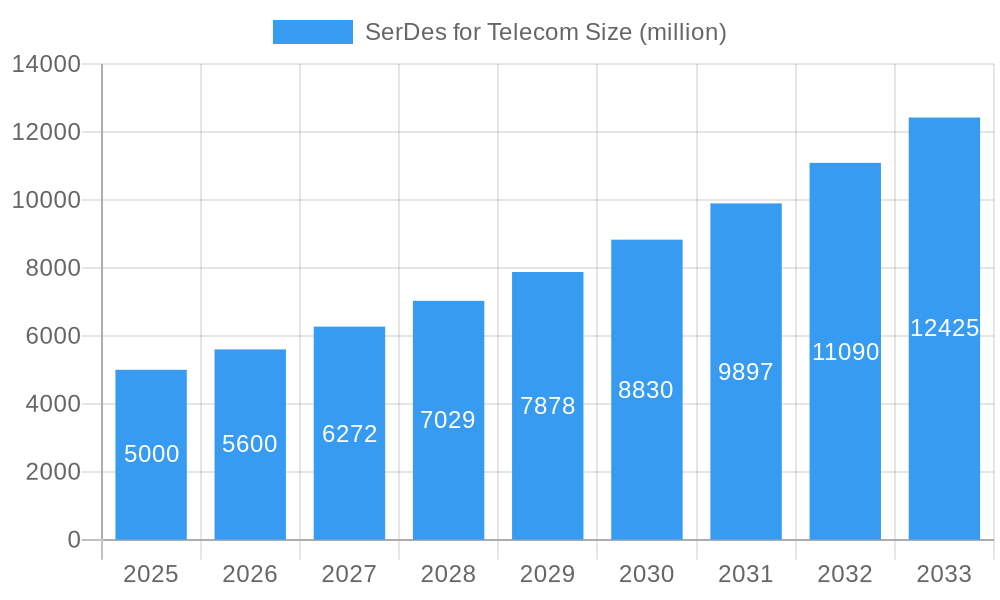
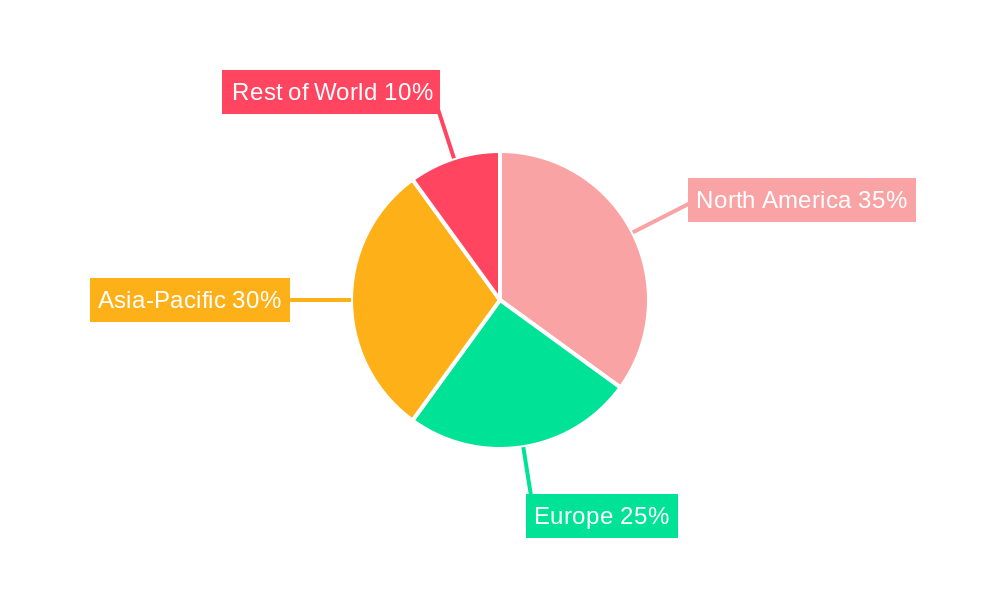
The SerDes (Serializer/Deserializer) market for telecom applications is experiencing robust growth, driven by the escalating demand for high-bandwidth, low-latency communication in 5G networks, data centers, and high-speed internet infrastructure. The market, estimated at $5 billion in 2025, is projected to exhibit a Compound Annual Growth Rate (CAGR) of 12% from 2025 to 2033, reaching approximately $15 billion by 2033. Key drivers include the proliferation of cloud computing, the Internet of Things (IoT), and the increasing adoption of fiber optic networks. Advancements in SerDes technology, such as higher data rates and improved power efficiency, further fuel market expansion. Leading players like Texas Instruments, Maxim Integrated, and ON Semiconductor are strategically investing in research and development to maintain their competitive edge, focusing on innovations in silicon photonics and advanced packaging techniques. The market is segmented based on data rate, application (e.g., 5G fronthaul/backhaul, data center interconnect), and geographic region. North America and Asia-Pacific are expected to dominate the market share due to significant investments in 5G infrastructure and the presence of major telecom operators.
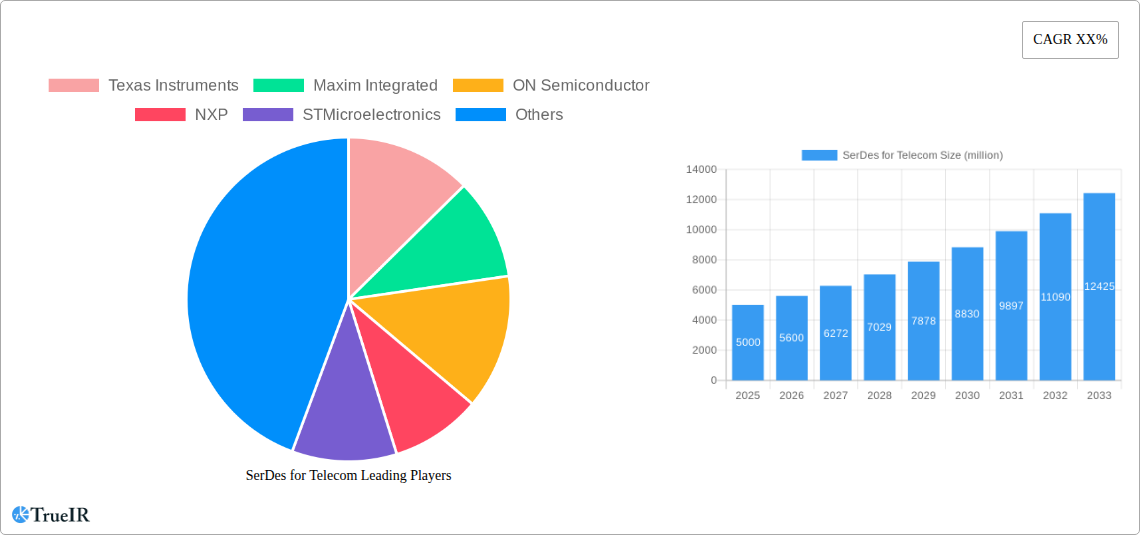
SerDes for Telecom Market Size (In Billion)
Despite significant growth opportunities, the market faces certain restraints, including the high cost of advanced SerDes chips and the complexity of integrating these chips into existing telecom infrastructure. Competition is fierce, particularly among established players, and maintaining profitability in the face of increasing pressure on pricing and margins requires continued innovation and efficiency gains. Nevertheless, the long-term outlook for the SerDes market in telecom remains positive, propelled by the continuous expansion of high-bandwidth communication requirements in various sectors. The development of next-generation communication standards, including 6G, will further enhance growth prospects for this dynamic market segment.
SerDes for Telecom Company Market Share
Dynamic SerDes for Telecom Market Report: 2019-2033
This comprehensive report provides an in-depth analysis of the SerDes for Telecom market, projecting a multi-million dollar valuation by 2033. Leveraging data from 2019-2024 (historical period), with 2025 as the base and estimated year, this study forecasts market trends until 2033. Key players such as Texas Instruments, Maxim Integrated, ON Semiconductor, and others are meticulously examined, revealing growth opportunities and potential challenges.
SerDes for Telecom Market Structure & Competitive Landscape
The SerDes for Telecom market exhibits a moderately concentrated structure, with the top five players holding an estimated xx% market share in 2025. This concentration is influenced by significant R&D investments and economies of scale enjoyed by established players like Texas Instruments and Broadcom. However, the market shows signs of increasing fragmentation due to the entry of smaller, specialized players focusing on niche applications.
Innovation drivers include the continuous demand for higher bandwidth and lower latency in 5G and beyond 5G networks. Stringent regulatory requirements for data security and interoperability also shape the market landscape. Product substitutes, such as alternative modulation schemes, pose a potential threat, but their limitations in terms of cost and performance currently limit their adoption.
End-user segmentation is primarily driven by telecom operators, equipment manufacturers, and data centers. The report reveals a steady rise in M&A activity in recent years, with xx major acquisitions recorded between 2019 and 2024, indicating increased consolidation within the sector. This consolidation is expected to further intensify, particularly among players seeking to expand their product portfolios and geographic reach. The overall competitive intensity is high, fueled by technological advancements and the drive for market share dominance.
SerDes for Telecom Market Trends & Opportunities
The global SerDes for Telecom market is experiencing robust growth, with a projected Compound Annual Growth Rate (CAGR) of xx% from 2025 to 2033, reaching a valuation of $xx million by 2033. This expansion is fueled by the escalating demand for high-speed data transmission across diverse applications, including 5G cellular infrastructure, fiber optic networks, and data centers.
Technological advancements like the adoption of advanced modulation techniques (e.g., PAM-4, 16QAM), coupled with the increasing integration of SerDes into System-on-Chip (SoC) solutions, are key growth catalysts. Consumer preferences for high-bandwidth applications such as streaming video and cloud-based services are further driving the market's expansion. Competitive dynamics are characterized by intense R&D efforts to improve data rates, power efficiency, and cost-effectiveness. Market penetration rates for advanced SerDes technologies are expected to increase significantly over the forecast period, driven by the widespread adoption of 5G and the deployment of next-generation networks.
Dominant Markets & Segments in SerDes for Telecom
The North American region currently dominates the SerDes for Telecom market, driven by substantial investments in 5G infrastructure and a robust data center ecosystem.
- Key Growth Drivers in North America:
- Extensive 5G network deployments.
- High adoption of cloud-based services and data centers.
- Favorable government policies supporting technological advancement.
However, the Asia-Pacific region exhibits the fastest growth potential, fueled by rapid urbanization, increasing smartphone penetration, and substantial government initiatives promoting digital infrastructure development.
- Key Growth Drivers in Asia-Pacific:
- Rapid expansion of 5G networks across major economies.
- Surge in demand for high-speed internet access.
- Growing investments in data center infrastructure.
Europe follows closely with strong adoption of 5G, and governmental support for digital infrastructure. Other regions also demonstrate steady growth, driven by the increasing demand for higher bandwidth across various applications.
SerDes for Telecom Product Analysis
Recent product innovations focus on increasing data rates, reducing power consumption, and improving signal integrity. Key advancements include the integration of advanced equalization techniques and error correction codes. These innovations enable the support of higher-order modulation schemes, leading to greater spectral efficiency. Products targeting specific applications, such as high-speed backhaul links and fronthaul infrastructure, are also gaining traction. The competitive advantage lies in delivering superior performance, lower power consumption, and cost-effectiveness while meeting stringent industry standards.
Key Drivers, Barriers & Challenges in SerDes for Telecom
Key Drivers: The escalating demand for higher bandwidth and lower latency in 5G and beyond 5G networks, coupled with the increasing adoption of cloud computing and the Internet of Things (IoT), are significant drivers. Government initiatives promoting digital infrastructure development further accelerate market growth.
Challenges & Restraints: Supply chain disruptions, particularly regarding specialized components, pose a significant challenge. Stringent regulatory requirements and compliance costs can impact profitability. Intense competition among established players and emerging companies also presents a hurdle to market entry and expansion. The estimated impact of these challenges on market growth is a reduction of xx% in the overall CAGR by 2033.
Growth Drivers in the SerDes for Telecom Market
The proliferation of 5G networks and the increasing adoption of cloud computing are key drivers, alongside the rising demand for high-bandwidth applications like video streaming and online gaming. Government initiatives to expand digital infrastructure and investments in data center technologies further fuel market expansion. The push towards improved energy efficiency in data transmission also contributes to growth.
Challenges Impacting SerDes for Telecom Growth
Supply chain disruptions caused by geopolitical factors and the concentration of manufacturing in specific regions present significant risks. The complexity of integrating SerDes into increasingly complex systems adds to development costs and time-to-market challenges. Intense competition among established players and the emergence of new entrants further exert pressure on pricing and margins.
Key Players Shaping the SerDes for Telecom Market
- Texas Instruments
- Maxim Integrated
- ON Semiconductor
- NXP
- STMicroelectronics
- Broadcom
- ROHM Semiconductor
- Cypress (Infineon)
- Intesil (Renesas)
- Semtech
- Faraday Technology
- Inova Semiconductors
Significant SerDes for Telecom Industry Milestones
- 2020: Introduction of xx-Gbps SerDes solutions by multiple vendors.
- 2021: Significant investments in R&D to support next-generation 6G standards.
- 2022: Several key mergers and acquisitions shaping the competitive landscape.
- 2023: Launch of power-efficient SerDes ICs for 5G applications.
- 2024: Adoption of new standards related to increased data rates and signal integrity.
Future Outlook for SerDes for Telecom Market
The SerDes for Telecom market is poised for continued growth, driven by the ongoing expansion of 5G networks, the rising demand for high-bandwidth applications, and the increasing adoption of cloud-based services. Strategic opportunities exist for companies focused on developing energy-efficient, high-performance solutions and those capable of navigating the complexities of the evolving supply chain. The market's potential remains significant, with substantial growth anticipated throughout the forecast period.
SerDes for Telecom Segmentation
-
1. Application
- 1.1. LAN Communication
- 1.2. WAN Communication
-
2. Types
- 2.1. Stand-Alone SerDes
- 2.2. IP Core SerDes
SerDes for Telecom Segmentation By Geography
-
1. North America
- 1.1. United States
- 1.2. Canada
- 1.3. Mexico
-
2. South America
- 2.1. Brazil
- 2.2. Argentina
- 2.3. Rest of South America
-
3. Europe
- 3.1. United Kingdom
- 3.2. Germany
- 3.3. France
- 3.4. Italy
- 3.5. Spain
- 3.6. Russia
- 3.7. Benelux
- 3.8. Nordics
- 3.9. Rest of Europe
-
4. Middle East & Africa
- 4.1. Turkey
- 4.2. Israel
- 4.3. GCC
- 4.4. North Africa
- 4.5. South Africa
- 4.6. Rest of Middle East & Africa
-
5. Asia Pacific
- 5.1. China
- 5.2. India
- 5.3. Japan
- 5.4. South Korea
- 5.5. ASEAN
- 5.6. Oceania
- 5.7. Rest of Asia Pacific
SerDes for Telecom Regional Market Share
Geographic Coverage of SerDes for Telecom
SerDes for Telecom REPORT HIGHLIGHTS
| Aspects | Details |
|---|---|
| Study Period | 2020-2034 |
| Base Year | 2025 |
| Estimated Year | 2026 |
| Forecast Period | 2026-2034 |
| Historical Period | 2020-2025 |
| Growth Rate | CAGR of XX% from 2020-2034 |
| Segmentation |
|
Table of Contents
- 1. Introduction
- 1.1. Research Scope
- 1.2. Market Segmentation
- 1.3. Research Objective
- 1.4. Definitions and Assumptions
- 2. Executive Summary
- 2.1. Market Snapshot
- 3. Market Dynamics
- 3.1. Market Drivers
- 3.2. Market Restrains
- 3.3. Market Trends
- 3.4. Market Opportunities
- 4. Market Factor Analysis
- 4.1. Porters Five Forces
- 4.1.1. Bargaining Power of Suppliers
- 4.1.2. Bargaining Power of Buyers
- 4.1.3. Threat of New Entrants
- 4.1.4. Threat of Substitutes
- 4.1.5. Competitive Rivalry
- 4.2. PESTEL analysis
- 4.3. BCG Analysis
- 4.3.1. Stars (High Growth, High Market Share)
- 4.3.2. Cash Cows (Low Growth, High Market Share)
- 4.3.3. Question Mark (High Growth, Low Market Share)
- 4.3.4. Dogs (Low Growth, Low Market Share)
- 4.4. Ansoff Matrix Analysis
- 4.5. Supply Chain Analysis
- 4.6. Regulatory Landscape
- 4.7. Current Market Potential and Opportunity Assessment (TAM–SAM–SOM Framework)
- 4.8. TIR Analyst Note
- 4.1. Porters Five Forces
- 5. Market Analysis, Insights and Forecast 2021-2033
- 5.1. Market Analysis, Insights and Forecast - by Application
- 5.1.1. LAN Communication
- 5.1.2. WAN Communication
- 5.2. Market Analysis, Insights and Forecast - by Types
- 5.2.1. Stand-Alone SerDes
- 5.2.2. IP Core SerDes
- 5.3. Market Analysis, Insights and Forecast - by Region
- 5.3.1. North America
- 5.3.2. South America
- 5.3.3. Europe
- 5.3.4. Middle East & Africa
- 5.3.5. Asia Pacific
- 5.1. Market Analysis, Insights and Forecast - by Application
- 6. Global SerDes for Telecom Analysis, Insights and Forecast, 2021-2033
- 6.1. Market Analysis, Insights and Forecast - by Application
- 6.1.1. LAN Communication
- 6.1.2. WAN Communication
- 6.2. Market Analysis, Insights and Forecast - by Types
- 6.2.1. Stand-Alone SerDes
- 6.2.2. IP Core SerDes
- 6.1. Market Analysis, Insights and Forecast - by Application
- 7. North America SerDes for Telecom Analysis, Insights and Forecast, 2020-2032
- 7.1. Market Analysis, Insights and Forecast - by Application
- 7.1.1. LAN Communication
- 7.1.2. WAN Communication
- 7.2. Market Analysis, Insights and Forecast - by Types
- 7.2.1. Stand-Alone SerDes
- 7.2.2. IP Core SerDes
- 7.1. Market Analysis, Insights and Forecast - by Application
- 8. South America SerDes for Telecom Analysis, Insights and Forecast, 2020-2032
- 8.1. Market Analysis, Insights and Forecast - by Application
- 8.1.1. LAN Communication
- 8.1.2. WAN Communication
- 8.2. Market Analysis, Insights and Forecast - by Types
- 8.2.1. Stand-Alone SerDes
- 8.2.2. IP Core SerDes
- 8.1. Market Analysis, Insights and Forecast - by Application
- 9. Europe SerDes for Telecom Analysis, Insights and Forecast, 2020-2032
- 9.1. Market Analysis, Insights and Forecast - by Application
- 9.1.1. LAN Communication
- 9.1.2. WAN Communication
- 9.2. Market Analysis, Insights and Forecast - by Types
- 9.2.1. Stand-Alone SerDes
- 9.2.2. IP Core SerDes
- 9.1. Market Analysis, Insights and Forecast - by Application
- 10. Middle East & Africa SerDes for Telecom Analysis, Insights and Forecast, 2020-2032
- 10.1. Market Analysis, Insights and Forecast - by Application
- 10.1.1. LAN Communication
- 10.1.2. WAN Communication
- 10.2. Market Analysis, Insights and Forecast - by Types
- 10.2.1. Stand-Alone SerDes
- 10.2.2. IP Core SerDes
- 10.1. Market Analysis, Insights and Forecast - by Application
- 11. Asia Pacific SerDes for Telecom Analysis, Insights and Forecast, 2020-2032
- 11.1. Market Analysis, Insights and Forecast - by Application
- 11.1.1. LAN Communication
- 11.1.2. WAN Communication
- 11.2. Market Analysis, Insights and Forecast - by Types
- 11.2.1. Stand-Alone SerDes
- 11.2.2. IP Core SerDes
- 11.1. Market Analysis, Insights and Forecast - by Application
- 12. Competitive Analysis
- 12.1. Company Profiles
- 12.1.1 Texas Instruments
- 12.1.1.1. Company Overview
- 12.1.1.2. Products
- 12.1.1.3. Company Financials
- 12.1.1.4. SWOT Analysis
- 12.1.2 Maxim Integrated
- 12.1.2.1. Company Overview
- 12.1.2.2. Products
- 12.1.2.3. Company Financials
- 12.1.2.4. SWOT Analysis
- 12.1.3 ON Semiconductor
- 12.1.3.1. Company Overview
- 12.1.3.2. Products
- 12.1.3.3. Company Financials
- 12.1.3.4. SWOT Analysis
- 12.1.4 NXP
- 12.1.4.1. Company Overview
- 12.1.4.2. Products
- 12.1.4.3. Company Financials
- 12.1.4.4. SWOT Analysis
- 12.1.5 STMicroelectronics
- 12.1.5.1. Company Overview
- 12.1.5.2. Products
- 12.1.5.3. Company Financials
- 12.1.5.4. SWOT Analysis
- 12.1.6 Broadcom
- 12.1.6.1. Company Overview
- 12.1.6.2. Products
- 12.1.6.3. Company Financials
- 12.1.6.4. SWOT Analysis
- 12.1.7 ROHM Semiconductor
- 12.1.7.1. Company Overview
- 12.1.7.2. Products
- 12.1.7.3. Company Financials
- 12.1.7.4. SWOT Analysis
- 12.1.8 Cypress (Infineon)
- 12.1.8.1. Company Overview
- 12.1.8.2. Products
- 12.1.8.3. Company Financials
- 12.1.8.4. SWOT Analysis
- 12.1.9 Intesil (Renesas)
- 12.1.9.1. Company Overview
- 12.1.9.2. Products
- 12.1.9.3. Company Financials
- 12.1.9.4. SWOT Analysis
- 12.1.10 Semtech
- 12.1.10.1. Company Overview
- 12.1.10.2. Products
- 12.1.10.3. Company Financials
- 12.1.10.4. SWOT Analysis
- 12.1.11 Faraday Technology
- 12.1.11.1. Company Overview
- 12.1.11.2. Products
- 12.1.11.3. Company Financials
- 12.1.11.4. SWOT Analysis
- 12.1.12 Inova Semiconductors
- 12.1.12.1. Company Overview
- 12.1.12.2. Products
- 12.1.12.3. Company Financials
- 12.1.12.4. SWOT Analysis
- 12.1.1 Texas Instruments
- 12.2. Market Entropy
- 12.2.1 Company's Key Areas Served
- 12.2.2 Recent Developments
- 12.3. Company Market Share Analysis 2025
- 12.3.1 Top 5 Companies Market Share Analysis
- 12.3.2 Top 3 Companies Market Share Analysis
- 12.4. List of Potential Customers
- 13. Research Methodology
List of Figures
- Figure 1: Global SerDes for Telecom Revenue Breakdown (million, %) by Region 2025 & 2033
- Figure 2: North America SerDes for Telecom Revenue (million), by Application 2025 & 2033
- Figure 3: North America SerDes for Telecom Revenue Share (%), by Application 2025 & 2033
- Figure 4: North America SerDes for Telecom Revenue (million), by Types 2025 & 2033
- Figure 5: North America SerDes for Telecom Revenue Share (%), by Types 2025 & 2033
- Figure 6: North America SerDes for Telecom Revenue (million), by Country 2025 & 2033
- Figure 7: North America SerDes for Telecom Revenue Share (%), by Country 2025 & 2033
- Figure 8: South America SerDes for Telecom Revenue (million), by Application 2025 & 2033
- Figure 9: South America SerDes for Telecom Revenue Share (%), by Application 2025 & 2033
- Figure 10: South America SerDes for Telecom Revenue (million), by Types 2025 & 2033
- Figure 11: South America SerDes for Telecom Revenue Share (%), by Types 2025 & 2033
- Figure 12: South America SerDes for Telecom Revenue (million), by Country 2025 & 2033
- Figure 13: South America SerDes for Telecom Revenue Share (%), by Country 2025 & 2033
- Figure 14: Europe SerDes for Telecom Revenue (million), by Application 2025 & 2033
- Figure 15: Europe SerDes for Telecom Revenue Share (%), by Application 2025 & 2033
- Figure 16: Europe SerDes for Telecom Revenue (million), by Types 2025 & 2033
- Figure 17: Europe SerDes for Telecom Revenue Share (%), by Types 2025 & 2033
- Figure 18: Europe SerDes for Telecom Revenue (million), by Country 2025 & 2033
- Figure 19: Europe SerDes for Telecom Revenue Share (%), by Country 2025 & 2033
- Figure 20: Middle East & Africa SerDes for Telecom Revenue (million), by Application 2025 & 2033
- Figure 21: Middle East & Africa SerDes for Telecom Revenue Share (%), by Application 2025 & 2033
- Figure 22: Middle East & Africa SerDes for Telecom Revenue (million), by Types 2025 & 2033
- Figure 23: Middle East & Africa SerDes for Telecom Revenue Share (%), by Types 2025 & 2033
- Figure 24: Middle East & Africa SerDes for Telecom Revenue (million), by Country 2025 & 2033
- Figure 25: Middle East & Africa SerDes for Telecom Revenue Share (%), by Country 2025 & 2033
- Figure 26: Asia Pacific SerDes for Telecom Revenue (million), by Application 2025 & 2033
- Figure 27: Asia Pacific SerDes for Telecom Revenue Share (%), by Application 2025 & 2033
- Figure 28: Asia Pacific SerDes for Telecom Revenue (million), by Types 2025 & 2033
- Figure 29: Asia Pacific SerDes for Telecom Revenue Share (%), by Types 2025 & 2033
- Figure 30: Asia Pacific SerDes for Telecom Revenue (million), by Country 2025 & 2033
- Figure 31: Asia Pacific SerDes for Telecom Revenue Share (%), by Country 2025 & 2033
List of Tables
- Table 1: Global SerDes for Telecom Revenue million Forecast, by Application 2020 & 2033
- Table 2: Global SerDes for Telecom Revenue million Forecast, by Types 2020 & 2033
- Table 3: Global SerDes for Telecom Revenue million Forecast, by Region 2020 & 2033
- Table 4: Global SerDes for Telecom Revenue million Forecast, by Application 2020 & 2033
- Table 5: Global SerDes for Telecom Revenue million Forecast, by Types 2020 & 2033
- Table 6: Global SerDes for Telecom Revenue million Forecast, by Country 2020 & 2033
- Table 7: United States SerDes for Telecom Revenue (million) Forecast, by Application 2020 & 2033
- Table 8: Canada SerDes for Telecom Revenue (million) Forecast, by Application 2020 & 2033
- Table 9: Mexico SerDes for Telecom Revenue (million) Forecast, by Application 2020 & 2033
- Table 10: Global SerDes for Telecom Revenue million Forecast, by Application 2020 & 2033
- Table 11: Global SerDes for Telecom Revenue million Forecast, by Types 2020 & 2033
- Table 12: Global SerDes for Telecom Revenue million Forecast, by Country 2020 & 2033
- Table 13: Brazil SerDes for Telecom Revenue (million) Forecast, by Application 2020 & 2033
- Table 14: Argentina SerDes for Telecom Revenue (million) Forecast, by Application 2020 & 2033
- Table 15: Rest of South America SerDes for Telecom Revenue (million) Forecast, by Application 2020 & 2033
- Table 16: Global SerDes for Telecom Revenue million Forecast, by Application 2020 & 2033
- Table 17: Global SerDes for Telecom Revenue million Forecast, by Types 2020 & 2033
- Table 18: Global SerDes for Telecom Revenue million Forecast, by Country 2020 & 2033
- Table 19: United Kingdom SerDes for Telecom Revenue (million) Forecast, by Application 2020 & 2033
- Table 20: Germany SerDes for Telecom Revenue (million) Forecast, by Application 2020 & 2033
- Table 21: France SerDes for Telecom Revenue (million) Forecast, by Application 2020 & 2033
- Table 22: Italy SerDes for Telecom Revenue (million) Forecast, by Application 2020 & 2033
- Table 23: Spain SerDes for Telecom Revenue (million) Forecast, by Application 2020 & 2033
- Table 24: Russia SerDes for Telecom Revenue (million) Forecast, by Application 2020 & 2033
- Table 25: Benelux SerDes for Telecom Revenue (million) Forecast, by Application 2020 & 2033
- Table 26: Nordics SerDes for Telecom Revenue (million) Forecast, by Application 2020 & 2033
- Table 27: Rest of Europe SerDes for Telecom Revenue (million) Forecast, by Application 2020 & 2033
- Table 28: Global SerDes for Telecom Revenue million Forecast, by Application 2020 & 2033
- Table 29: Global SerDes for Telecom Revenue million Forecast, by Types 2020 & 2033
- Table 30: Global SerDes for Telecom Revenue million Forecast, by Country 2020 & 2033
- Table 31: Turkey SerDes for Telecom Revenue (million) Forecast, by Application 2020 & 2033
- Table 32: Israel SerDes for Telecom Revenue (million) Forecast, by Application 2020 & 2033
- Table 33: GCC SerDes for Telecom Revenue (million) Forecast, by Application 2020 & 2033
- Table 34: North Africa SerDes for Telecom Revenue (million) Forecast, by Application 2020 & 2033
- Table 35: South Africa SerDes for Telecom Revenue (million) Forecast, by Application 2020 & 2033
- Table 36: Rest of Middle East & Africa SerDes for Telecom Revenue (million) Forecast, by Application 2020 & 2033
- Table 37: Global SerDes for Telecom Revenue million Forecast, by Application 2020 & 2033
- Table 38: Global SerDes for Telecom Revenue million Forecast, by Types 2020 & 2033
- Table 39: Global SerDes for Telecom Revenue million Forecast, by Country 2020 & 2033
- Table 40: China SerDes for Telecom Revenue (million) Forecast, by Application 2020 & 2033
- Table 41: India SerDes for Telecom Revenue (million) Forecast, by Application 2020 & 2033
- Table 42: Japan SerDes for Telecom Revenue (million) Forecast, by Application 2020 & 2033
- Table 43: South Korea SerDes for Telecom Revenue (million) Forecast, by Application 2020 & 2033
- Table 44: ASEAN SerDes for Telecom Revenue (million) Forecast, by Application 2020 & 2033
- Table 45: Oceania SerDes for Telecom Revenue (million) Forecast, by Application 2020 & 2033
- Table 46: Rest of Asia Pacific SerDes for Telecom Revenue (million) Forecast, by Application 2020 & 2033
Frequently Asked Questions
1. What is the projected Compound Annual Growth Rate (CAGR) of the SerDes for Telecom?
The projected CAGR is approximately XX%.
2. Which companies are prominent players in the SerDes for Telecom?
Key companies in the market include Texas Instruments, Maxim Integrated, ON Semiconductor, NXP, STMicroelectronics, Broadcom, ROHM Semiconductor, Cypress (Infineon), Intesil (Renesas), Semtech, Faraday Technology, Inova Semiconductors.
3. What are the main segments of the SerDes for Telecom?
The market segments include Application, Types.
4. Can you provide details about the market size?
The market size is estimated to be USD XXX million as of 2022.
5. What are some drivers contributing to market growth?
N/A
6. What are the notable trends driving market growth?
N/A
7. Are there any restraints impacting market growth?
N/A
8. Can you provide examples of recent developments in the market?
N/A
9. What pricing options are available for accessing the report?
Pricing options include single-user, multi-user, and enterprise licenses priced at USD 4900.00, USD 7350.00, and USD 9800.00 respectively.
10. Is the market size provided in terms of value or volume?
The market size is provided in terms of value, measured in million.
11. Are there any specific market keywords associated with the report?
Yes, the market keyword associated with the report is "SerDes for Telecom," which aids in identifying and referencing the specific market segment covered.
12. How do I determine which pricing option suits my needs best?
The pricing options vary based on user requirements and access needs. Individual users may opt for single-user licenses, while businesses requiring broader access may choose multi-user or enterprise licenses for cost-effective access to the report.
13. Are there any additional resources or data provided in the SerDes for Telecom report?
While the report offers comprehensive insights, it's advisable to review the specific contents or supplementary materials provided to ascertain if additional resources or data are available.
14. How can I stay updated on further developments or reports in the SerDes for Telecom?
To stay informed about further developments, trends, and reports in the SerDes for Telecom, consider subscribing to industry newsletters, following relevant companies and organizations, or regularly checking reputable industry news sources and publications.
Methodology
Step 1 - Identification of Relevant Samples Size from Population Database


Step 2 - Approaches for Defining Global Market Size (Value, Volume* & Price*)

Note*: In applicable scenarios
Step 3 - Data Sources
Primary Research
- Web Analytics
- Survey Reports
- Research Institute
- Latest Research Reports
- Opinion Leaders
Secondary Research
- Annual Reports
- White Paper
- Latest Press Release
- Industry Association
- Paid Database
- Investor Presentations

Step 4 - Data Triangulation
Involves using different sources of information in order to increase the validity of a study
These sources are likely to be stakeholders in a program - participants, other researchers, program staff, other community members, and so on.
Then we put all data in single framework & apply various statistical tools to find out the dynamic on the market.
During the analysis stage, feedback from the stakeholder groups would be compared to determine areas of agreement as well as areas of divergence