

Key Insights
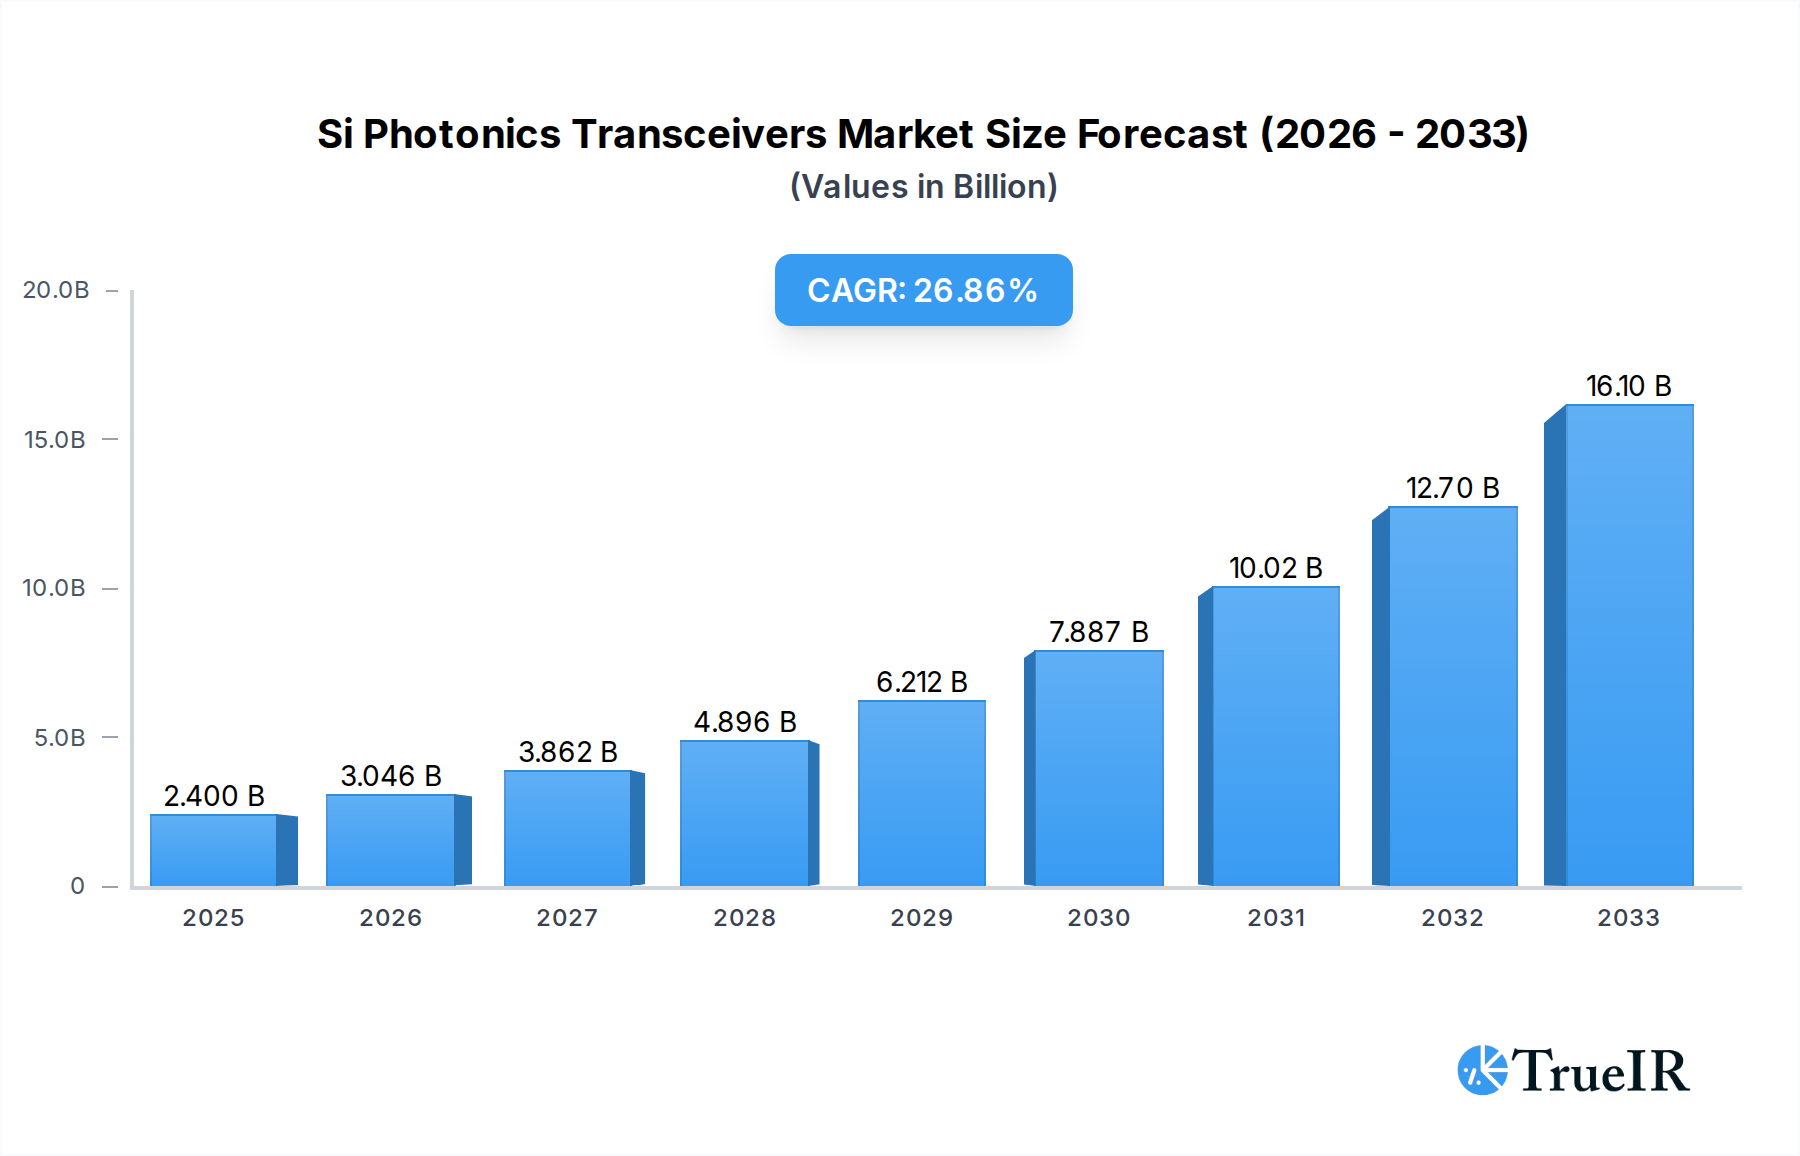
The silicon photonics transceivers market is poised for significant expansion, driven by the escalating demand for high-speed data transmission across various sectors. The market is projected to reach USD 2951.6 million by 2025, demonstrating robust growth fueled by advancements in silicon photonics technology and its increasing integration into high-performance computing and data center infrastructure. The CAGR of 23% signifies a strong upward trajectory, indicating substantial investment and innovation within the industry. Key drivers include the burgeoning need for faster internet speeds, the proliferation of cloud computing, and the exponential growth of data traffic generated by emerging technologies like 5G, AI, and IoT. These factors necessitate the development and deployment of more efficient and cost-effective optical transceivers, a role silicon photonics is increasingly filling due to its scalability and integration capabilities.

Si Photonics Transceivers Market Size (In Billion)
The market's growth is further supported by the diversification of applications, extending beyond traditional data center and long-haul communications to include promising areas like automotive LiDAR, immunoassay tests, and optical interconnects for advanced computing systems. While the market benefits from these strong growth drivers, it also faces certain challenges. The high initial cost of R&D and manufacturing for silicon photonics can be a restraint, alongside the need for specialized expertise and established supply chains. However, ongoing technological refinements and increasing economies of scale are expected to mitigate these challenges. Major players like Cisco Systems, Intel, and InPhi are actively investing in R&D and strategic partnerships to expand their product portfolios and capture market share, underscoring the competitive landscape and the immense potential of this dynamic market. The forecast period, from 2025 to 2033, is anticipated to witness continuous innovation and market penetration, solidifying silicon photonics transceivers as a cornerstone of future communication infrastructure.
Si Photonics Transceivers Company Market Share
Si Photonics Transceivers Market Structure & Competitive Landscape
The Si Photonics Transceivers market exhibits a moderate to high concentration, with a few key players like Cisco Systems, Intel, and II-VI Incorporated (formerly Finisar) holding significant market share. Innovation remains a primary driver, fueled by the relentless demand for higher bandwidth and lower power consumption in datacenters and telecommunications. Regulatory impacts are minimal, primarily focusing on industry standards and interoperability. Product substitutes, such as traditional indium phosphide (InP) transceivers, are gradually being displaced by silicon photonics due to cost-effectiveness and scalability. End-user segmentation spans critical applications including Datacenter Transceivers, Long Haul Transceivers, and Optical Interconnects, with emerging applications in Automotive LiDAR and Immunoassay Tests gaining traction. Mergers and acquisitions (M&A) activity, estimated at over 100 million USD in deal value during the historical period, has played a crucial role in consolidating market positions and acquiring advanced technological capabilities. For instance, the acquisition of II-VI by Finisar significantly strengthened their silicon photonics portfolio. Key players are investing heavily in R&D to address the growing demand for 200G/400G Silicon Photonic Transceivers.
Si Photonics Transceivers Market Trends & Opportunities
The Si Photonics Transceivers market is poised for substantial growth, projected to reach over $50 billion by 2033, with a Compound Annual Growth Rate (CAGR) of approximately 25% during the forecast period. This expansion is primarily driven by the insatiable demand for higher bandwidth and lower power consumption in datacenters and the rapid proliferation of 5G networks. Technological advancements in silicon photonics integration are enabling the production of more complex and cost-effective transceivers, making them increasingly attractive for a wider range of applications.
Consumer preferences are shifting towards smaller, more power-efficient optical interconnect solutions, which silicon photonics excels at delivering. The increasing adoption of cloud computing, artificial intelligence (AI), and big data analytics further fuels the need for high-performance networking infrastructure, directly benefiting the silicon photonics transceiver market. Competitive dynamics are intensifying, with established players like Intel and Cisco Systems, alongside emerging innovators such as Rockley Photonics, vying for market dominance. These companies are heavily investing in research and development to enhance transceiver capabilities, including increased data rates and improved thermal management.
The market penetration rate of silicon photonics transceivers is expected to rise significantly, moving from an estimated 40% in the base year of 2025 to over 75% by 2033. This growth is propelled by the inherent advantages of silicon photonics, including wafer-scale manufacturing, integration with CMOS electronics, and reduced packaging costs, all contributing to a lower total cost of ownership compared to traditional indium phosphide (InP) technologies. The ongoing evolution of optical interconnects for high-performance computing (HPC) and artificial intelligence (AI) clusters represents a particularly lucrative opportunity for silicon photonics.
Dominant Markets & Segments in Si Photonics Transceivers
The Datacenter Transceivers segment is currently the dominant force in the Si Photonics Transceivers market, driven by the exponential growth in cloud computing, big data, and AI workloads. The increasing density of servers and the demand for faster data exchange within datacenters necessitate the adoption of high-speed, cost-effective optical interconnects, making silicon photonics the technology of choice. This segment is projected to account for over 60% of the market revenue by 2033.
Within the Types of transceivers, the 200G/400G Silicon Photonic Transceiver category is exhibiting the most rapid growth. The transition from 100G to higher data rates is a critical trend in modern datacenters and telecommunication networks, and silicon photonics is uniquely positioned to deliver these solutions at scale and at a competitive price point. This segment is expected to witness a CAGR exceeding 30% during the forecast period.
Key growth drivers for these dominant segments include:
- Infrastructure Expansion: Continuous investment in hyperscale and enterprise datacenter infrastructure globally.
- Bandwidth Demand: Escalating data traffic driven by video streaming, online gaming, and remote work trends.
- Technological Advancements: Ongoing improvements in silicon photonic integration density and performance.
- Cost Optimization: The inherent scalability and manufacturing advantages of silicon photonics enabling lower per-gigabit costs.
- Energy Efficiency: Growing pressure on datacenters to reduce power consumption, a key benefit of silicon photonics.
The Optical Interconnects segment, which encompasses a broader range of applications beyond direct transceiver modules, is also a significant and growing area. This includes board-to-board and chip-to-chip optical links, where silicon photonics offers compelling advantages in terms of size and bandwidth density.
Emerging segments like Automotive LiDAR and Immunoassay Tests are also presenting significant long-term opportunities. The precision and miniaturization capabilities of silicon photonics are ideal for advanced sensor applications. For instance, silicon photonic integrated circuits can enable smaller, more robust, and cost-effective LiDAR systems for autonomous vehicles. Similarly, in the healthcare sector, silicon photonics can facilitate the development of highly sensitive and multiplexed immunoassay platforms for rapid diagnostics.
The Long Haul Transceivers segment, while mature, continues to see steady growth as network operators upgrade their backbone infrastructure to support increasing inter-city and international data demands. Silicon photonics is gradually making inroads into this segment by offering more power-efficient and compact solutions compared to traditional technologies.
Si Photonics Transceivers Product Analysis
Silicon photonics transceivers are revolutionizing optical communication with their unprecedented integration capabilities, enabling the creation of highly compact, power-efficient, and cost-effective optical modules. Key product innovations focus on increasing data rates beyond 400G, improving thermal management for dense deployments, and enhancing signal integrity for longer reach applications. The competitive advantage lies in leveraging mature silicon manufacturing processes, allowing for wafer-scale production that significantly reduces unit costs compared to traditional III-V semiconductor technologies. These advancements are critical for meeting the escalating bandwidth demands in datacenters, 5G infrastructure, and emerging applications like AI and high-performance computing.
Key Drivers, Barriers & Challenges in Si Photonics Transceivers
The Si Photonics Transceivers market is propelled by several key drivers. Technological advancements in silicon photonics integration, enabling higher speeds and lower power consumption, are paramount. The exploding demand for bandwidth in datacenters, driven by cloud computing and AI, is a significant economic factor. Cost-effectiveness due to wafer-scale manufacturing is another crucial driver. Policy-driven initiatives promoting digital transformation and 5G deployment also contribute positively.
However, the market faces key challenges and restraints. Supply chain issues related to specialized materials and fabrication processes can lead to bottlenecks. Regulatory hurdles, particularly concerning industry standards and interoperability, can slow adoption. Intense competitive pressures from established players and emerging technologies necessitate continuous innovation. Furthermore, the high initial R&D investment required for silicon photonics development can be a barrier for smaller companies. The scalability of specific niche applications like Automotive LiDAR still needs to be proven at high volumes.
Growth Drivers in the Si Photonics Transceivers Market
The growth of the Si Photonics Transceivers market is fundamentally driven by the escalating global demand for data and connectivity. Technological innovation in silicon photonics, allowing for the integration of more optical functions onto a single silicon chip, is a primary catalyst. This leads to smaller, more power-efficient, and significantly more cost-effective transceivers. The exponential growth of cloud computing, big data analytics, and artificial intelligence workloads in datacenters necessitates the constant upgrade of networking infrastructure to higher bandwidths, creating a sustained demand for solutions like 200G/400G silicon photonic transceivers. The ongoing rollout of 5G networks globally also requires a robust optical backbone, further fueling market expansion. Economic factors, such as the pursuit of lower total cost of ownership and energy efficiency in data centers, strongly favor silicon photonics.
Challenges Impacting Si Photonics Transceivers Growth
Despite the strong growth trajectory, several challenges can impact the Si Photonics Transceivers market. Supply chain complexities for specialized wafers and advanced packaging can lead to production delays and increased costs. While improving, regulatory complexities surrounding interoperability standards and data security protocols across different regions can create adoption hurdles. Intense competitive pressures among established semiconductor giants and nimble startups necessitate continuous innovation and aggressive pricing strategies, potentially impacting profit margins. The high initial capital expenditure required for advanced silicon photonics foundries and R&D can act as a barrier to entry for new players. Furthermore, technical limitations in achieving extreme reach or ultra-low latency for highly specialized applications might still favor alternative technologies in specific niche markets.
Key Players Shaping the Si Photonics Transceivers Market
- Cisco Systems
- Intel
- InPhi
- II-VI Incorporated
- Juniper
- Rockley Photonics
- FUJITSU
Significant Si Photonics Transceivers Industry Milestones
- 2019: Introduction of 100G silicon photonic transceivers for datacenter applications by multiple vendors.
- 2020: Significant investments in R&D for 200G/400G silicon photonic transceiver development.
- 2021: Mergers and acquisitions aimed at consolidating silicon photonics technology and market share, with over 100 million USD in deal value.
- 2022: Increased commercialization of silicon photonic solutions for optical interconnects beyond datacenters.
- 2023: Advancements in silicon photonics for integration into emerging applications like Automotive LiDAR prototypes.
- 2024: Growing market penetration of silicon photonic transceivers in enterprise networks.
- 2025 (Base Year): Estimated market size exceeding 10 billion USD.
- 2026-2033 (Forecast Period): Projected robust CAGR driven by datacenter expansion and next-generation network deployments.
Future Outlook for Si Photonics Transceivers Market
The future outlook for the Si Photonics Transceivers market is exceptionally bright, driven by ongoing technological advancements and the relentless demand for higher bandwidth and greater efficiency. The market is projected to witness sustained high growth, fueled by the continued expansion of hyperscale datacenters, the widespread adoption of 5G and upcoming 6G networks, and the proliferation of AI and machine learning applications. Strategic opportunities lie in further miniaturization, power reduction, and the development of integrated optical engines for advanced computing and sensing applications. The ability to leverage standard CMOS manufacturing processes will continue to be a key enabler of cost-effective scaling, making silicon photonics the dominant technology for optical interconnects in the coming decade. The market is expected to surpass 50 billion USD by 2033, indicating significant market potential.
Si Photonics Transceivers Segmentation
-
1. Application
- 1.1. Datacenter Transceivers
- 1.2. Long Haul Transceivers
- 1.3. Optical Interconnects
- 1.4. Automotive LiDAR
- 1.5. Immunoassay Tests
- 1.6. Fiber-optic Gyroscope
- 1.7. Others
-
2. Types
- 2.1. 100G Silicon Photonic Transceiver
- 2.2. 200G/400G Silicon Photonic Transceiver
- 2.3. Others
Si Photonics Transceivers Segmentation By Geography
-
1. North America
- 1.1. United States
- 1.2. Canada
- 1.3. Mexico
-
2. South America
- 2.1. Brazil
- 2.2. Argentina
- 2.3. Rest of South America
-
3. Europe
- 3.1. United Kingdom
- 3.2. Germany
- 3.3. France
- 3.4. Italy
- 3.5. Spain
- 3.6. Russia
- 3.7. Benelux
- 3.8. Nordics
- 3.9. Rest of Europe
-
4. Middle East & Africa
- 4.1. Turkey
- 4.2. Israel
- 4.3. GCC
- 4.4. North Africa
- 4.5. South Africa
- 4.6. Rest of Middle East & Africa
-
5. Asia Pacific
- 5.1. China
- 5.2. India
- 5.3. Japan
- 5.4. South Korea
- 5.5. ASEAN
- 5.6. Oceania
- 5.7. Rest of Asia Pacific
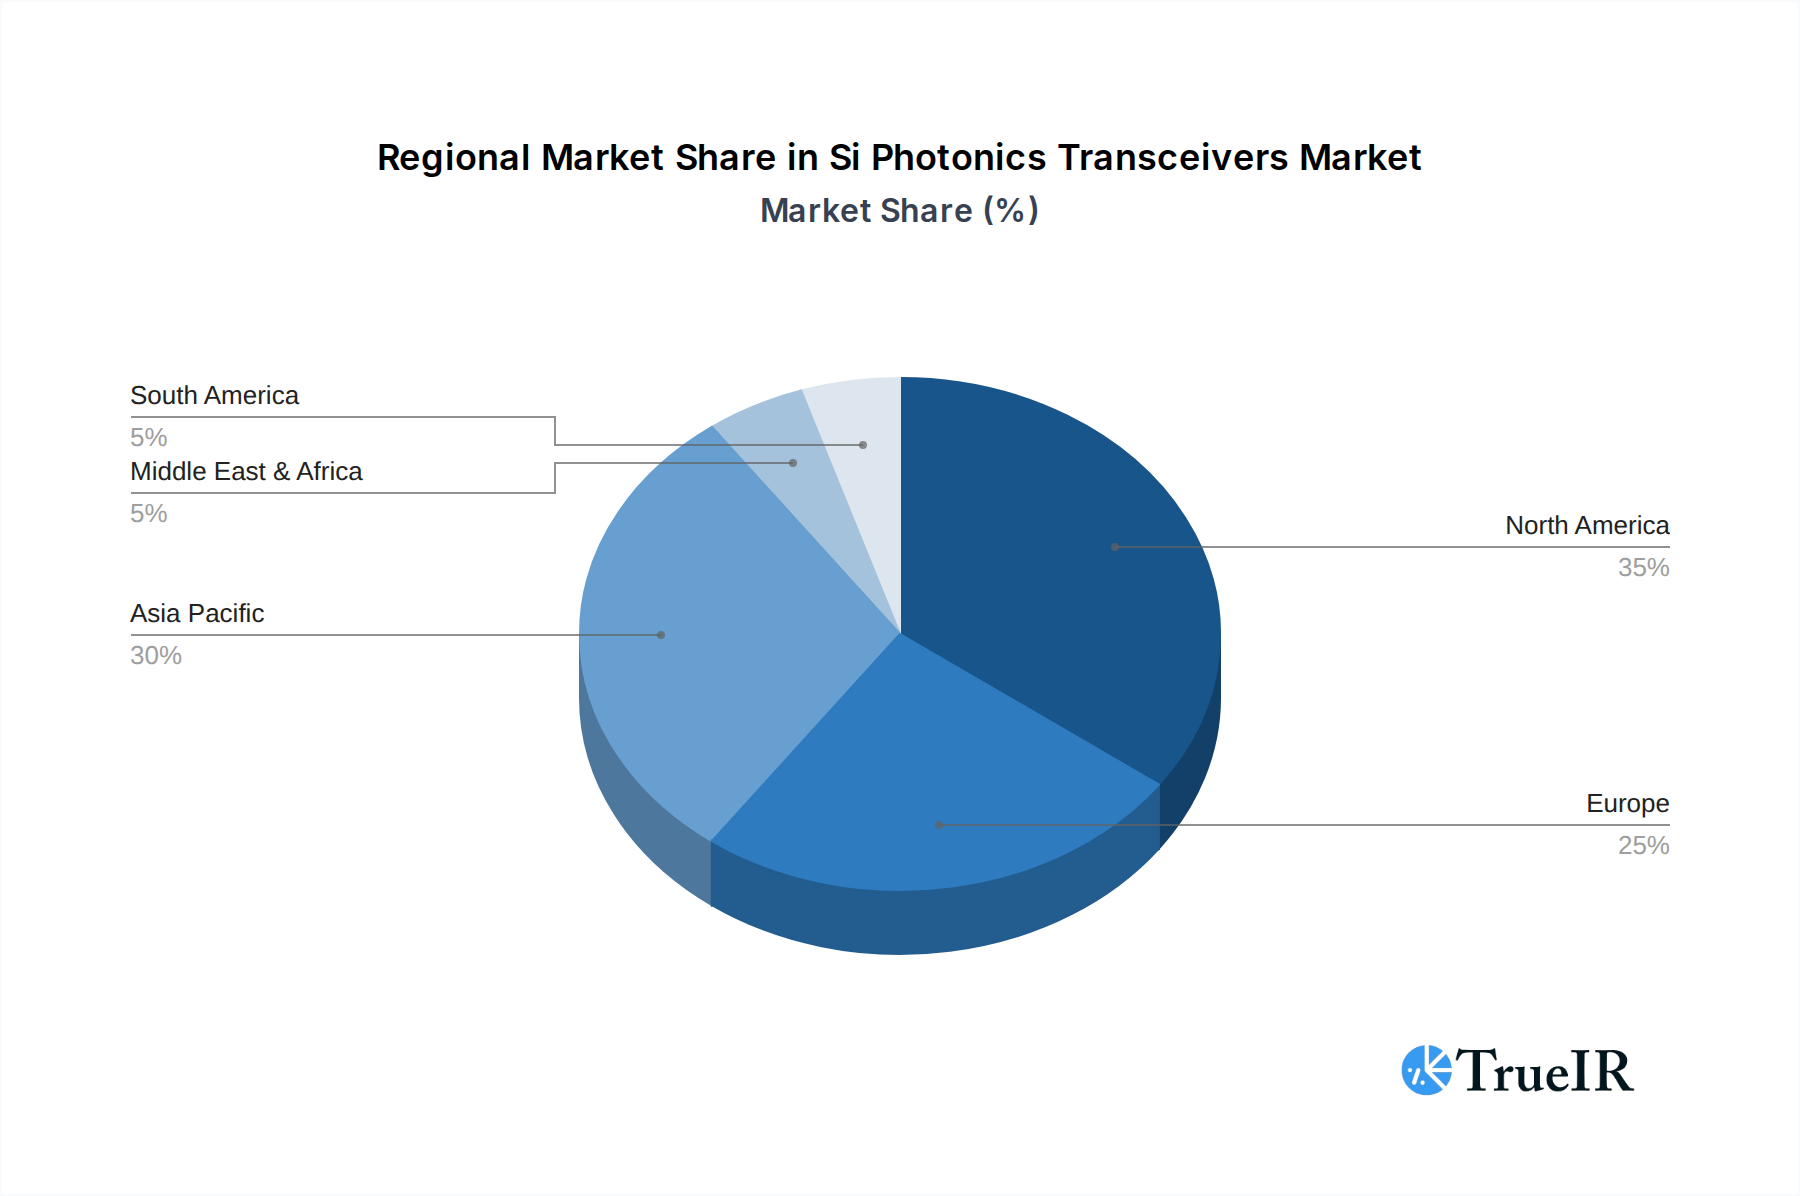
Si Photonics Transceivers Regional Market Share
Geographic Coverage of Si Photonics Transceivers
Si Photonics Transceivers REPORT HIGHLIGHTS
| Aspects | Details |
|---|---|
| Study Period | 2020-2034 |
| Base Year | 2025 |
| Estimated Year | 2026 |
| Forecast Period | 2026-2034 |
| Historical Period | 2020-2025 |
| Growth Rate | CAGR of 29.2% from 2020-2034 |
| Segmentation |
|
Table of Contents
- 1. Introduction
- 1.1. Research Scope
- 1.2. Market Segmentation
- 1.3. Research Objective
- 1.4. Definitions and Assumptions
- 2. Executive Summary
- 2.1. Market Snapshot
- 3. Market Dynamics
- 3.1. Market Drivers
- 3.2. Market Restrains
- 3.3. Market Trends
- 3.4. Market Opportunities
- 4. Market Factor Analysis
- 4.1. Porters Five Forces
- 4.1.1. Bargaining Power of Suppliers
- 4.1.2. Bargaining Power of Buyers
- 4.1.3. Threat of New Entrants
- 4.1.4. Threat of Substitutes
- 4.1.5. Competitive Rivalry
- 4.2. PESTEL analysis
- 4.3. BCG Analysis
- 4.3.1. Stars (High Growth, High Market Share)
- 4.3.2. Cash Cows (Low Growth, High Market Share)
- 4.3.3. Question Mark (High Growth, Low Market Share)
- 4.3.4. Dogs (Low Growth, Low Market Share)
- 4.4. Ansoff Matrix Analysis
- 4.5. Supply Chain Analysis
- 4.6. Regulatory Landscape
- 4.7. Current Market Potential and Opportunity Assessment (TAM–SAM–SOM Framework)
- 4.8. TIR Analyst Note
- 4.1. Porters Five Forces
- 5. Market Analysis, Insights and Forecast 2021-2033
- 5.1. Market Analysis, Insights and Forecast - by Application
- 5.1.1. Datacenter Transceivers
- 5.1.2. Long Haul Transceivers
- 5.1.3. Optical Interconnects
- 5.1.4. Automotive LiDAR
- 5.1.5. Immunoassay Tests
- 5.1.6. Fiber-optic Gyroscope
- 5.1.7. Others
- 5.2. Market Analysis, Insights and Forecast - by Types
- 5.2.1. 100G Silicon Photonic Transceiver
- 5.2.2. 200G/400G Silicon Photonic Transceiver
- 5.2.3. Others
- 5.3. Market Analysis, Insights and Forecast - by Region
- 5.3.1. North America
- 5.3.2. South America
- 5.3.3. Europe
- 5.3.4. Middle East & Africa
- 5.3.5. Asia Pacific
- 5.1. Market Analysis, Insights and Forecast - by Application
- 6. Global Si Photonics Transceivers Analysis, Insights and Forecast, 2021-2033
- 6.1. Market Analysis, Insights and Forecast - by Application
- 6.1.1. Datacenter Transceivers
- 6.1.2. Long Haul Transceivers
- 6.1.3. Optical Interconnects
- 6.1.4. Automotive LiDAR
- 6.1.5. Immunoassay Tests
- 6.1.6. Fiber-optic Gyroscope
- 6.1.7. Others
- 6.2. Market Analysis, Insights and Forecast - by Types
- 6.2.1. 100G Silicon Photonic Transceiver
- 6.2.2. 200G/400G Silicon Photonic Transceiver
- 6.2.3. Others
- 6.1. Market Analysis, Insights and Forecast - by Application
- 7. North America Si Photonics Transceivers Analysis, Insights and Forecast, 2020-2032
- 7.1. Market Analysis, Insights and Forecast - by Application
- 7.1.1. Datacenter Transceivers
- 7.1.2. Long Haul Transceivers
- 7.1.3. Optical Interconnects
- 7.1.4. Automotive LiDAR
- 7.1.5. Immunoassay Tests
- 7.1.6. Fiber-optic Gyroscope
- 7.1.7. Others
- 7.2. Market Analysis, Insights and Forecast - by Types
- 7.2.1. 100G Silicon Photonic Transceiver
- 7.2.2. 200G/400G Silicon Photonic Transceiver
- 7.2.3. Others
- 7.1. Market Analysis, Insights and Forecast - by Application
- 8. South America Si Photonics Transceivers Analysis, Insights and Forecast, 2020-2032
- 8.1. Market Analysis, Insights and Forecast - by Application
- 8.1.1. Datacenter Transceivers
- 8.1.2. Long Haul Transceivers
- 8.1.3. Optical Interconnects
- 8.1.4. Automotive LiDAR
- 8.1.5. Immunoassay Tests
- 8.1.6. Fiber-optic Gyroscope
- 8.1.7. Others
- 8.2. Market Analysis, Insights and Forecast - by Types
- 8.2.1. 100G Silicon Photonic Transceiver
- 8.2.2. 200G/400G Silicon Photonic Transceiver
- 8.2.3. Others
- 8.1. Market Analysis, Insights and Forecast - by Application
- 9. Europe Si Photonics Transceivers Analysis, Insights and Forecast, 2020-2032
- 9.1. Market Analysis, Insights and Forecast - by Application
- 9.1.1. Datacenter Transceivers
- 9.1.2. Long Haul Transceivers
- 9.1.3. Optical Interconnects
- 9.1.4. Automotive LiDAR
- 9.1.5. Immunoassay Tests
- 9.1.6. Fiber-optic Gyroscope
- 9.1.7. Others
- 9.2. Market Analysis, Insights and Forecast - by Types
- 9.2.1. 100G Silicon Photonic Transceiver
- 9.2.2. 200G/400G Silicon Photonic Transceiver
- 9.2.3. Others
- 9.1. Market Analysis, Insights and Forecast - by Application
- 10. Middle East & Africa Si Photonics Transceivers Analysis, Insights and Forecast, 2020-2032
- 10.1. Market Analysis, Insights and Forecast - by Application
- 10.1.1. Datacenter Transceivers
- 10.1.2. Long Haul Transceivers
- 10.1.3. Optical Interconnects
- 10.1.4. Automotive LiDAR
- 10.1.5. Immunoassay Tests
- 10.1.6. Fiber-optic Gyroscope
- 10.1.7. Others
- 10.2. Market Analysis, Insights and Forecast - by Types
- 10.2.1. 100G Silicon Photonic Transceiver
- 10.2.2. 200G/400G Silicon Photonic Transceiver
- 10.2.3. Others
- 10.1. Market Analysis, Insights and Forecast - by Application
- 11. Asia Pacific Si Photonics Transceivers Analysis, Insights and Forecast, 2020-2032
- 11.1. Market Analysis, Insights and Forecast - by Application
- 11.1.1. Datacenter Transceivers
- 11.1.2. Long Haul Transceivers
- 11.1.3. Optical Interconnects
- 11.1.4. Automotive LiDAR
- 11.1.5. Immunoassay Tests
- 11.1.6. Fiber-optic Gyroscope
- 11.1.7. Others
- 11.2. Market Analysis, Insights and Forecast - by Types
- 11.2.1. 100G Silicon Photonic Transceiver
- 11.2.2. 200G/400G Silicon Photonic Transceiver
- 11.2.3. Others
- 11.1. Market Analysis, Insights and Forecast - by Application
- 12. Competitive Analysis
- 12.1. Company Profiles
- 12.1.1 Cisco Systems
- 12.1.1.1. Company Overview
- 12.1.1.2. Products
- 12.1.1.3. Company Financials
- 12.1.1.4. SWOT Analysis
- 12.1.2 Intel
- 12.1.2.1. Company Overview
- 12.1.2.2. Products
- 12.1.2.3. Company Financials
- 12.1.2.4. SWOT Analysis
- 12.1.3 InPhi
- 12.1.3.1. Company Overview
- 12.1.3.2. Products
- 12.1.3.3. Company Financials
- 12.1.3.4. SWOT Analysis
- 12.1.4 Finisar (II-VI Incorporated)
- 12.1.4.1. Company Overview
- 12.1.4.2. Products
- 12.1.4.3. Company Financials
- 12.1.4.4. SWOT Analysis
- 12.1.5 Juniper
- 12.1.5.1. Company Overview
- 12.1.5.2. Products
- 12.1.5.3. Company Financials
- 12.1.5.4. SWOT Analysis
- 12.1.6 Rockley Photonics
- 12.1.6.1. Company Overview
- 12.1.6.2. Products
- 12.1.6.3. Company Financials
- 12.1.6.4. SWOT Analysis
- 12.1.7 FUJITSU
- 12.1.7.1. Company Overview
- 12.1.7.2. Products
- 12.1.7.3. Company Financials
- 12.1.7.4. SWOT Analysis
- 12.1.1 Cisco Systems
- 12.2. Market Entropy
- 12.2.1 Company's Key Areas Served
- 12.2.2 Recent Developments
- 12.3. Company Market Share Analysis 2025
- 12.3.1 Top 5 Companies Market Share Analysis
- 12.3.2 Top 3 Companies Market Share Analysis
- 12.4. List of Potential Customers
- 13. Research Methodology
List of Figures
- Figure 1: Global Si Photonics Transceivers Revenue Breakdown (billion, %) by Region 2025 & 2033
- Figure 2: Global Si Photonics Transceivers Volume Breakdown (K, %) by Region 2025 & 2033
- Figure 3: North America Si Photonics Transceivers Revenue (billion), by Application 2025 & 2033
- Figure 4: North America Si Photonics Transceivers Volume (K), by Application 2025 & 2033
- Figure 5: North America Si Photonics Transceivers Revenue Share (%), by Application 2025 & 2033
- Figure 6: North America Si Photonics Transceivers Volume Share (%), by Application 2025 & 2033
- Figure 7: North America Si Photonics Transceivers Revenue (billion), by Types 2025 & 2033
- Figure 8: North America Si Photonics Transceivers Volume (K), by Types 2025 & 2033
- Figure 9: North America Si Photonics Transceivers Revenue Share (%), by Types 2025 & 2033
- Figure 10: North America Si Photonics Transceivers Volume Share (%), by Types 2025 & 2033
- Figure 11: North America Si Photonics Transceivers Revenue (billion), by Country 2025 & 2033
- Figure 12: North America Si Photonics Transceivers Volume (K), by Country 2025 & 2033
- Figure 13: North America Si Photonics Transceivers Revenue Share (%), by Country 2025 & 2033
- Figure 14: North America Si Photonics Transceivers Volume Share (%), by Country 2025 & 2033
- Figure 15: South America Si Photonics Transceivers Revenue (billion), by Application 2025 & 2033
- Figure 16: South America Si Photonics Transceivers Volume (K), by Application 2025 & 2033
- Figure 17: South America Si Photonics Transceivers Revenue Share (%), by Application 2025 & 2033
- Figure 18: South America Si Photonics Transceivers Volume Share (%), by Application 2025 & 2033
- Figure 19: South America Si Photonics Transceivers Revenue (billion), by Types 2025 & 2033
- Figure 20: South America Si Photonics Transceivers Volume (K), by Types 2025 & 2033
- Figure 21: South America Si Photonics Transceivers Revenue Share (%), by Types 2025 & 2033
- Figure 22: South America Si Photonics Transceivers Volume Share (%), by Types 2025 & 2033
- Figure 23: South America Si Photonics Transceivers Revenue (billion), by Country 2025 & 2033
- Figure 24: South America Si Photonics Transceivers Volume (K), by Country 2025 & 2033
- Figure 25: South America Si Photonics Transceivers Revenue Share (%), by Country 2025 & 2033
- Figure 26: South America Si Photonics Transceivers Volume Share (%), by Country 2025 & 2033
- Figure 27: Europe Si Photonics Transceivers Revenue (billion), by Application 2025 & 2033
- Figure 28: Europe Si Photonics Transceivers Volume (K), by Application 2025 & 2033
- Figure 29: Europe Si Photonics Transceivers Revenue Share (%), by Application 2025 & 2033
- Figure 30: Europe Si Photonics Transceivers Volume Share (%), by Application 2025 & 2033
- Figure 31: Europe Si Photonics Transceivers Revenue (billion), by Types 2025 & 2033
- Figure 32: Europe Si Photonics Transceivers Volume (K), by Types 2025 & 2033
- Figure 33: Europe Si Photonics Transceivers Revenue Share (%), by Types 2025 & 2033
- Figure 34: Europe Si Photonics Transceivers Volume Share (%), by Types 2025 & 2033
- Figure 35: Europe Si Photonics Transceivers Revenue (billion), by Country 2025 & 2033
- Figure 36: Europe Si Photonics Transceivers Volume (K), by Country 2025 & 2033
- Figure 37: Europe Si Photonics Transceivers Revenue Share (%), by Country 2025 & 2033
- Figure 38: Europe Si Photonics Transceivers Volume Share (%), by Country 2025 & 2033
- Figure 39: Middle East & Africa Si Photonics Transceivers Revenue (billion), by Application 2025 & 2033
- Figure 40: Middle East & Africa Si Photonics Transceivers Volume (K), by Application 2025 & 2033
- Figure 41: Middle East & Africa Si Photonics Transceivers Revenue Share (%), by Application 2025 & 2033
- Figure 42: Middle East & Africa Si Photonics Transceivers Volume Share (%), by Application 2025 & 2033
- Figure 43: Middle East & Africa Si Photonics Transceivers Revenue (billion), by Types 2025 & 2033
- Figure 44: Middle East & Africa Si Photonics Transceivers Volume (K), by Types 2025 & 2033
- Figure 45: Middle East & Africa Si Photonics Transceivers Revenue Share (%), by Types 2025 & 2033
- Figure 46: Middle East & Africa Si Photonics Transceivers Volume Share (%), by Types 2025 & 2033
- Figure 47: Middle East & Africa Si Photonics Transceivers Revenue (billion), by Country 2025 & 2033
- Figure 48: Middle East & Africa Si Photonics Transceivers Volume (K), by Country 2025 & 2033
- Figure 49: Middle East & Africa Si Photonics Transceivers Revenue Share (%), by Country 2025 & 2033
- Figure 50: Middle East & Africa Si Photonics Transceivers Volume Share (%), by Country 2025 & 2033
- Figure 51: Asia Pacific Si Photonics Transceivers Revenue (billion), by Application 2025 & 2033
- Figure 52: Asia Pacific Si Photonics Transceivers Volume (K), by Application 2025 & 2033
- Figure 53: Asia Pacific Si Photonics Transceivers Revenue Share (%), by Application 2025 & 2033
- Figure 54: Asia Pacific Si Photonics Transceivers Volume Share (%), by Application 2025 & 2033
- Figure 55: Asia Pacific Si Photonics Transceivers Revenue (billion), by Types 2025 & 2033
- Figure 56: Asia Pacific Si Photonics Transceivers Volume (K), by Types 2025 & 2033
- Figure 57: Asia Pacific Si Photonics Transceivers Revenue Share (%), by Types 2025 & 2033
- Figure 58: Asia Pacific Si Photonics Transceivers Volume Share (%), by Types 2025 & 2033
- Figure 59: Asia Pacific Si Photonics Transceivers Revenue (billion), by Country 2025 & 2033
- Figure 60: Asia Pacific Si Photonics Transceivers Volume (K), by Country 2025 & 2033
- Figure 61: Asia Pacific Si Photonics Transceivers Revenue Share (%), by Country 2025 & 2033
- Figure 62: Asia Pacific Si Photonics Transceivers Volume Share (%), by Country 2025 & 2033
List of Tables
- Table 1: Global Si Photonics Transceivers Revenue billion Forecast, by Application 2020 & 2033
- Table 2: Global Si Photonics Transceivers Volume K Forecast, by Application 2020 & 2033
- Table 3: Global Si Photonics Transceivers Revenue billion Forecast, by Types 2020 & 2033
- Table 4: Global Si Photonics Transceivers Volume K Forecast, by Types 2020 & 2033
- Table 5: Global Si Photonics Transceivers Revenue billion Forecast, by Region 2020 & 2033
- Table 6: Global Si Photonics Transceivers Volume K Forecast, by Region 2020 & 2033
- Table 7: Global Si Photonics Transceivers Revenue billion Forecast, by Application 2020 & 2033
- Table 8: Global Si Photonics Transceivers Volume K Forecast, by Application 2020 & 2033
- Table 9: Global Si Photonics Transceivers Revenue billion Forecast, by Types 2020 & 2033
- Table 10: Global Si Photonics Transceivers Volume K Forecast, by Types 2020 & 2033
- Table 11: Global Si Photonics Transceivers Revenue billion Forecast, by Country 2020 & 2033
- Table 12: Global Si Photonics Transceivers Volume K Forecast, by Country 2020 & 2033
- Table 13: United States Si Photonics Transceivers Revenue (billion) Forecast, by Application 2020 & 2033
- Table 14: United States Si Photonics Transceivers Volume (K) Forecast, by Application 2020 & 2033
- Table 15: Canada Si Photonics Transceivers Revenue (billion) Forecast, by Application 2020 & 2033
- Table 16: Canada Si Photonics Transceivers Volume (K) Forecast, by Application 2020 & 2033
- Table 17: Mexico Si Photonics Transceivers Revenue (billion) Forecast, by Application 2020 & 2033
- Table 18: Mexico Si Photonics Transceivers Volume (K) Forecast, by Application 2020 & 2033
- Table 19: Global Si Photonics Transceivers Revenue billion Forecast, by Application 2020 & 2033
- Table 20: Global Si Photonics Transceivers Volume K Forecast, by Application 2020 & 2033
- Table 21: Global Si Photonics Transceivers Revenue billion Forecast, by Types 2020 & 2033
- Table 22: Global Si Photonics Transceivers Volume K Forecast, by Types 2020 & 2033
- Table 23: Global Si Photonics Transceivers Revenue billion Forecast, by Country 2020 & 2033
- Table 24: Global Si Photonics Transceivers Volume K Forecast, by Country 2020 & 2033
- Table 25: Brazil Si Photonics Transceivers Revenue (billion) Forecast, by Application 2020 & 2033
- Table 26: Brazil Si Photonics Transceivers Volume (K) Forecast, by Application 2020 & 2033
- Table 27: Argentina Si Photonics Transceivers Revenue (billion) Forecast, by Application 2020 & 2033
- Table 28: Argentina Si Photonics Transceivers Volume (K) Forecast, by Application 2020 & 2033
- Table 29: Rest of South America Si Photonics Transceivers Revenue (billion) Forecast, by Application 2020 & 2033
- Table 30: Rest of South America Si Photonics Transceivers Volume (K) Forecast, by Application 2020 & 2033
- Table 31: Global Si Photonics Transceivers Revenue billion Forecast, by Application 2020 & 2033
- Table 32: Global Si Photonics Transceivers Volume K Forecast, by Application 2020 & 2033
- Table 33: Global Si Photonics Transceivers Revenue billion Forecast, by Types 2020 & 2033
- Table 34: Global Si Photonics Transceivers Volume K Forecast, by Types 2020 & 2033
- Table 35: Global Si Photonics Transceivers Revenue billion Forecast, by Country 2020 & 2033
- Table 36: Global Si Photonics Transceivers Volume K Forecast, by Country 2020 & 2033
- Table 37: United Kingdom Si Photonics Transceivers Revenue (billion) Forecast, by Application 2020 & 2033
- Table 38: United Kingdom Si Photonics Transceivers Volume (K) Forecast, by Application 2020 & 2033
- Table 39: Germany Si Photonics Transceivers Revenue (billion) Forecast, by Application 2020 & 2033
- Table 40: Germany Si Photonics Transceivers Volume (K) Forecast, by Application 2020 & 2033
- Table 41: France Si Photonics Transceivers Revenue (billion) Forecast, by Application 2020 & 2033
- Table 42: France Si Photonics Transceivers Volume (K) Forecast, by Application 2020 & 2033
- Table 43: Italy Si Photonics Transceivers Revenue (billion) Forecast, by Application 2020 & 2033
- Table 44: Italy Si Photonics Transceivers Volume (K) Forecast, by Application 2020 & 2033
- Table 45: Spain Si Photonics Transceivers Revenue (billion) Forecast, by Application 2020 & 2033
- Table 46: Spain Si Photonics Transceivers Volume (K) Forecast, by Application 2020 & 2033
- Table 47: Russia Si Photonics Transceivers Revenue (billion) Forecast, by Application 2020 & 2033
- Table 48: Russia Si Photonics Transceivers Volume (K) Forecast, by Application 2020 & 2033
- Table 49: Benelux Si Photonics Transceivers Revenue (billion) Forecast, by Application 2020 & 2033
- Table 50: Benelux Si Photonics Transceivers Volume (K) Forecast, by Application 2020 & 2033
- Table 51: Nordics Si Photonics Transceivers Revenue (billion) Forecast, by Application 2020 & 2033
- Table 52: Nordics Si Photonics Transceivers Volume (K) Forecast, by Application 2020 & 2033
- Table 53: Rest of Europe Si Photonics Transceivers Revenue (billion) Forecast, by Application 2020 & 2033
- Table 54: Rest of Europe Si Photonics Transceivers Volume (K) Forecast, by Application 2020 & 2033
- Table 55: Global Si Photonics Transceivers Revenue billion Forecast, by Application 2020 & 2033
- Table 56: Global Si Photonics Transceivers Volume K Forecast, by Application 2020 & 2033
- Table 57: Global Si Photonics Transceivers Revenue billion Forecast, by Types 2020 & 2033
- Table 58: Global Si Photonics Transceivers Volume K Forecast, by Types 2020 & 2033
- Table 59: Global Si Photonics Transceivers Revenue billion Forecast, by Country 2020 & 2033
- Table 60: Global Si Photonics Transceivers Volume K Forecast, by Country 2020 & 2033
- Table 61: Turkey Si Photonics Transceivers Revenue (billion) Forecast, by Application 2020 & 2033
- Table 62: Turkey Si Photonics Transceivers Volume (K) Forecast, by Application 2020 & 2033
- Table 63: Israel Si Photonics Transceivers Revenue (billion) Forecast, by Application 2020 & 2033
- Table 64: Israel Si Photonics Transceivers Volume (K) Forecast, by Application 2020 & 2033
- Table 65: GCC Si Photonics Transceivers Revenue (billion) Forecast, by Application 2020 & 2033
- Table 66: GCC Si Photonics Transceivers Volume (K) Forecast, by Application 2020 & 2033
- Table 67: North Africa Si Photonics Transceivers Revenue (billion) Forecast, by Application 2020 & 2033
- Table 68: North Africa Si Photonics Transceivers Volume (K) Forecast, by Application 2020 & 2033
- Table 69: South Africa Si Photonics Transceivers Revenue (billion) Forecast, by Application 2020 & 2033
- Table 70: South Africa Si Photonics Transceivers Volume (K) Forecast, by Application 2020 & 2033
- Table 71: Rest of Middle East & Africa Si Photonics Transceivers Revenue (billion) Forecast, by Application 2020 & 2033
- Table 72: Rest of Middle East & Africa Si Photonics Transceivers Volume (K) Forecast, by Application 2020 & 2033
- Table 73: Global Si Photonics Transceivers Revenue billion Forecast, by Application 2020 & 2033
- Table 74: Global Si Photonics Transceivers Volume K Forecast, by Application 2020 & 2033
- Table 75: Global Si Photonics Transceivers Revenue billion Forecast, by Types 2020 & 2033
- Table 76: Global Si Photonics Transceivers Volume K Forecast, by Types 2020 & 2033
- Table 77: Global Si Photonics Transceivers Revenue billion Forecast, by Country 2020 & 2033
- Table 78: Global Si Photonics Transceivers Volume K Forecast, by Country 2020 & 2033
- Table 79: China Si Photonics Transceivers Revenue (billion) Forecast, by Application 2020 & 2033
- Table 80: China Si Photonics Transceivers Volume (K) Forecast, by Application 2020 & 2033
- Table 81: India Si Photonics Transceivers Revenue (billion) Forecast, by Application 2020 & 2033
- Table 82: India Si Photonics Transceivers Volume (K) Forecast, by Application 2020 & 2033
- Table 83: Japan Si Photonics Transceivers Revenue (billion) Forecast, by Application 2020 & 2033
- Table 84: Japan Si Photonics Transceivers Volume (K) Forecast, by Application 2020 & 2033
- Table 85: South Korea Si Photonics Transceivers Revenue (billion) Forecast, by Application 2020 & 2033
- Table 86: South Korea Si Photonics Transceivers Volume (K) Forecast, by Application 2020 & 2033
- Table 87: ASEAN Si Photonics Transceivers Revenue (billion) Forecast, by Application 2020 & 2033
- Table 88: ASEAN Si Photonics Transceivers Volume (K) Forecast, by Application 2020 & 2033
- Table 89: Oceania Si Photonics Transceivers Revenue (billion) Forecast, by Application 2020 & 2033
- Table 90: Oceania Si Photonics Transceivers Volume (K) Forecast, by Application 2020 & 2033
- Table 91: Rest of Asia Pacific Si Photonics Transceivers Revenue (billion) Forecast, by Application 2020 & 2033
- Table 92: Rest of Asia Pacific Si Photonics Transceivers Volume (K) Forecast, by Application 2020 & 2033
Frequently Asked Questions
1. What is the projected Compound Annual Growth Rate (CAGR) of the Si Photonics Transceivers?
The projected CAGR is approximately 29.2%.
2. Which companies are prominent players in the Si Photonics Transceivers?
Key companies in the market include Cisco Systems, Intel, InPhi, Finisar (II-VI Incorporated), Juniper, Rockley Photonics, FUJITSU.
3. What are the main segments of the Si Photonics Transceivers?
The market segments include Application, Types.
4. Can you provide details about the market size?
The market size is estimated to be USD 2.71 billion as of 2022.
5. What are some drivers contributing to market growth?
N/A
6. What are the notable trends driving market growth?
N/A
7. Are there any restraints impacting market growth?
N/A
8. Can you provide examples of recent developments in the market?
N/A
9. What pricing options are available for accessing the report?
Pricing options include single-user, multi-user, and enterprise licenses priced at USD 3350.00, USD 5025.00, and USD 6700.00 respectively.
10. Is the market size provided in terms of value or volume?
The market size is provided in terms of value, measured in billion and volume, measured in K.
11. Are there any specific market keywords associated with the report?
Yes, the market keyword associated with the report is "Si Photonics Transceivers," which aids in identifying and referencing the specific market segment covered.
12. How do I determine which pricing option suits my needs best?
The pricing options vary based on user requirements and access needs. Individual users may opt for single-user licenses, while businesses requiring broader access may choose multi-user or enterprise licenses for cost-effective access to the report.
13. Are there any additional resources or data provided in the Si Photonics Transceivers report?
While the report offers comprehensive insights, it's advisable to review the specific contents or supplementary materials provided to ascertain if additional resources or data are available.
14. How can I stay updated on further developments or reports in the Si Photonics Transceivers?
To stay informed about further developments, trends, and reports in the Si Photonics Transceivers, consider subscribing to industry newsletters, following relevant companies and organizations, or regularly checking reputable industry news sources and publications.
Methodology
Step 1 - Identification of Relevant Samples Size from Population Database


Step 2 - Approaches for Defining Global Market Size (Value, Volume* & Price*)

Note*: In applicable scenarios
Step 3 - Data Sources
Primary Research
- Web Analytics
- Survey Reports
- Research Institute
- Latest Research Reports
- Opinion Leaders
Secondary Research
- Annual Reports
- White Paper
- Latest Press Release
- Industry Association
- Paid Database
- Investor Presentations

Step 4 - Data Triangulation
Involves using different sources of information in order to increase the validity of a study
These sources are likely to be stakeholders in a program - participants, other researchers, program staff, other community members, and so on.
Then we put all data in single framework & apply various statistical tools to find out the dynamic on the market.
During the analysis stage, feedback from the stakeholder groups would be compared to determine areas of agreement as well as areas of divergence