


Key Insights
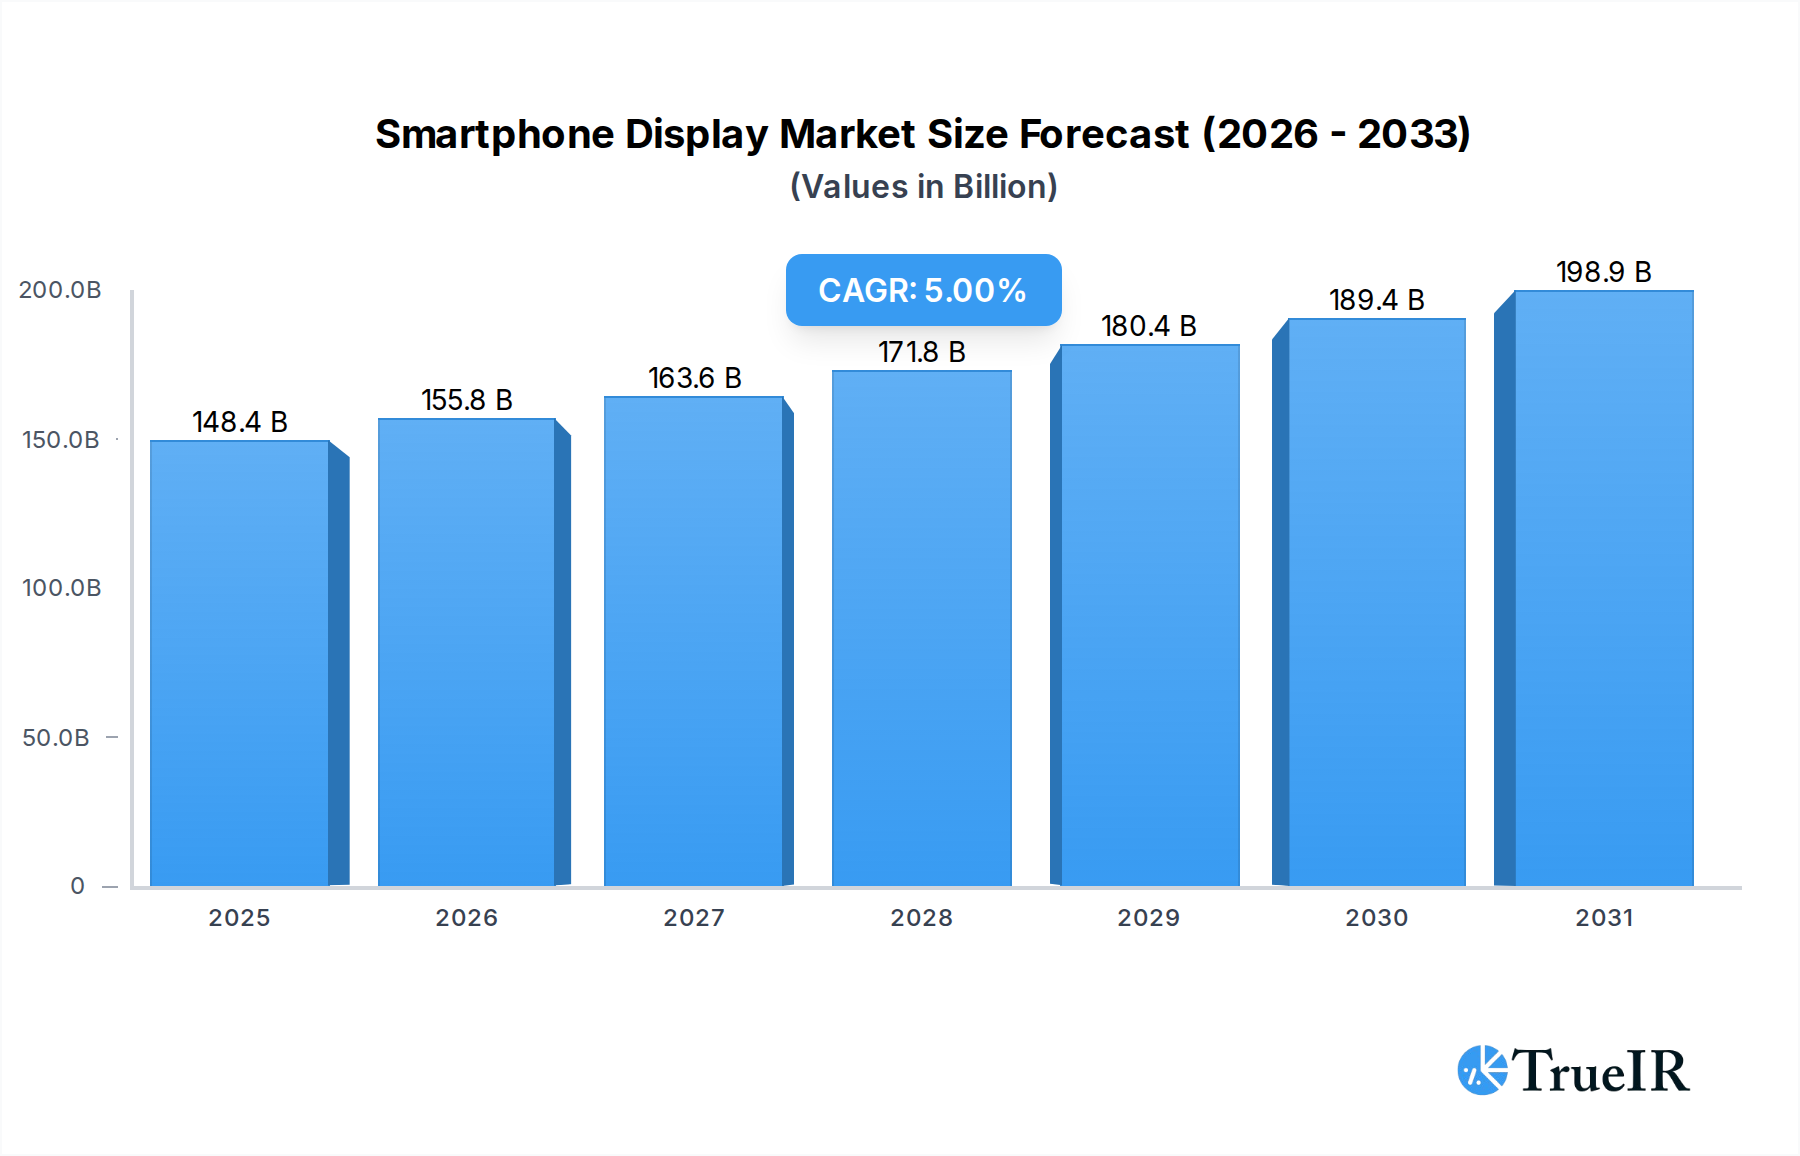
The Global Smartphone Display Market is currently valued at $141.36 billion in 2024, demonstrating a robust expansion trajectory driven by continuous technological advancements and evolving consumer preferences. Projections indicate a compound annual growth rate (CAGR) of 5% from 2024 to 2033, with the market anticipated to reach approximately $219.30 billion by the end of the forecast period. This significant growth is primarily fueled by the escalating demand for high-resolution, power-efficient, and flexible display technologies, particularly within the premium and mid-range smartphone segments. The pervasive adoption of 5G networks globally is a substantial macro tailwind, enhancing mobile multimedia consumption and necessitating superior display performance for an immersive user experience. Innovations in the Active-Matrix Organic Light-Emitting Diode (AMOLED) and Organic Light-Emitting Diode (OLED) Display Market segments are pivotal, offering unparalleled contrast ratios, deeper blacks, and thinner form factors that enable novel smartphone designs, including the burgeoning Foldable Display Market. Furthermore, increasing smartphone penetration in emerging economies, coupled with a shorter replacement cycle for devices incorporating cutting-edge display features, continues to propel market expansion. The integration of advanced features such as higher refresh rates, under-display cameras, and improved color accuracy is becoming standard, pushing manufacturers to invest heavily in research and development to maintain competitive edge. The broader Consumer Electronics Market's shift towards interconnected smart devices also indirectly stimulates the demand for sophisticated smartphone displays, acting as central hubs for digital ecosystems. This dynamic environment underscores a market ripe for sustained innovation and strategic investments across the value chain.
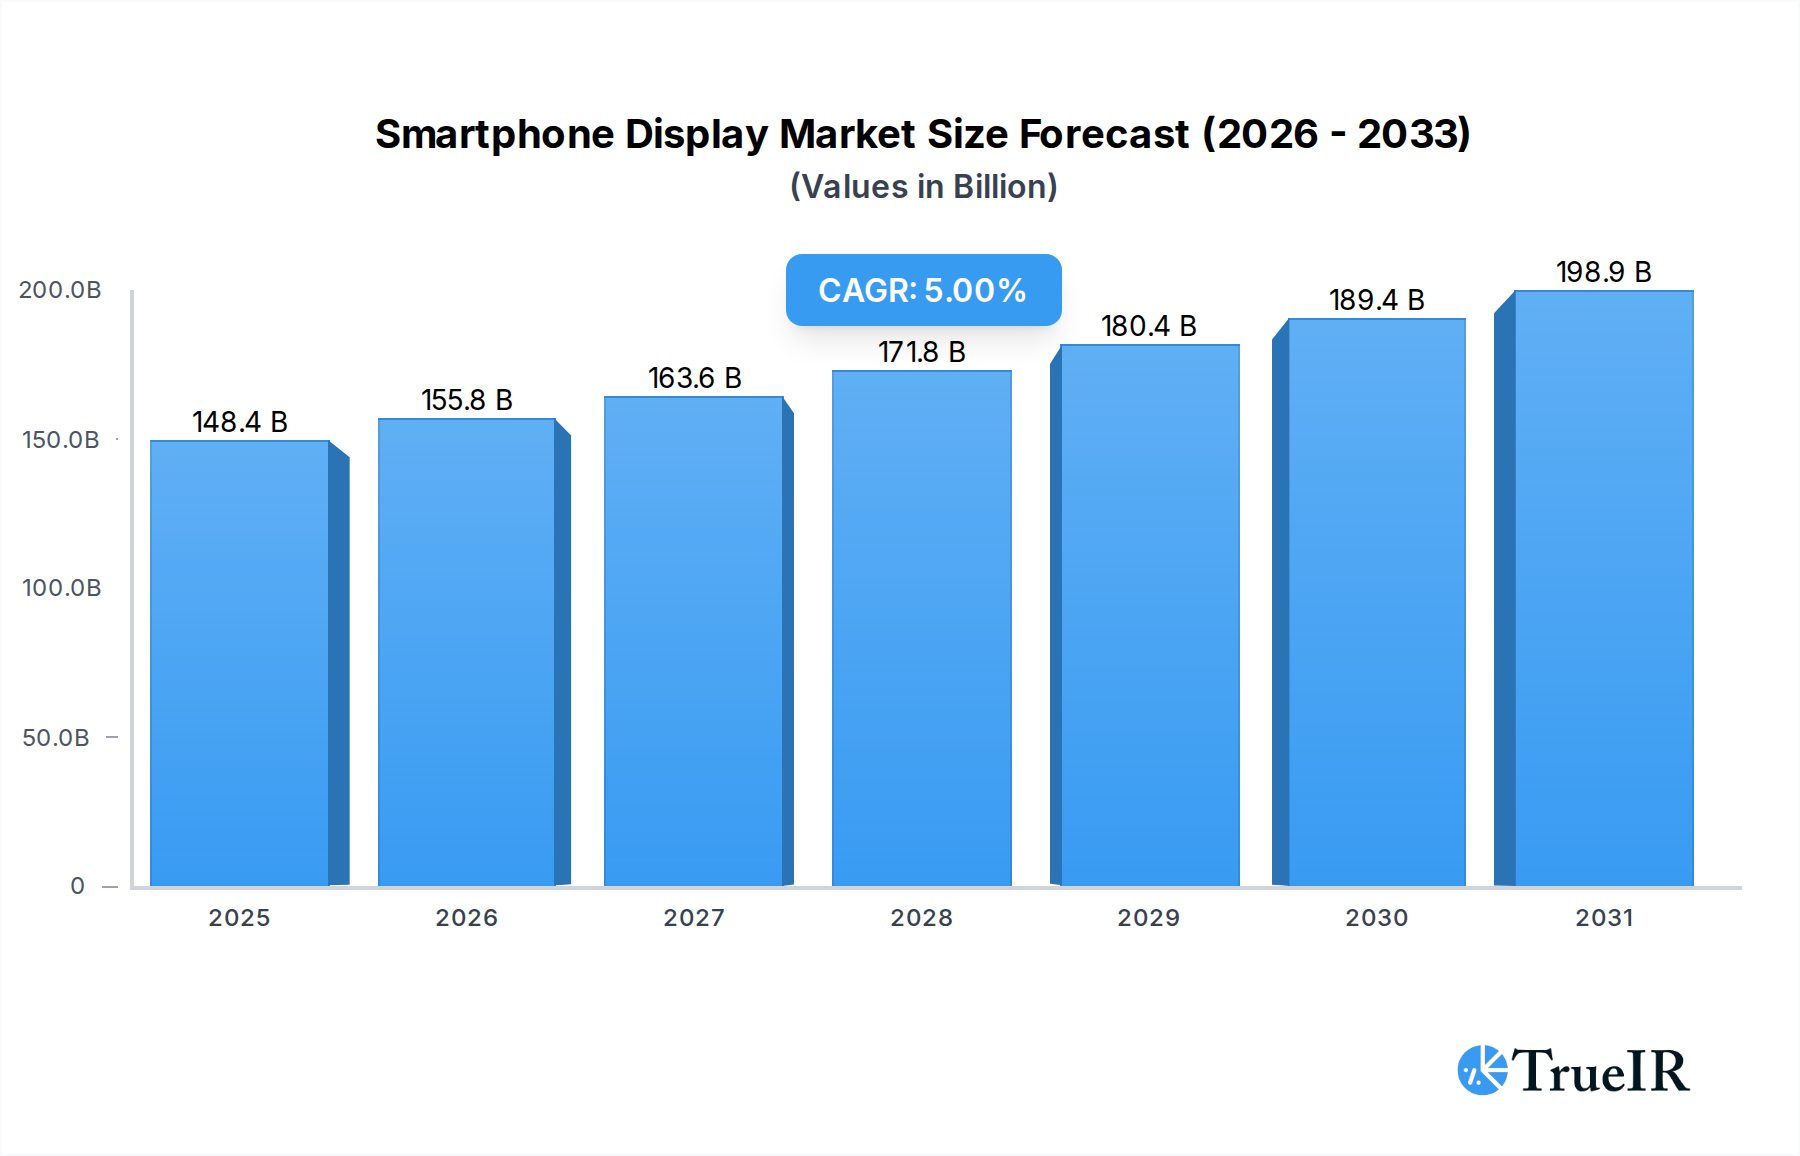
Smartphone Display Market Size (In Billion)

Dominant Active-Matrix Organic Light-Emitting Diode (AMOLED) Segment in Smartphone Display Market
The Active-Matrix Organic Light-Emitting Diode (AMOLED) segment has firmly established its dominance within the Smartphone Display Market, commanding a substantial revenue share and setting new benchmarks for display quality and innovation. AMOLED technology offers several distinct advantages over traditional Liquid Crystal Display (LCD) Market panels, including superior contrast ratios, true blacks (as individual pixels can be completely turned off), wider viewing angles, faster response times, and enhanced color accuracy. Crucially, AMOLED panels are inherently flexible, enabling the creation of curved, foldable, and even rollable smartphone form factors, which are key drivers of premiumization and market differentiation. This flexibility is a critical enabler for the rapidly expanding Foldable Display Market, where AMOLED is the undisputed core technology. Major smartphone manufacturers are increasingly integrating AMOLED displays into their flagship and even mid-range devices, recognizing the consumer demand for visually striking and technologically advanced screens. The inherent thinness of AMOLED panels also allows for more compact device designs and larger battery capacities, further enhancing user experience. Key players dominating the AMOLED manufacturing landscape include SAMSUNG, LG Electronics Inc., and BOE. SAMSUNG, in particular, has been a pioneer and remains a leader in AMOLED production, consistently introducing new generations of panels with improved efficiency, brightness, and durability. LG Electronics Inc., while a strong contender, focuses on both its own devices and supplying to other OEMs. BOE, a rapidly growing Chinese manufacturer, has significantly ramped up its AMOLED production capabilities, challenging the established leaders and increasing supply chain diversification, especially for the expanding Chinese smartphone brands. The market share of AMOLED is not only growing but also consolidating around these technological leaders due as manufacturing AMOLED panels requires significant capital investment, highly specialized equipment, and extensive R&D, creating high barriers to entry. This consolidation ensures that innovation continues to be driven by a few major players who can afford the necessary investments to push the boundaries of the OLED Display Market. As manufacturing costs decrease through economies of scale and efficiency improvements, AMOLED technology is expected to penetrate even further into the mass-market smartphone segments, widening its lead over other display technologies.
Smartphone Display Company Market Share
Key Market Drivers & Innovation in Smartphone Display Market
The Smartphone Display Market is propelled by several key drivers and continuous innovation, intricately linked to advancements in broader technology sectors. Firstly, Consumer Demand for Advanced Visual Experiences is paramount. Consumers are increasingly prioritizing smartphones with higher refresh rates (e.g., 90Hz, 120Hz, and beyond), higher resolutions (FHD, QHD), and improved color accuracy (DCI-P3 gamut support). This demand directly correlates with the "Resolution" and "Price Range (Premium)" segments identified in the market data, where premium displays command a higher value due to superior visual performance. For instance, the market has seen a rapid shift towards devices offering at least an FHD+ resolution, with QHD+ becoming a standard for flagship models, compelling display manufacturers to continually innovate in pixel density and panel quality. Secondly, the Emergence of New Form Factors serves as a significant impetus. The introduction of devices in the Foldable Display Market has revolutionized smartphone design, creating a new segment that exclusively relies on flexible OLED Display Market technology. The market data highlights "Foldable" and even "Rollable/Slidable" options under "Form Factor," indicating a clear industry move towards highly adaptable screens. The demand for these innovative form factors is pushing display manufacturers to overcome complex engineering challenges related to durability, hinge mechanisms, and optical clarity, thereby stimulating substantial R&D investments. Thirdly, Global 5G Network Expansion profoundly impacts display requirements. The widespread deployment of 5G networks enables faster data transfer speeds, lower latency, and enhanced mobile multimedia consumption, including high-definition video streaming, cloud gaming, and augmented reality applications. To fully leverage these capabilities, smartphones require displays with superior performance, such as faster response times, higher brightness, and robust refresh rates to prevent motion blur and ensure a smooth, immersive user experience. This drives demand for high-end panels that can faithfully render the rich content delivered via 5G, benefiting the overall Display Technology Market. Lastly, Integration of Advanced AI and Powerful Processors contributes significantly. Modern smartphone chipsets, often designed by key players in the Semiconductor Market, are becoming increasingly powerful, capable of rendering complex graphics and supporting sophisticated user interfaces. Displays must evolve in tandem to showcase these processing capabilities effectively. Innovations like variable refresh rate technology (LTPO panels) allow displays to dynamically adjust their refresh rate based on content, optimizing power consumption while delivering peak performance when needed. This symbiosis between processing power and display technology ensures that the user interface remains fluid and responsive, supporting advanced applications and interactive features.
Competitive Ecosystem of Smartphone Display Market
The competitive landscape of the Smartphone Display Market is dominated by a few integrated electronics giants and specialized display manufacturers, with intense competition driving continuous innovation in panel technology and production efficiency. These companies operate globally, supplying panels to a vast array of smartphone OEMs.
- SAMSUNG: A global leader in smartphone manufacturing and, through Samsung Display, the undisputed leader in the OLED Display Market, particularly for AMOLED panels. The company consistently pushes the boundaries of display technology, introducing advancements like LTPO, foldable screens, and superior color accuracy, supplying not only its own devices but also numerous other major smartphone brands.
- Japan Display Inc. (JDI): Historically a significant player in the LCD Display Market, JDI has been working to pivot towards OLED technology to remain competitive. The company focuses on high-performance LCDs and is gradually increasing its presence in smaller OLED panels, often facing strong competition from South Korean and Chinese rivals.
- Toshiba Corporation: While primarily a diversified electronics and engineering company, Toshiba has historically contributed to display technology through various subsidiaries and joint ventures. Its involvement in the direct smartphone display market has diminished in recent years, focusing more on industrial and specialized display solutions.
- LG Electronics Inc.: A major player in both smartphone manufacturing and display production through LG Display. LG Display is a key competitor in the OLED Display Market, known for its expertise in large-format OLEDs (TVs) and increasingly for its flexible OLEDs used in smartphones and the nascent Foldable Display Market.
- Sharp Corporation: A Japanese electronics company known for its pioneering work in LCD technology. Sharp continues to be a significant supplier of high-quality LCD panels for various applications, including smartphones, and has also been investing in OLED production to diversify its display offerings.
- BOE: A rapidly ascending Chinese display manufacturer that has become a major force in the global Smartphone Display Market. BOE has aggressively expanded its production capacity for both LCD and flexible AMOLED panels, supplying a growing number of Chinese smartphone brands and increasingly competing with established leaders in the OLED Display Market.
- Fujitsu Ltd.: A Japanese multinational information technology equipment and services company. While a major IT player, its direct involvement in smartphone display manufacturing is limited; it focuses more on end-user devices and enterprise solutions rather than panel production.
- Sony Corporation: A prominent Japanese multinational conglomerate corporation. Sony designs and manufactures its own smartphones, which feature advanced displays, often sourcing cutting-edge panels from leading display manufacturers to integrate into its premium devices.
- Apple Inc.,: A global technology giant, Apple designs its own iPhones and sources its high-quality displays primarily from Samsung Display and LG Display. Apple's rigorous specifications and demand for innovative features like ProMotion (variable refresh rate) drive significant advancements in the OLED Display Market.
- Motorola Inc: A legacy telecommunications and electronics company, now part of Lenovo. Motorola produces a range of smartphones, integrating displays sourced from various manufacturers, often focusing on a balance of performance and cost-effectiveness across its product lines.
- Mitsubishi Electric Corporation: A Japanese multinational electronics and electrical equipment manufacturing company. While a diversified industrial player, its direct participation in the commodity smartphone display panel manufacturing market is minimal, with its focus typically on industrial displays and components.
- Innolux Corporation: A Taiwanese display panel manufacturer. Innolux is a significant player in the LCD Display Market for smartphones and other devices, known for its high-volume production capabilities and cost-effective solutions. It's a key supplier for many mid-range and budget smartphone brands.
- AUO (AU Optronics): Another leading Taiwanese display panel manufacturer. AUO is a major producer of LCD panels for smartphones, tablets, and other applications. Like Innolux, AUO focuses on competitive pricing and quality in the LCD segment while also exploring new display technologies.
- Others: This category includes smaller display manufacturers, specialized component suppliers, and emerging players from regions like China and South Korea who are investing in new display technologies or niche markets.
Recent Developments & Milestones in Smartphone Display Market
Recent years have seen a flurry of technological advancements and strategic movements within the Smartphone Display Market, indicative of a rapidly evolving sector:
- June 2024: Leading display manufacturers reportedly began mass production trials for third-generation under-display camera (UDC) technology, aiming for significantly improved selfie camera image quality and seamless screen integration for premium smartphones, impacting the overall Display Technology Market.
- April 2024: Several major smartphone OEMs announced plans to equip a wider range of mid-to-high-end smartphones with LTPO (low-temperature polycrystalline oxide) OLED panels, allowing for variable refresh rates from 1Hz to 120Hz, enhancing power efficiency and user experience for a broader consumer base.
- January 2024: Advances in ultra-thin Glass Substrate Market technologies enabled the production of more durable and flexible cover glasses for foldable phones, addressing key consumer concerns about screen longevity in the Foldable Display Market.
- November 2023: Key players in the OLED Display Market announced significant investments in expanding their small and medium-sized OLED panel production lines, particularly focusing on flexible and foldable applications to meet growing OEM demand.
- September 2023: A major display component supplier unveiled a new generation of touch-sensitive films that offer improved haptic feedback and responsiveness for next-gen Touchscreen Market panels, further enhancing user interaction.
- July 2023: Research efforts intensified in micro-LED technology for smartphone displays, with several prototypes showcasing high brightness and efficiency, although mass production for small form factors remains a long-term goal.
- May 2023: New strategic partnerships were formed between display manufacturers and materials science companies to develop more eco-friendly and recyclable display components, reflecting a growing industry focus on sustainability within the Consumer Electronics Market.
- February 2023: The first mass-produced smartphones featuring truly rollable/slidable displays were showcased at industry events, signaling the potential future direction for mobile form factors beyond rigid and foldable designs.
Regional Market Breakdown for Smartphone Display Market
The Smartphone Display Market exhibits significant regional variations in terms of market share, growth drivers, and technological adoption. While the market is globally interconnected, distinct regional dynamics shape demand and supply across different geographies.
Asia Pacific currently holds the largest market share in the Smartphone Display Market and is also projected to be the fastest-growing region during the forecast period. Countries like China, South Korea, Japan, and India are central to this dominance. China, in particular, is both a massive consumer market and a major manufacturing hub for smartphones and display components. The presence of leading display manufacturers (e.g., BOE, Samsung Display, LG Display) and numerous smartphone OEMs (e.g., Xiaomi, OPPO, Vivo, Samsung) in this region fuels high demand for diverse display types, from high-volume LCD Display Market panels for budget phones to cutting-edge OLED Display Market and Foldable Display Market solutions for premium devices. The primary driver here is the sheer volume of smartphone production and consumption, coupled with rapid urbanization and increasing disposable incomes in emerging economies, leading to a strong demand for advanced features.
North America represents a mature but highly valuable market segment, characterized by early adoption of premium smartphone models and cutting-edge display technologies. Consumers in the United States and Canada frequently upgrade to flagship devices featuring the latest innovations, such as high refresh rate AMOLED panels, QHD+ resolutions, and flexible displays. The primary demand driver in this region is the strong consumer preference for advanced user experiences, driven by high disposable incomes and a culture of adopting new technologies. This region is a significant importer of premium display modules.
Europe mirrors North America in its maturity and demand for high-end display technologies. Countries like Germany, the UK, France, and Italy exhibit robust demand for smartphones with advanced features, including those in the Foldable Display Market. The region's consumers prioritize aesthetic design, display quality, and seamless user interfaces. The drivers include high average selling prices for smartphones, strong brand loyalty to manufacturers offering innovative displays, and a technologically savvy consumer base. Like North America, Europe largely relies on imports for its smartphone display needs.
Middle East & Africa and South America are emerging markets experiencing substantial growth in smartphone penetration. While the initial demand might be for more economy and mid-range devices featuring cost-effective LCD Display Market solutions, there is a clear trend towards premiumization. As disposable incomes rise and network infrastructures improve, demand for devices with better displays (e.g., entry-level OLED panels) is steadily increasing. The primary demand driver in these regions is the ongoing shift from feature phones to smartphones, making them crucial for long-term volume growth for display manufacturers.
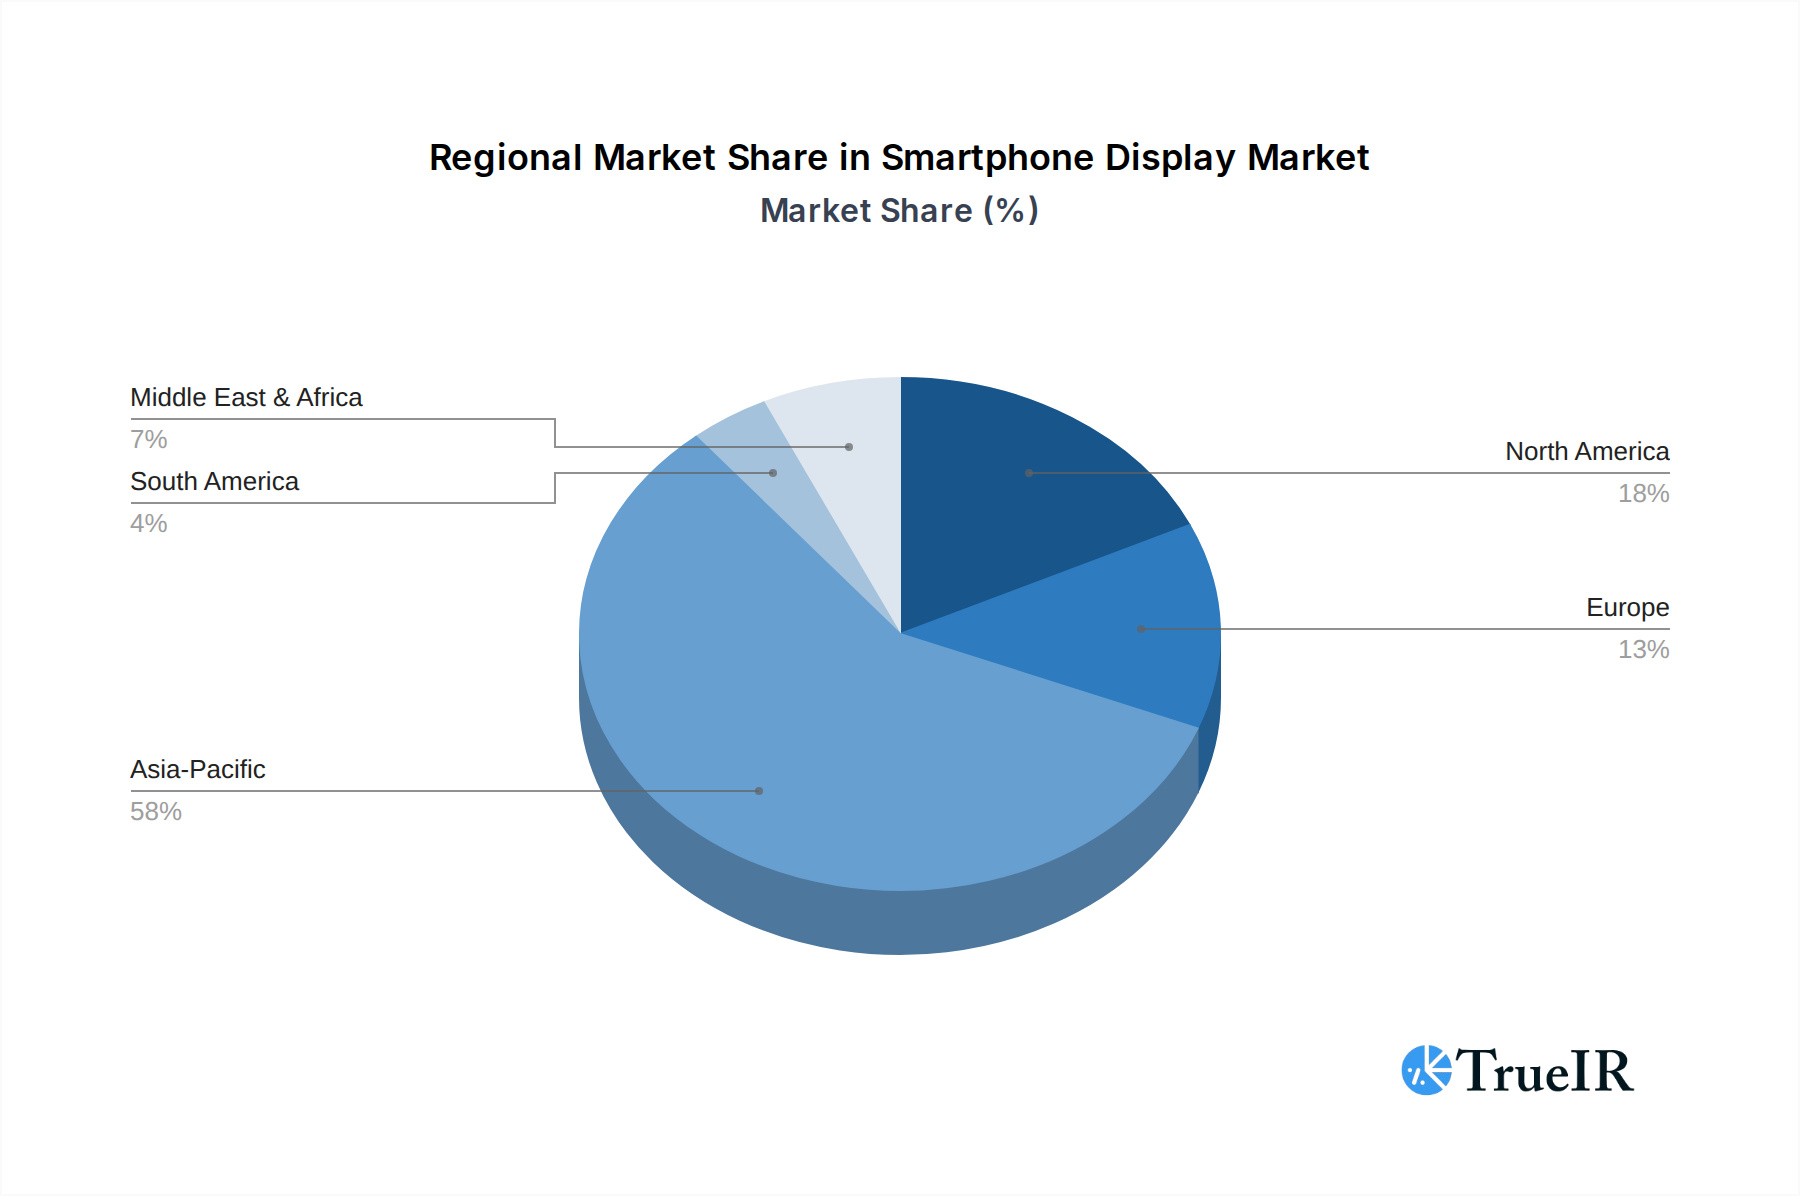
Smartphone Display Regional Market Share
Investment & Funding Activity in Smartphone Display Market
Investment and funding activity in the Smartphone Display Market has been robust over the past 2-3 years, predominantly channeled into advanced manufacturing capabilities, next-generation display technologies, and strategic partnerships aimed at securing supply chains. A significant portion of capital has been directed towards expanding production capacities for flexible and Foldable Display Market panels. For instance, major players in the OLED Display Market have announced multi-billion-dollar investments in new Gen 6 and Gen 8.5 flexible OLED fabs, primarily in China and South Korea, to meet the escalating demand from smartphone OEMs. These investments are crucial for improving yield rates, reducing production costs, and introducing larger, more complex flexible displays. Venture funding rounds have seen increased interest in startups focusing on novel display materials and manufacturing processes, such as quantum dot enhancement films, micro-LED display development, and advanced encapsulation technologies that prolong display lifespan. Micro-LED technology, in particular, has attracted considerable capital as it promises superior brightness, efficiency, and longevity compared to OLED, positioning it as a potential long-term disruptor in the Display Technology Market, especially for compact, high-resolution screens required by Wearable Devices Market and premium smartphones. Strategic partnerships are also a key feature of the funding landscape. Display manufacturers are collaborating with material suppliers for advanced Glass Substrate Market and polymer solutions, as well as with equipment manufacturers for high-precision deposition and laser processing tools. These partnerships aim to accelerate R&D and optimize the supply chain for complex components. The sub-segments attracting the most capital are clearly those related to next-generation flexible OLED and micro-LED technologies, driven by the desire to differentiate products in a highly competitive Consumer Electronics Market and to capture new market opportunities in emerging form factors and high-performance applications. Investments also extend to improving the energy efficiency and durability of displays, responding to both consumer expectations and regulatory pressures for more sustainable electronics.
Export, Trade Flow & Tariff Impact on Smartphone Display Market
The Smartphone Display Market is fundamentally globalized, with complex export and trade flow dynamics heavily influenced by regional manufacturing capabilities and geopolitical factors. The major trade corridors originate from Asia, specifically South Korea, China, and Taiwan, which are the primary global manufacturing hubs for advanced display panels, including the OLED Display Market and LCD Display Market components. These nations export billions of dollars worth of display modules to smartphone assembly plants located across Asia (e.g., Vietnam, India), North America, and Europe. Leading importing nations for display components are those with significant smartphone assembly operations or large consumer markets, such as Vietnam (for Samsung and Apple assembly), India (for local manufacturing initiatives), and to a lesser extent, Mexico and Brazil for regional production. The trade flow is highly specialized, with display panels often being an intermediate good that moves across borders multiple times as part of a complex supply chain.
Tariff and non-tariff barriers have demonstrably impacted the cross-border volume and cost structures within the Smartphone Display Market. The US-China trade tensions, for example, have led to the imposition of tariffs on certain electronic components, including display modules and manufacturing equipment. While direct tariffs on finished smartphone displays have been somewhat mitigated by shifts in supply chain strategies (e.g., assembly moving to Vietnam or India), the threat of tariffs has prompted many companies to diversify their manufacturing bases, increasing operational costs and leading to potential delays. Furthermore, non-tariff barriers, such as stringent regulatory approvals, intellectual property disputes, and export controls on advanced technology, can also impede trade. For instance, restrictions on the export of specialized Semiconductor Market manufacturing equipment or rare earth materials, critical for advanced display production, can disrupt the global supply chain, increasing the cost of raw materials like the Glass Substrate Market and other components. These trade policies can lead to localized price increases for display components, which are often passed on to smartphone OEMs and ultimately, to end-consumers. They also incentivize domestic production in importing nations, as seen with initiatives in India to foster local electronics manufacturing, though building a sophisticated display ecosystem takes significant time and investment. The impact is quantifiable through shifts in import/export volumes between affected countries and measurable increases in component pricing or diversification of procurement strategies by major players.
Smartphone Display Segmentation
-
1. Type
-
1.1. Liquid Crystal Display (LCD)
- 1.1.1. TFT LCD
- 1.1.2. IPS LCD
- 1.2. Organic Light-Emitting Diode (OLED)
- 1.3. Active-Matrix Organic Light- Emitting Diode (AMOLED)
- 1.4. Others
-
1.1. Liquid Crystal Display (LCD)
-
2. Form Factor
- 2.1. Flat (Rigid)
- 2.2. Curved Edge
- 2.3. Foldable
- 2.4. Rollable/Slidable
-
3. Resolution
- 3.1. HD
- 3.2. FHD
- 3.3. QHD
- 3.4. Others
-
4. Size
- 4.1. Compact
- 4.2. Standard
- 4.3. Large
-
5. Price Range
- 5.1. Premium
- 5.2. Mid-Range
- 5.3. Economy
-
6. Sales Channel
- 6.1. OEM
- 6.2. Aftermarket
Smartphone Display Segmentation By Geography
-
1. North America
- 1.1. United States
- 1.2. Canada
- 1.3. Mexico
-
2. South America
- 2.1. Brazil
- 2.2. Argentina
- 2.3. Rest of South America
-
3. Europe
- 3.1. United Kingdom
- 3.2. Germany
- 3.3. France
- 3.4. Italy
- 3.5. Spain
- 3.6. Russia
- 3.7. Benelux
- 3.8. Nordics
- 3.9. Rest of Europe
-
4. Middle East & Africa
- 4.1. Turkey
- 4.2. Israel
- 4.3. GCC
- 4.4. North Africa
- 4.5. South Africa
- 4.6. Rest of Middle East & Africa
-
5. Asia Pacific
- 5.1. China
- 5.2. India
- 5.3. Japan
- 5.4. South Korea
- 5.5. ASEAN
- 5.6. Oceania
- 5.7. Rest of Asia Pacific
Smartphone Display Regional Market Share
Geographic Coverage of Smartphone Display
Smartphone Display REPORT HIGHLIGHTS
| Aspects | Details |
|---|---|
| Study Period | 2020-2034 |
| Base Year | 2025 |
| Estimated Year | 2026 |
| Forecast Period | 2026-2034 |
| Historical Period | 2020-2025 |
| Growth Rate | CAGR of 5% from 2020-2034 |
| Segmentation |
|
Table of Contents
- 1. Introduction
- 1.1. Research Scope
- 1.2. Market Segmentation
- 1.3. Research Objective
- 1.4. Definitions and Assumptions
- 2. Executive Summary
- 2.1. Market Snapshot
- 3. Market Dynamics
- 3.1. Market Drivers
- 3.2. Market Restrains
- 3.3. Market Trends
- 3.4. Market Opportunities
- 4. Market Factor Analysis
- 4.1. Porters Five Forces
- 4.1.1. Bargaining Power of Suppliers
- 4.1.2. Bargaining Power of Buyers
- 4.1.3. Threat of New Entrants
- 4.1.4. Threat of Substitutes
- 4.1.5. Competitive Rivalry
- 4.2. PESTEL analysis
- 4.3. BCG Analysis
- 4.3.1. Stars (High Growth, High Market Share)
- 4.3.2. Cash Cows (Low Growth, High Market Share)
- 4.3.3. Question Mark (High Growth, Low Market Share)
- 4.3.4. Dogs (Low Growth, Low Market Share)
- 4.4. Ansoff Matrix Analysis
- 4.5. Supply Chain Analysis
- 4.6. Regulatory Landscape
- 4.7. Current Market Potential and Opportunity Assessment (TAM–SAM–SOM Framework)
- 4.8. TIR Analyst Note
- 4.1. Porters Five Forces
- 5. Market Analysis, Insights and Forecast 2021-2033
- 5.1. Market Analysis, Insights and Forecast - by Type
- 5.1.1. Liquid Crystal Display (LCD)
- 5.1.1.1. TFT LCD
- 5.1.1.2. IPS LCD
- 5.1.2. Organic Light-Emitting Diode (OLED)
- 5.1.3. Active-Matrix Organic Light- Emitting Diode (AMOLED)
- 5.1.4. Others
- 5.1.1. Liquid Crystal Display (LCD)
- 5.2. Market Analysis, Insights and Forecast - by Form Factor
- 5.2.1. Flat (Rigid)
- 5.2.2. Curved Edge
- 5.2.3. Foldable
- 5.2.4. Rollable/Slidable
- 5.3. Market Analysis, Insights and Forecast - by Resolution
- 5.3.1. HD
- 5.3.2. FHD
- 5.3.3. QHD
- 5.3.4. Others
- 5.4. Market Analysis, Insights and Forecast - by Size
- 5.4.1. Compact
- 5.4.2. Standard
- 5.4.3. Large
- 5.5. Market Analysis, Insights and Forecast - by Price Range
- 5.5.1. Premium
- 5.5.2. Mid-Range
- 5.5.3. Economy
- 5.6. Market Analysis, Insights and Forecast - by Sales Channel
- 5.6.1. OEM
- 5.6.2. Aftermarket
- 5.7. Market Analysis, Insights and Forecast - by Region
- 5.7.1. North America
- 5.7.2. South America
- 5.7.3. Europe
- 5.7.4. Middle East & Africa
- 5.7.5. Asia Pacific
- 5.1. Market Analysis, Insights and Forecast - by Type
- 6. Global Smartphone Display Analysis, Insights and Forecast, 2021-2033
- 6.1. Market Analysis, Insights and Forecast - by Type
- 6.1.1. Liquid Crystal Display (LCD)
- 6.1.1.1. TFT LCD
- 6.1.1.2. IPS LCD
- 6.1.2. Organic Light-Emitting Diode (OLED)
- 6.1.3. Active-Matrix Organic Light- Emitting Diode (AMOLED)
- 6.1.4. Others
- 6.1.1. Liquid Crystal Display (LCD)
- 6.2. Market Analysis, Insights and Forecast - by Form Factor
- 6.2.1. Flat (Rigid)
- 6.2.2. Curved Edge
- 6.2.3. Foldable
- 6.2.4. Rollable/Slidable
- 6.3. Market Analysis, Insights and Forecast - by Resolution
- 6.3.1. HD
- 6.3.2. FHD
- 6.3.3. QHD
- 6.3.4. Others
- 6.4. Market Analysis, Insights and Forecast - by Size
- 6.4.1. Compact
- 6.4.2. Standard
- 6.4.3. Large
- 6.5. Market Analysis, Insights and Forecast - by Price Range
- 6.5.1. Premium
- 6.5.2. Mid-Range
- 6.5.3. Economy
- 6.6. Market Analysis, Insights and Forecast - by Sales Channel
- 6.6.1. OEM
- 6.6.2. Aftermarket
- 6.1. Market Analysis, Insights and Forecast - by Type
- 7. North America Smartphone Display Analysis, Insights and Forecast, 2020-2032
- 7.1. Market Analysis, Insights and Forecast - by Type
- 7.1.1. Liquid Crystal Display (LCD)
- 7.1.1.1. TFT LCD
- 7.1.1.2. IPS LCD
- 7.1.2. Organic Light-Emitting Diode (OLED)
- 7.1.3. Active-Matrix Organic Light- Emitting Diode (AMOLED)
- 7.1.4. Others
- 7.1.1. Liquid Crystal Display (LCD)
- 7.2. Market Analysis, Insights and Forecast - by Form Factor
- 7.2.1. Flat (Rigid)
- 7.2.2. Curved Edge
- 7.2.3. Foldable
- 7.2.4. Rollable/Slidable
- 7.3. Market Analysis, Insights and Forecast - by Resolution
- 7.3.1. HD
- 7.3.2. FHD
- 7.3.3. QHD
- 7.3.4. Others
- 7.4. Market Analysis, Insights and Forecast - by Size
- 7.4.1. Compact
- 7.4.2. Standard
- 7.4.3. Large
- 7.5. Market Analysis, Insights and Forecast - by Price Range
- 7.5.1. Premium
- 7.5.2. Mid-Range
- 7.5.3. Economy
- 7.6. Market Analysis, Insights and Forecast - by Sales Channel
- 7.6.1. OEM
- 7.6.2. Aftermarket
- 7.1. Market Analysis, Insights and Forecast - by Type
- 8. South America Smartphone Display Analysis, Insights and Forecast, 2020-2032
- 8.1. Market Analysis, Insights and Forecast - by Type
- 8.1.1. Liquid Crystal Display (LCD)
- 8.1.1.1. TFT LCD
- 8.1.1.2. IPS LCD
- 8.1.2. Organic Light-Emitting Diode (OLED)
- 8.1.3. Active-Matrix Organic Light- Emitting Diode (AMOLED)
- 8.1.4. Others
- 8.1.1. Liquid Crystal Display (LCD)
- 8.2. Market Analysis, Insights and Forecast - by Form Factor
- 8.2.1. Flat (Rigid)
- 8.2.2. Curved Edge
- 8.2.3. Foldable
- 8.2.4. Rollable/Slidable
- 8.3. Market Analysis, Insights and Forecast - by Resolution
- 8.3.1. HD
- 8.3.2. FHD
- 8.3.3. QHD
- 8.3.4. Others
- 8.4. Market Analysis, Insights and Forecast - by Size
- 8.4.1. Compact
- 8.4.2. Standard
- 8.4.3. Large
- 8.5. Market Analysis, Insights and Forecast - by Price Range
- 8.5.1. Premium
- 8.5.2. Mid-Range
- 8.5.3. Economy
- 8.6. Market Analysis, Insights and Forecast - by Sales Channel
- 8.6.1. OEM
- 8.6.2. Aftermarket
- 8.1. Market Analysis, Insights and Forecast - by Type
- 9. Europe Smartphone Display Analysis, Insights and Forecast, 2020-2032
- 9.1. Market Analysis, Insights and Forecast - by Type
- 9.1.1. Liquid Crystal Display (LCD)
- 9.1.1.1. TFT LCD
- 9.1.1.2. IPS LCD
- 9.1.2. Organic Light-Emitting Diode (OLED)
- 9.1.3. Active-Matrix Organic Light- Emitting Diode (AMOLED)
- 9.1.4. Others
- 9.1.1. Liquid Crystal Display (LCD)
- 9.2. Market Analysis, Insights and Forecast - by Form Factor
- 9.2.1. Flat (Rigid)
- 9.2.2. Curved Edge
- 9.2.3. Foldable
- 9.2.4. Rollable/Slidable
- 9.3. Market Analysis, Insights and Forecast - by Resolution
- 9.3.1. HD
- 9.3.2. FHD
- 9.3.3. QHD
- 9.3.4. Others
- 9.4. Market Analysis, Insights and Forecast - by Size
- 9.4.1. Compact
- 9.4.2. Standard
- 9.4.3. Large
- 9.5. Market Analysis, Insights and Forecast - by Price Range
- 9.5.1. Premium
- 9.5.2. Mid-Range
- 9.5.3. Economy
- 9.6. Market Analysis, Insights and Forecast - by Sales Channel
- 9.6.1. OEM
- 9.6.2. Aftermarket
- 9.1. Market Analysis, Insights and Forecast - by Type
- 10. Middle East & Africa Smartphone Display Analysis, Insights and Forecast, 2020-2032
- 10.1. Market Analysis, Insights and Forecast - by Type
- 10.1.1. Liquid Crystal Display (LCD)
- 10.1.1.1. TFT LCD
- 10.1.1.2. IPS LCD
- 10.1.2. Organic Light-Emitting Diode (OLED)
- 10.1.3. Active-Matrix Organic Light- Emitting Diode (AMOLED)
- 10.1.4. Others
- 10.1.1. Liquid Crystal Display (LCD)
- 10.2. Market Analysis, Insights and Forecast - by Form Factor
- 10.2.1. Flat (Rigid)
- 10.2.2. Curved Edge
- 10.2.3. Foldable
- 10.2.4. Rollable/Slidable
- 10.3. Market Analysis, Insights and Forecast - by Resolution
- 10.3.1. HD
- 10.3.2. FHD
- 10.3.3. QHD
- 10.3.4. Others
- 10.4. Market Analysis, Insights and Forecast - by Size
- 10.4.1. Compact
- 10.4.2. Standard
- 10.4.3. Large
- 10.5. Market Analysis, Insights and Forecast - by Price Range
- 10.5.1. Premium
- 10.5.2. Mid-Range
- 10.5.3. Economy
- 10.6. Market Analysis, Insights and Forecast - by Sales Channel
- 10.6.1. OEM
- 10.6.2. Aftermarket
- 10.1. Market Analysis, Insights and Forecast - by Type
- 11. Asia Pacific Smartphone Display Analysis, Insights and Forecast, 2020-2032
- 11.1. Market Analysis, Insights and Forecast - by Type
- 11.1.1. Liquid Crystal Display (LCD)
- 11.1.1.1. TFT LCD
- 11.1.1.2. IPS LCD
- 11.1.2. Organic Light-Emitting Diode (OLED)
- 11.1.3. Active-Matrix Organic Light- Emitting Diode (AMOLED)
- 11.1.4. Others
- 11.1.1. Liquid Crystal Display (LCD)
- 11.2. Market Analysis, Insights and Forecast - by Form Factor
- 11.2.1. Flat (Rigid)
- 11.2.2. Curved Edge
- 11.2.3. Foldable
- 11.2.4. Rollable/Slidable
- 11.3. Market Analysis, Insights and Forecast - by Resolution
- 11.3.1. HD
- 11.3.2. FHD
- 11.3.3. QHD
- 11.3.4. Others
- 11.4. Market Analysis, Insights and Forecast - by Size
- 11.4.1. Compact
- 11.4.2. Standard
- 11.4.3. Large
- 11.5. Market Analysis, Insights and Forecast - by Price Range
- 11.5.1. Premium
- 11.5.2. Mid-Range
- 11.5.3. Economy
- 11.6. Market Analysis, Insights and Forecast - by Sales Channel
- 11.6.1. OEM
- 11.6.2. Aftermarket
- 11.1. Market Analysis, Insights and Forecast - by Type
- 12. Competitive Analysis
- 12.1. Company Profiles
- 12.1.1 SAMSUNG
- 12.1.1.1. Company Overview
- 12.1.1.2. Products
- 12.1.1.3. Company Financials
- 12.1.1.4. SWOT Analysis
- 12.1.2 Japan Display Inc.
- 12.1.2.1. Company Overview
- 12.1.2.2. Products
- 12.1.2.3. Company Financials
- 12.1.2.4. SWOT Analysis
- 12.1.3 Toshiba Corporation
- 12.1.3.1. Company Overview
- 12.1.3.2. Products
- 12.1.3.3. Company Financials
- 12.1.3.4. SWOT Analysis
- 12.1.4 LG Electronics Inc.
- 12.1.4.1. Company Overview
- 12.1.4.2. Products
- 12.1.4.3. Company Financials
- 12.1.4.4. SWOT Analysis
- 12.1.5 Sharp Corporation
- 12.1.5.1. Company Overview
- 12.1.5.2. Products
- 12.1.5.3. Company Financials
- 12.1.5.4. SWOT Analysis
- 12.1.6 BOE
- 12.1.6.1. Company Overview
- 12.1.6.2. Products
- 12.1.6.3. Company Financials
- 12.1.6.4. SWOT Analysis
- 12.1.7 Fujitsu Ltd.
- 12.1.7.1. Company Overview
- 12.1.7.2. Products
- 12.1.7.3. Company Financials
- 12.1.7.4. SWOT Analysis
- 12.1.8 Sony Corporation
- 12.1.8.1. Company Overview
- 12.1.8.2. Products
- 12.1.8.3. Company Financials
- 12.1.8.4. SWOT Analysis
- 12.1.9 Apple Inc.
- 12.1.9.1. Company Overview
- 12.1.9.2. Products
- 12.1.9.3. Company Financials
- 12.1.9.4. SWOT Analysis
- 12.1.10 Motorola Inc
- 12.1.10.1. Company Overview
- 12.1.10.2. Products
- 12.1.10.3. Company Financials
- 12.1.10.4. SWOT Analysis
- 12.1.11 Mitsubishi Electric Corporation
- 12.1.11.1. Company Overview
- 12.1.11.2. Products
- 12.1.11.3. Company Financials
- 12.1.11.4. SWOT Analysis
- 12.1.12 Innolux Corporation
- 12.1.12.1. Company Overview
- 12.1.12.2. Products
- 12.1.12.3. Company Financials
- 12.1.12.4. SWOT Analysis
- 12.1.13 AUO
- 12.1.13.1. Company Overview
- 12.1.13.2. Products
- 12.1.13.3. Company Financials
- 12.1.13.4. SWOT Analysis
- 12.1.14 Others
- 12.1.14.1. Company Overview
- 12.1.14.2. Products
- 12.1.14.3. Company Financials
- 12.1.14.4. SWOT Analysis
- 12.1.1 SAMSUNG
- 12.2. Market Entropy
- 12.2.1 Company's Key Areas Served
- 12.2.2 Recent Developments
- 12.3. Company Market Share Analysis 2025
- 12.3.1 Top 5 Companies Market Share Analysis
- 12.3.2 Top 3 Companies Market Share Analysis
- 12.4. List of Potential Customers
- 13. Research Methodology
List of Figures
- Figure 1: Global Smartphone Display Revenue Breakdown (billion, %) by Region 2025 & 2033
- Figure 2: North America Smartphone Display Revenue (billion), by Type 2025 & 2033
- Figure 3: North America Smartphone Display Revenue Share (%), by Type 2025 & 2033
- Figure 4: North America Smartphone Display Revenue (billion), by Form Factor 2025 & 2033
- Figure 5: North America Smartphone Display Revenue Share (%), by Form Factor 2025 & 2033
- Figure 6: North America Smartphone Display Revenue (billion), by Resolution 2025 & 2033
- Figure 7: North America Smartphone Display Revenue Share (%), by Resolution 2025 & 2033
- Figure 8: North America Smartphone Display Revenue (billion), by Size 2025 & 2033
- Figure 9: North America Smartphone Display Revenue Share (%), by Size 2025 & 2033
- Figure 10: North America Smartphone Display Revenue (billion), by Price Range 2025 & 2033
- Figure 11: North America Smartphone Display Revenue Share (%), by Price Range 2025 & 2033
- Figure 12: North America Smartphone Display Revenue (billion), by Sales Channel 2025 & 2033
- Figure 13: North America Smartphone Display Revenue Share (%), by Sales Channel 2025 & 2033
- Figure 14: North America Smartphone Display Revenue (billion), by Country 2025 & 2033
- Figure 15: North America Smartphone Display Revenue Share (%), by Country 2025 & 2033
- Figure 16: South America Smartphone Display Revenue (billion), by Type 2025 & 2033
- Figure 17: South America Smartphone Display Revenue Share (%), by Type 2025 & 2033
- Figure 18: South America Smartphone Display Revenue (billion), by Form Factor 2025 & 2033
- Figure 19: South America Smartphone Display Revenue Share (%), by Form Factor 2025 & 2033
- Figure 20: South America Smartphone Display Revenue (billion), by Resolution 2025 & 2033
- Figure 21: South America Smartphone Display Revenue Share (%), by Resolution 2025 & 2033
- Figure 22: South America Smartphone Display Revenue (billion), by Size 2025 & 2033
- Figure 23: South America Smartphone Display Revenue Share (%), by Size 2025 & 2033
- Figure 24: South America Smartphone Display Revenue (billion), by Price Range 2025 & 2033
- Figure 25: South America Smartphone Display Revenue Share (%), by Price Range 2025 & 2033
- Figure 26: South America Smartphone Display Revenue (billion), by Sales Channel 2025 & 2033
- Figure 27: South America Smartphone Display Revenue Share (%), by Sales Channel 2025 & 2033
- Figure 28: South America Smartphone Display Revenue (billion), by Country 2025 & 2033
- Figure 29: South America Smartphone Display Revenue Share (%), by Country 2025 & 2033
- Figure 30: Europe Smartphone Display Revenue (billion), by Type 2025 & 2033
- Figure 31: Europe Smartphone Display Revenue Share (%), by Type 2025 & 2033
- Figure 32: Europe Smartphone Display Revenue (billion), by Form Factor 2025 & 2033
- Figure 33: Europe Smartphone Display Revenue Share (%), by Form Factor 2025 & 2033
- Figure 34: Europe Smartphone Display Revenue (billion), by Resolution 2025 & 2033
- Figure 35: Europe Smartphone Display Revenue Share (%), by Resolution 2025 & 2033
- Figure 36: Europe Smartphone Display Revenue (billion), by Size 2025 & 2033
- Figure 37: Europe Smartphone Display Revenue Share (%), by Size 2025 & 2033
- Figure 38: Europe Smartphone Display Revenue (billion), by Price Range 2025 & 2033
- Figure 39: Europe Smartphone Display Revenue Share (%), by Price Range 2025 & 2033
- Figure 40: Europe Smartphone Display Revenue (billion), by Sales Channel 2025 & 2033
- Figure 41: Europe Smartphone Display Revenue Share (%), by Sales Channel 2025 & 2033
- Figure 42: Europe Smartphone Display Revenue (billion), by Country 2025 & 2033
- Figure 43: Europe Smartphone Display Revenue Share (%), by Country 2025 & 2033
- Figure 44: Middle East & Africa Smartphone Display Revenue (billion), by Type 2025 & 2033
- Figure 45: Middle East & Africa Smartphone Display Revenue Share (%), by Type 2025 & 2033
- Figure 46: Middle East & Africa Smartphone Display Revenue (billion), by Form Factor 2025 & 2033
- Figure 47: Middle East & Africa Smartphone Display Revenue Share (%), by Form Factor 2025 & 2033
- Figure 48: Middle East & Africa Smartphone Display Revenue (billion), by Resolution 2025 & 2033
- Figure 49: Middle East & Africa Smartphone Display Revenue Share (%), by Resolution 2025 & 2033
- Figure 50: Middle East & Africa Smartphone Display Revenue (billion), by Size 2025 & 2033
- Figure 51: Middle East & Africa Smartphone Display Revenue Share (%), by Size 2025 & 2033
- Figure 52: Middle East & Africa Smartphone Display Revenue (billion), by Price Range 2025 & 2033
- Figure 53: Middle East & Africa Smartphone Display Revenue Share (%), by Price Range 2025 & 2033
- Figure 54: Middle East & Africa Smartphone Display Revenue (billion), by Sales Channel 2025 & 2033
- Figure 55: Middle East & Africa Smartphone Display Revenue Share (%), by Sales Channel 2025 & 2033
- Figure 56: Middle East & Africa Smartphone Display Revenue (billion), by Country 2025 & 2033
- Figure 57: Middle East & Africa Smartphone Display Revenue Share (%), by Country 2025 & 2033
- Figure 58: Asia Pacific Smartphone Display Revenue (billion), by Type 2025 & 2033
- Figure 59: Asia Pacific Smartphone Display Revenue Share (%), by Type 2025 & 2033
- Figure 60: Asia Pacific Smartphone Display Revenue (billion), by Form Factor 2025 & 2033
- Figure 61: Asia Pacific Smartphone Display Revenue Share (%), by Form Factor 2025 & 2033
- Figure 62: Asia Pacific Smartphone Display Revenue (billion), by Resolution 2025 & 2033
- Figure 63: Asia Pacific Smartphone Display Revenue Share (%), by Resolution 2025 & 2033
- Figure 64: Asia Pacific Smartphone Display Revenue (billion), by Size 2025 & 2033
- Figure 65: Asia Pacific Smartphone Display Revenue Share (%), by Size 2025 & 2033
- Figure 66: Asia Pacific Smartphone Display Revenue (billion), by Price Range 2025 & 2033
- Figure 67: Asia Pacific Smartphone Display Revenue Share (%), by Price Range 2025 & 2033
- Figure 68: Asia Pacific Smartphone Display Revenue (billion), by Sales Channel 2025 & 2033
- Figure 69: Asia Pacific Smartphone Display Revenue Share (%), by Sales Channel 2025 & 2033
- Figure 70: Asia Pacific Smartphone Display Revenue (billion), by Country 2025 & 2033
- Figure 71: Asia Pacific Smartphone Display Revenue Share (%), by Country 2025 & 2033
List of Tables
- Table 1: Global Smartphone Display Revenue billion Forecast, by Type 2020 & 2033
- Table 2: Global Smartphone Display Revenue billion Forecast, by Form Factor 2020 & 2033
- Table 3: Global Smartphone Display Revenue billion Forecast, by Resolution 2020 & 2033
- Table 4: Global Smartphone Display Revenue billion Forecast, by Size 2020 & 2033
- Table 5: Global Smartphone Display Revenue billion Forecast, by Price Range 2020 & 2033
- Table 6: Global Smartphone Display Revenue billion Forecast, by Sales Channel 2020 & 2033
- Table 7: Global Smartphone Display Revenue billion Forecast, by Region 2020 & 2033
- Table 8: Global Smartphone Display Revenue billion Forecast, by Type 2020 & 2033
- Table 9: Global Smartphone Display Revenue billion Forecast, by Form Factor 2020 & 2033
- Table 10: Global Smartphone Display Revenue billion Forecast, by Resolution 2020 & 2033
- Table 11: Global Smartphone Display Revenue billion Forecast, by Size 2020 & 2033
- Table 12: Global Smartphone Display Revenue billion Forecast, by Price Range 2020 & 2033
- Table 13: Global Smartphone Display Revenue billion Forecast, by Sales Channel 2020 & 2033
- Table 14: Global Smartphone Display Revenue billion Forecast, by Country 2020 & 2033
- Table 15: United States Smartphone Display Revenue (billion) Forecast, by Application 2020 & 2033
- Table 16: Canada Smartphone Display Revenue (billion) Forecast, by Application 2020 & 2033
- Table 17: Mexico Smartphone Display Revenue (billion) Forecast, by Application 2020 & 2033
- Table 18: Global Smartphone Display Revenue billion Forecast, by Type 2020 & 2033
- Table 19: Global Smartphone Display Revenue billion Forecast, by Form Factor 2020 & 2033
- Table 20: Global Smartphone Display Revenue billion Forecast, by Resolution 2020 & 2033
- Table 21: Global Smartphone Display Revenue billion Forecast, by Size 2020 & 2033
- Table 22: Global Smartphone Display Revenue billion Forecast, by Price Range 2020 & 2033
- Table 23: Global Smartphone Display Revenue billion Forecast, by Sales Channel 2020 & 2033
- Table 24: Global Smartphone Display Revenue billion Forecast, by Country 2020 & 2033
- Table 25: Brazil Smartphone Display Revenue (billion) Forecast, by Application 2020 & 2033
- Table 26: Argentina Smartphone Display Revenue (billion) Forecast, by Application 2020 & 2033
- Table 27: Rest of South America Smartphone Display Revenue (billion) Forecast, by Application 2020 & 2033
- Table 28: Global Smartphone Display Revenue billion Forecast, by Type 2020 & 2033
- Table 29: Global Smartphone Display Revenue billion Forecast, by Form Factor 2020 & 2033
- Table 30: Global Smartphone Display Revenue billion Forecast, by Resolution 2020 & 2033
- Table 31: Global Smartphone Display Revenue billion Forecast, by Size 2020 & 2033
- Table 32: Global Smartphone Display Revenue billion Forecast, by Price Range 2020 & 2033
- Table 33: Global Smartphone Display Revenue billion Forecast, by Sales Channel 2020 & 2033
- Table 34: Global Smartphone Display Revenue billion Forecast, by Country 2020 & 2033
- Table 35: United Kingdom Smartphone Display Revenue (billion) Forecast, by Application 2020 & 2033
- Table 36: Germany Smartphone Display Revenue (billion) Forecast, by Application 2020 & 2033
- Table 37: France Smartphone Display Revenue (billion) Forecast, by Application 2020 & 2033
- Table 38: Italy Smartphone Display Revenue (billion) Forecast, by Application 2020 & 2033
- Table 39: Spain Smartphone Display Revenue (billion) Forecast, by Application 2020 & 2033
- Table 40: Russia Smartphone Display Revenue (billion) Forecast, by Application 2020 & 2033
- Table 41: Benelux Smartphone Display Revenue (billion) Forecast, by Application 2020 & 2033
- Table 42: Nordics Smartphone Display Revenue (billion) Forecast, by Application 2020 & 2033
- Table 43: Rest of Europe Smartphone Display Revenue (billion) Forecast, by Application 2020 & 2033
- Table 44: Global Smartphone Display Revenue billion Forecast, by Type 2020 & 2033
- Table 45: Global Smartphone Display Revenue billion Forecast, by Form Factor 2020 & 2033
- Table 46: Global Smartphone Display Revenue billion Forecast, by Resolution 2020 & 2033
- Table 47: Global Smartphone Display Revenue billion Forecast, by Size 2020 & 2033
- Table 48: Global Smartphone Display Revenue billion Forecast, by Price Range 2020 & 2033
- Table 49: Global Smartphone Display Revenue billion Forecast, by Sales Channel 2020 & 2033
- Table 50: Global Smartphone Display Revenue billion Forecast, by Country 2020 & 2033
- Table 51: Turkey Smartphone Display Revenue (billion) Forecast, by Application 2020 & 2033
- Table 52: Israel Smartphone Display Revenue (billion) Forecast, by Application 2020 & 2033
- Table 53: GCC Smartphone Display Revenue (billion) Forecast, by Application 2020 & 2033
- Table 54: North Africa Smartphone Display Revenue (billion) Forecast, by Application 2020 & 2033
- Table 55: South Africa Smartphone Display Revenue (billion) Forecast, by Application 2020 & 2033
- Table 56: Rest of Middle East & Africa Smartphone Display Revenue (billion) Forecast, by Application 2020 & 2033
- Table 57: Global Smartphone Display Revenue billion Forecast, by Type 2020 & 2033
- Table 58: Global Smartphone Display Revenue billion Forecast, by Form Factor 2020 & 2033
- Table 59: Global Smartphone Display Revenue billion Forecast, by Resolution 2020 & 2033
- Table 60: Global Smartphone Display Revenue billion Forecast, by Size 2020 & 2033
- Table 61: Global Smartphone Display Revenue billion Forecast, by Price Range 2020 & 2033
- Table 62: Global Smartphone Display Revenue billion Forecast, by Sales Channel 2020 & 2033
- Table 63: Global Smartphone Display Revenue billion Forecast, by Country 2020 & 2033
- Table 64: China Smartphone Display Revenue (billion) Forecast, by Application 2020 & 2033
- Table 65: India Smartphone Display Revenue (billion) Forecast, by Application 2020 & 2033
- Table 66: Japan Smartphone Display Revenue (billion) Forecast, by Application 2020 & 2033
- Table 67: South Korea Smartphone Display Revenue (billion) Forecast, by Application 2020 & 2033
- Table 68: ASEAN Smartphone Display Revenue (billion) Forecast, by Application 2020 & 2033
- Table 69: Oceania Smartphone Display Revenue (billion) Forecast, by Application 2020 & 2033
- Table 70: Rest of Asia Pacific Smartphone Display Revenue (billion) Forecast, by Application 2020 & 2033
Frequently Asked Questions
1. What is the projected Compound Annual Growth Rate (CAGR) of the Smartphone Display?
The projected CAGR is approximately 5%.
2. Which companies are prominent players in the Smartphone Display?
Key companies in the market include SAMSUNG, Japan Display Inc., Toshiba Corporation, LG Electronics Inc., Sharp Corporation, BOE, Fujitsu Ltd., Sony Corporation, Apple Inc.,, Motorola Inc, Mitsubishi Electric Corporation, Innolux Corporation, AUO, Others.
3. What are the main segments of the Smartphone Display?
The market segments include Type, Form Factor, Resolution, Size, Price Range, Sales Channel.
4. Can you provide details about the market size?
The market size is estimated to be USD 141.36 billion as of 2022.
5. What are some drivers contributing to market growth?
N/A
6. What are the notable trends driving market growth?
N/A
7. Are there any restraints impacting market growth?
N/A
8. Can you provide examples of recent developments in the market?
N/A
9. What pricing options are available for accessing the report?
Pricing options include single-user, multi-user, and enterprise licenses priced at USD 4250.00, USD 6375.00, and USD 8500.00 respectively.
10. Is the market size provided in terms of value or volume?
The market size is provided in terms of value, measured in billion.
11. Are there any specific market keywords associated with the report?
Yes, the market keyword associated with the report is "Smartphone Display," which aids in identifying and referencing the specific market segment covered.
12. How do I determine which pricing option suits my needs best?
The pricing options vary based on user requirements and access needs. Individual users may opt for single-user licenses, while businesses requiring broader access may choose multi-user or enterprise licenses for cost-effective access to the report.
13. Are there any additional resources or data provided in the Smartphone Display report?
While the report offers comprehensive insights, it's advisable to review the specific contents or supplementary materials provided to ascertain if additional resources or data are available.
14. How can I stay updated on further developments or reports in the Smartphone Display?
To stay informed about further developments, trends, and reports in the Smartphone Display, consider subscribing to industry newsletters, following relevant companies and organizations, or regularly checking reputable industry news sources and publications.
Methodology
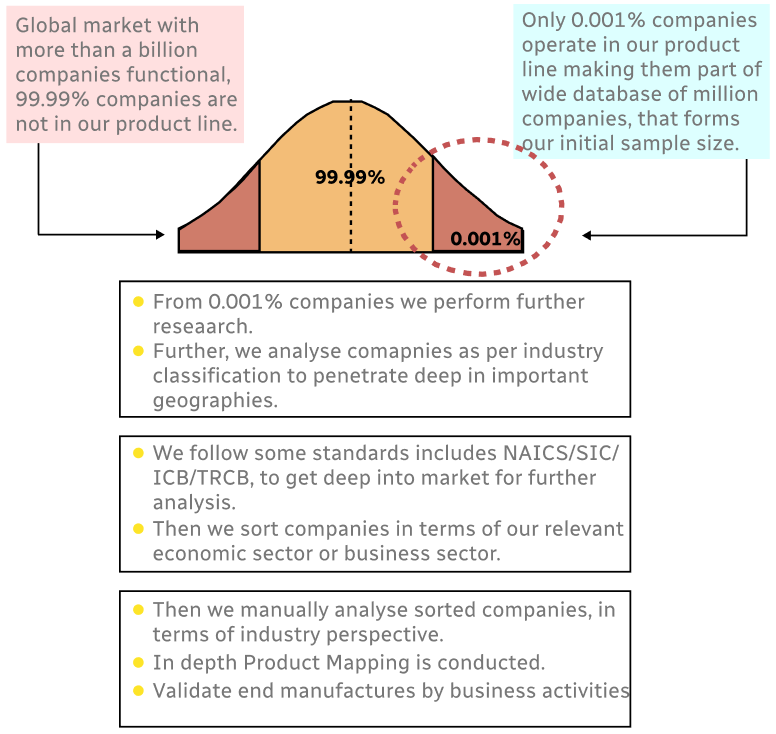
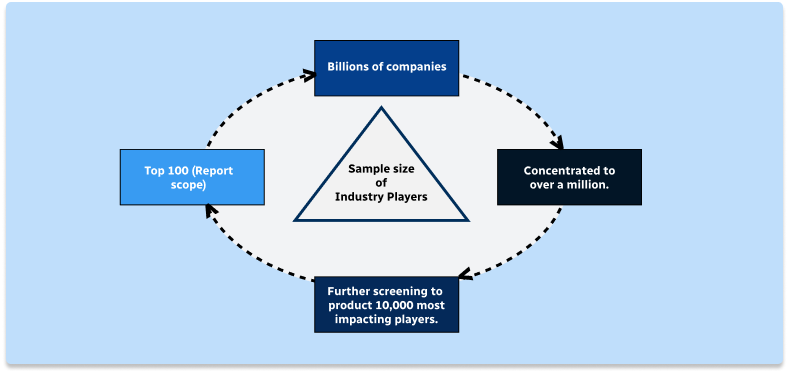
Step 1 - Identification of Relevant Samples Size from Population Database
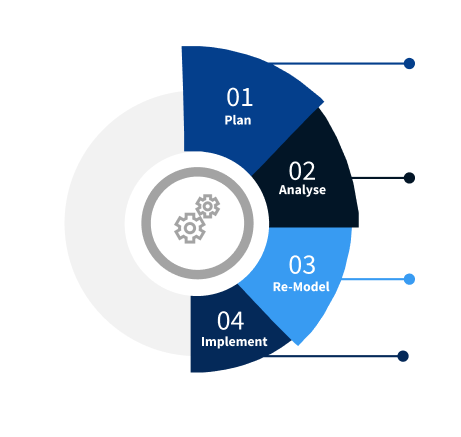
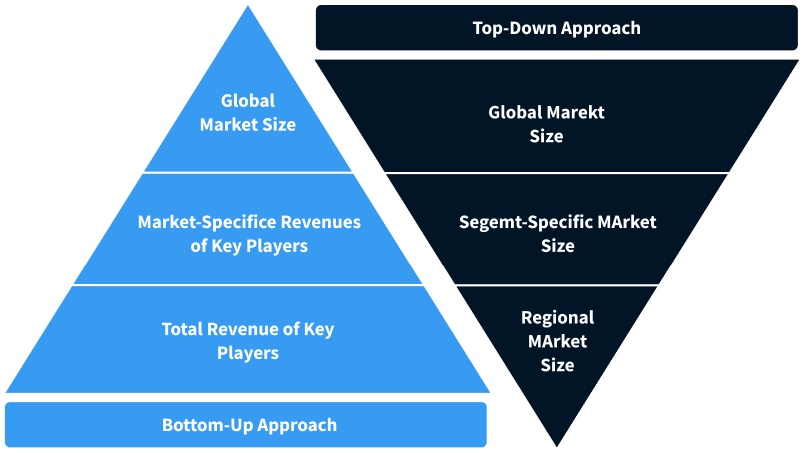
Step 2 - Approaches for Defining Global Market Size (Value, Volume* & Price*)
Note*: In applicable scenarios
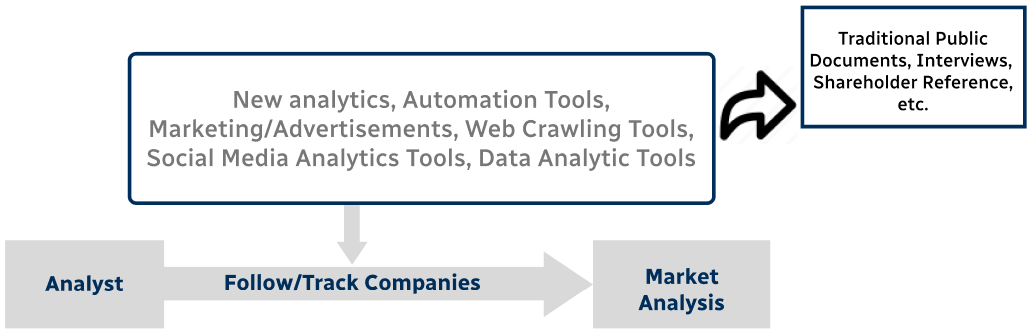
Step 3 - Data Sources
Primary Research
- Web Analytics
- Survey Reports
- Research Institute
- Latest Research Reports
- Opinion Leaders
Secondary Research
- Annual Reports
- White Paper
- Latest Press Release
- Industry Association
- Paid Database
- Investor Presentations
Step 4 - Data Triangulation
Involves using different sources of information in order to increase the validity of a study
These sources are likely to be stakeholders in a program - participants, other researchers, program staff, other community members, and so on.
Then we put all data in single framework & apply various statistical tools to find out the dynamic on the market.
During the analysis stage, feedback from the stakeholder groups would be compared to determine areas of agreement as well as areas of divergence