


Key Insights for Smartphone Sensors Market
The Global Smartphone Sensors Market was valued at an estimated $15.98 billion in 2025, demonstrating robust growth driven by continuous innovation in mobile technology and an escalating consumer demand for advanced functionalities. Projections indicate a consistent expansion, with the market expected to reach approximately $24.40 billion by 2033, advancing at a Compound Annual Growth Rate (CAGR) of 5.44% from 2025 to 2033. This substantial growth trajectory is underpinned by several key demand drivers, including the proliferation of multi-camera setups, the integration of sophisticated biometric security features, and the expanding ecosystem of augmented reality (AR) applications within smartphones.
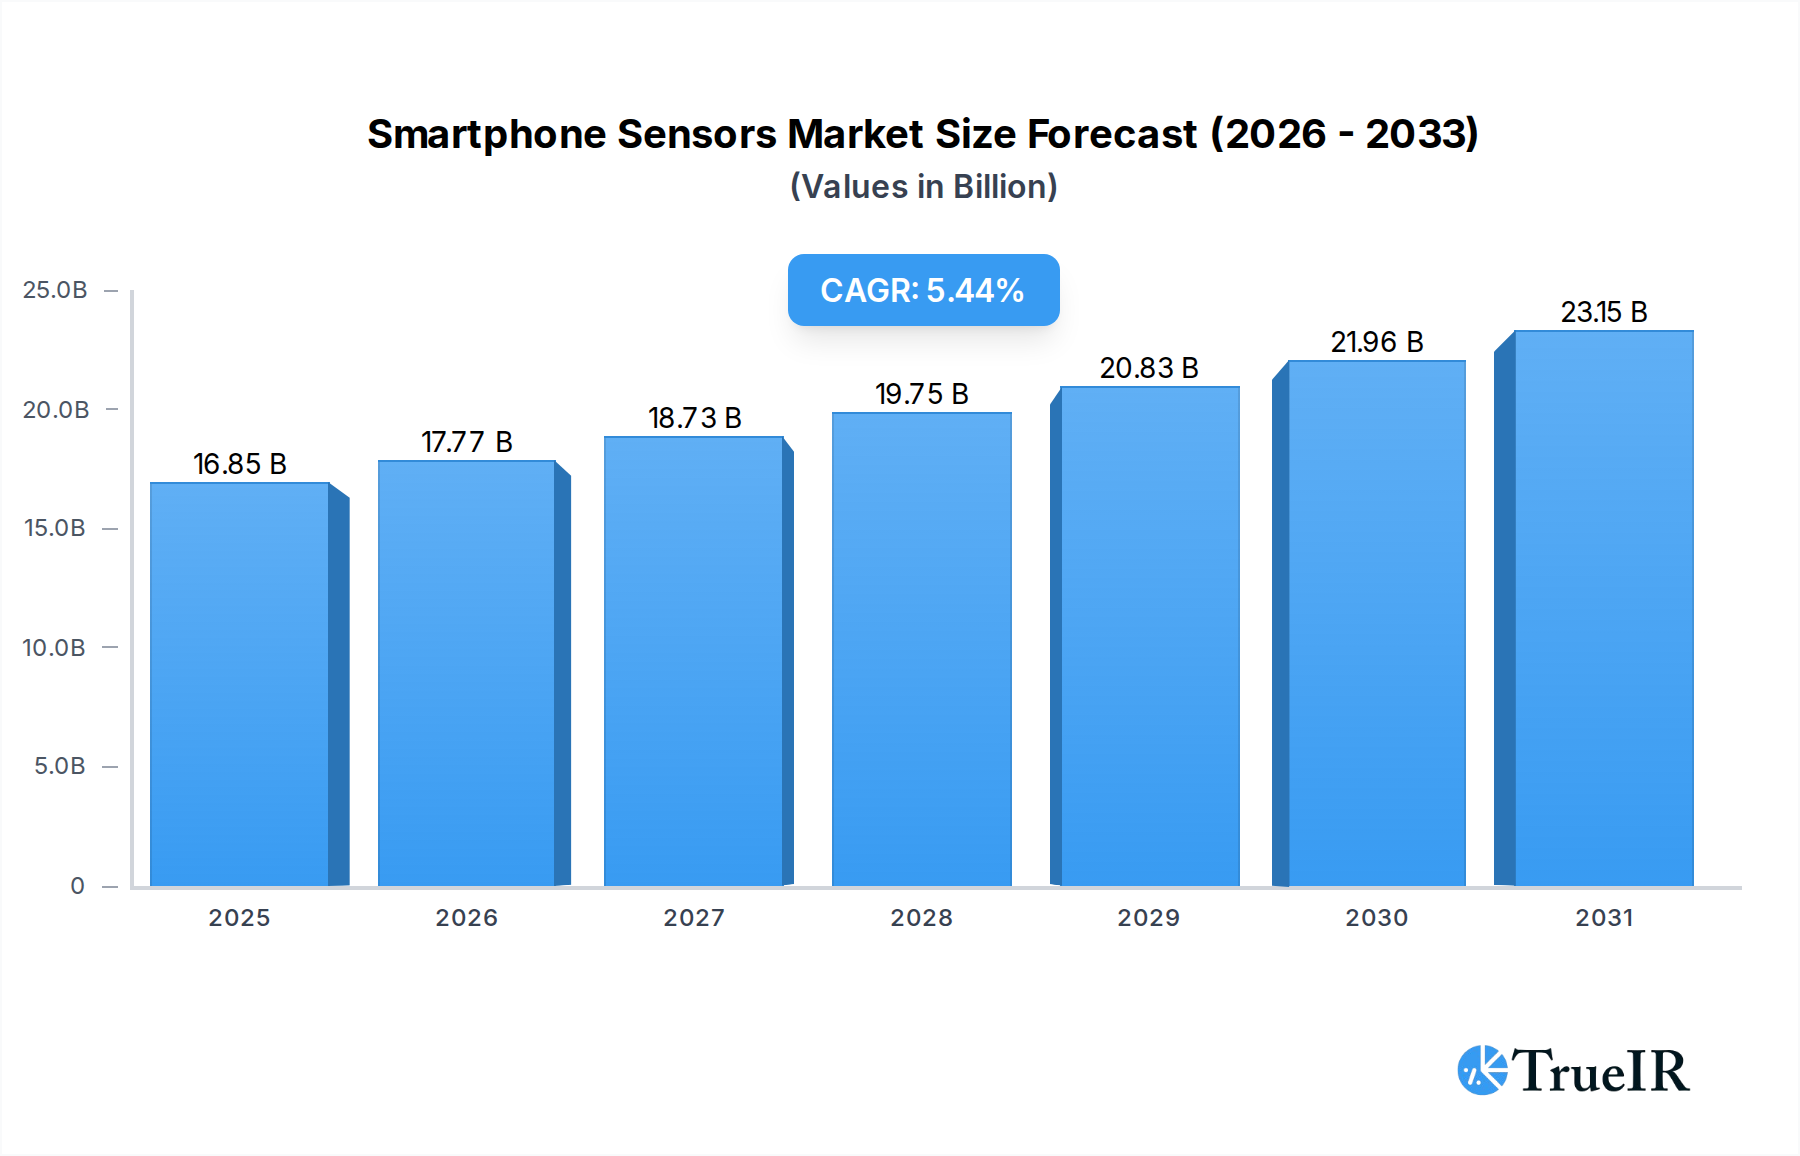
Smartphone Sensors Market Size (In Billion)

Macro tailwinds such as the global rollout of 5G networks are significantly enhancing data processing capabilities, enabling more complex sensor applications, and fostering the development of new user experiences. The increasing adoption of smartphones in emerging economies, coupled with a growing inclination towards premium and mid-range devices equipped with advanced sensor arrays, further contributes to market expansion. Furthermore, the rising integration of AI and machine learning algorithms directly on sensor data facilitates smarter, more context-aware applications, from enhanced photography to personalized health monitoring. The demand for higher precision and greater miniaturization in sensors also drives investment into research and development, particularly within the Semiconductor Components Market, which forms the bedrock of sensor manufacturing. The evolving landscape of the Consumer Electronics Market, particularly in the smartphone segment, consistently pushes manufacturers to embed more diverse and capable sensors, transforming devices from mere communication tools into powerful personal assistants and entertainment hubs. As the market matures, the focus will increasingly shift towards energy efficiency, seamless integration, and the ability of sensors to deliver unique and indispensable user experiences, thereby sustaining long-term growth and innovation in the Smartphone Sensors Market.
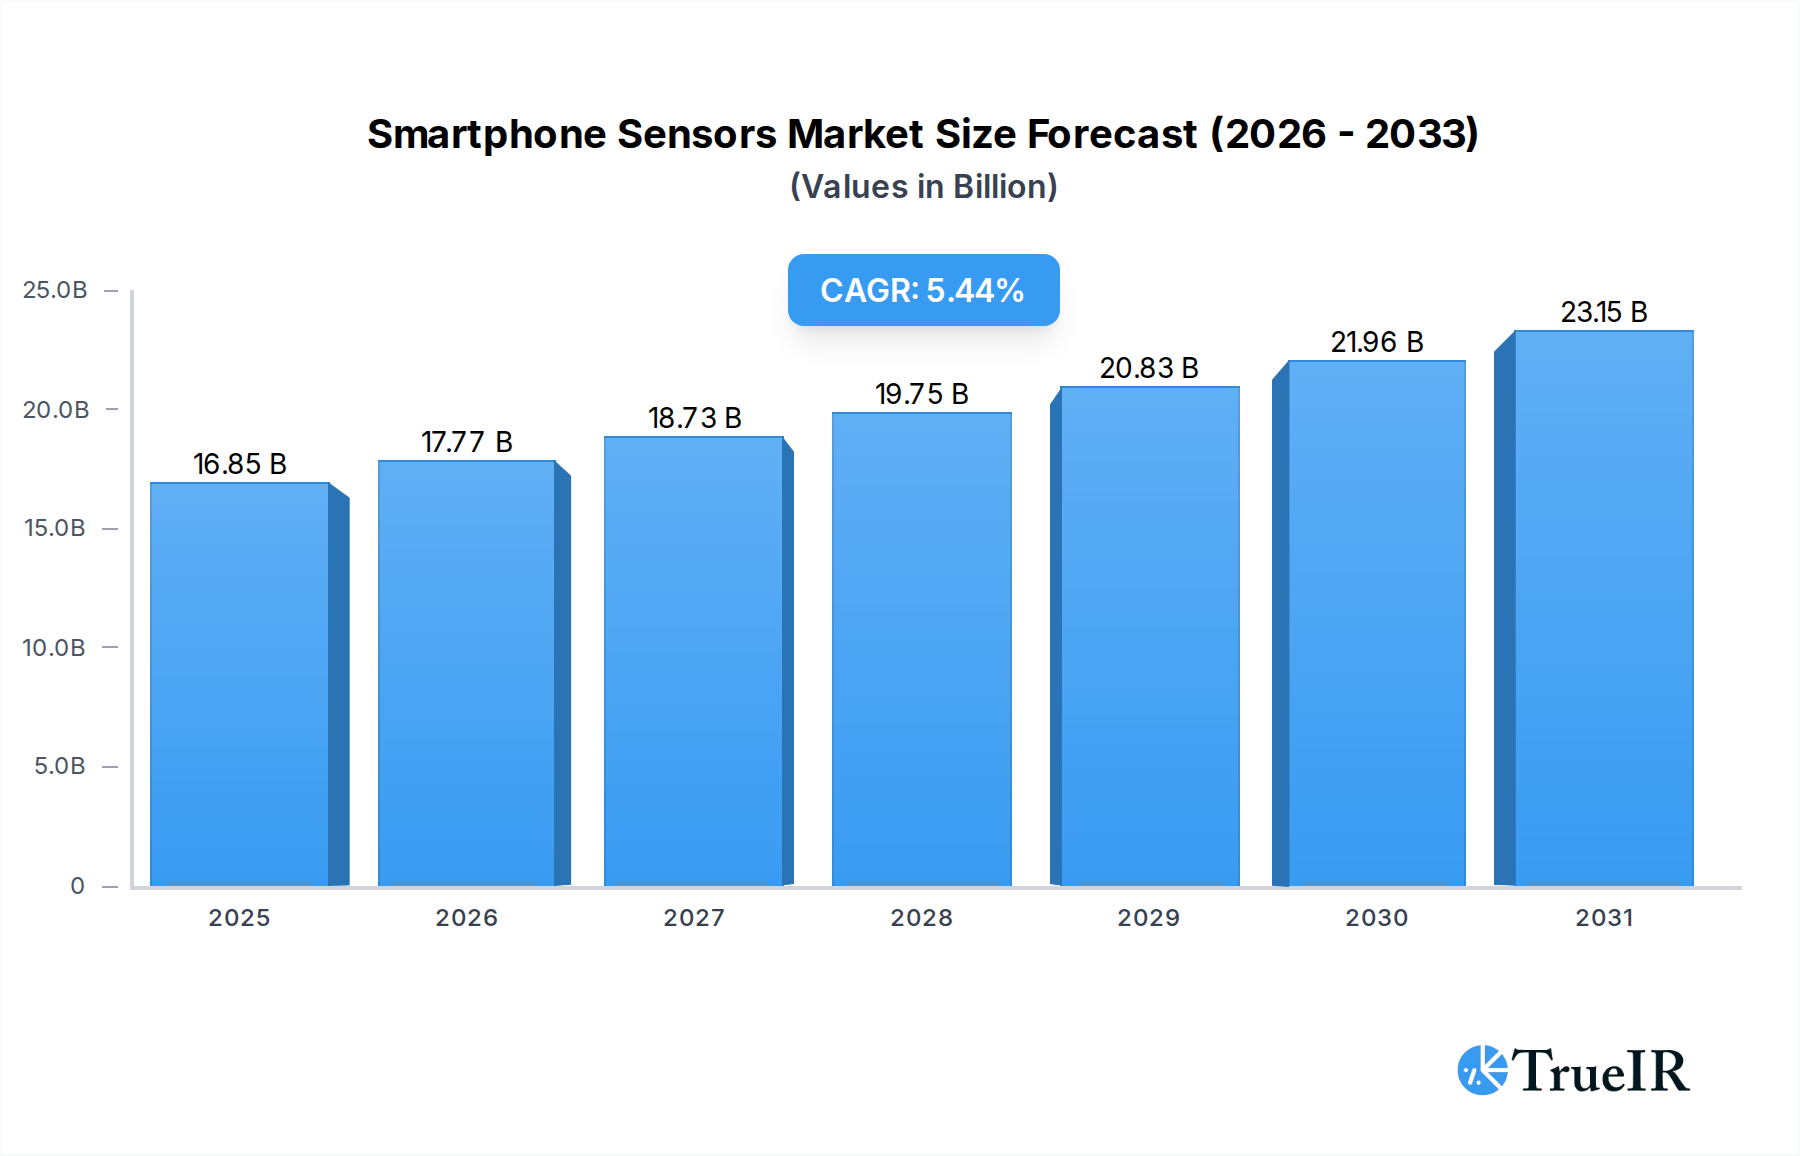
Smartphone Sensors Company Market Share
Image Sensors Dominance in Smartphone Sensors Market
The Image Sensors segment currently holds the largest revenue share within the Global Smartphone Sensors Market, a dominance driven primarily by the escalating demand for high-quality photography and videography capabilities in smartphones. Modern smartphones routinely feature multiple camera modules—including wide, ultra-wide, telephoto, and macro lenses—each relying on a dedicated Image Sensors module. This trend of multi-camera integration, coupled with the pursuit of higher megapixel counts and superior low-light performance, ensures a continuous and robust demand for advanced image sensing solutions. Key players such as Sony Corporation, Samsung Electronics, and OmniVision Technologies, Inc. lead this segment, continually pushing the boundaries of sensor technology with innovations like larger sensor sizes, improved pixel architectures, and enhanced computational photography capabilities.
The growth in this segment is also fueled by software advancements that leverage sensor data, such as real-time object recognition, bokeh effects, and dynamic range optimization, all of which require sophisticated Image Sensors as their foundation. The competitive landscape within the Image Sensors Market is characterized by intense R&D investment aimed at miniaturization without compromising image quality, integrating faster autofocus technologies, and improving power efficiency. While premium smartphones drive the adoption of cutting-edge sensor technology, the trickle-down effect ensures that higher-resolution and more capable Image Sensors are increasingly incorporated into mid-range and even budget-tier smartphones, democratizing advanced photographic capabilities. This sustained demand across all device tiers prevents significant consolidation in market share, instead fostering continuous innovation and differentiation among sensor manufacturers. Furthermore, the emerging applications in Augmented Reality Market are increasingly leveraging advanced camera systems not just for visual capture but also for environmental mapping and object tracking, creating new avenues for the Image Sensors Market within the broader Smartphone Sensors Market. The intricate interplay between hardware capabilities and software algorithms means that advancements in Image Sensors directly translate into tangible improvements in user experience, cementing its dominant position.
Key Market Drivers Fueling the Smartphone Sensors Market
The Smartphone Sensors Market is propelled by several critical drivers, each contributing significantly to its projected growth trajectory. The most prominent driver is the pervasive trend of multi-camera integration in smartphones. Flagship devices now routinely feature three to five camera modules, each equipped with distinct Image Sensors, to offer diverse photographic capabilities like ultra-wide, telephoto, and depth sensing. This architectural shift means a single smartphone incorporates multiple Image Sensors, vastly increasing overall demand across the market.
Another significant impetus is the widespread adoption of biometric authentication technologies. Features like facial recognition and fingerprint scanning have become standard security protocols. The increasing sophistication of these systems, often employing Time-of-Flight (ToF) Sensors for 3D mapping in facial recognition or advanced capacitive/ultrasonic modules for the Fingerprint Sensor, drives demand for high-precision, low-latency sensors. This emphasis on robust and convenient security is a major purchasing criterion for consumers.
The burgeoning ecosystem of Augmented Reality (AR) and Virtual Reality (VR) applications is also a pivotal driver. AR experiences, from gaming to utility apps, heavily rely on precise environmental mapping and motion tracking, which are facilitated by advanced gyroscopes, accelerometers, and Time-of-Flight Sensors. The integration of 3D ToF Sensor technology enables more immersive and interactive AR experiences, directly boosting demand for these specialized components within the Smartphone Sensors Market. This convergence with the Augmented Reality Market underscores a significant growth vector.
Furthermore, the growing emphasis on health and fitness tracking through smartphones has spurred demand for various embedded sensors. Accelerometers and gyroscopes accurately track motion and steps, while specialized temperature/humidity sensors and even pulse oximeters (often integrated with optical sensors) are finding their way into advanced smartphones, providing users with comprehensive health data. This trend aligns smartphones more closely with the Wearable Devices Market in terms of sensor utility, broadening their application scope and reinforcing sensor demand.
Finally, the global rollout and expansion of 5G connectivity catalyze demand by enabling new, data-intensive applications that can fully leverage sophisticated sensor arrays. Lower latency and higher bandwidth facilitate real-time processing of sensor data, supporting advanced AI applications, cloud-based AR, and highly responsive gaming, thereby creating a richer environment for sensor integration and innovation across the Smartphone Sensors Market.
Competitive Ecosystem of Smartphone Sensors Market
The competitive landscape of the Smartphone Sensors Market is dynamic and intensely competitive, characterized by innovation-driven strategies and a focus on miniaturization, power efficiency, and integration capabilities. Key players span across various specialties, from image sensing to MEMS technology.
- Sony Corporation: A dominant force in the Image Sensors Market, Sony is renowned for its high-performance CMOS image sensors which are widely adopted across premium smartphone brands, offering superior image quality and advanced features.
- Samsung Electronics: As both a smartphone manufacturer and a component supplier, Samsung develops and integrates a broad portfolio of sensors, including ISOCELL image sensors, contributing significantly to its own devices and the broader market.
- STMicroelectronics: A leading semiconductor company, STMicroelectronics specializes in a range of sensors including MEMS (Micro-Electro-Mechanical Systems) sensors such as accelerometers, gyroscopes, and magnetometers, as well as Time-of-Flight Sensors for autofocus and depth sensing.
- ams AG: Known for its advanced sensor solutions, ams AG provides high-performance ambient light sensors, proximity sensors, and spectral sensors, crucial for display optimization and smart sensing functionalities in smartphones.
- Infineon Technologies AG: A significant player in the automotive and industrial sectors, Infineon also contributes to the Smartphone Sensors Market with its radar and ToF sensor technologies, particularly for advanced biometric and gesture control applications.
- Omron: While primarily known for industrial automation and healthcare, Omron offers innovative sensor technologies that find applications in niche areas within smartphone sensing, such as environmental or health-related parameters.
- Bosch Sensortec: A global leader in MEMS technology, Bosch Sensortec supplies a comprehensive portfolio of sensors for mobile devices, including accelerometers, gyroscopes, magnetometers, and pressure sensors (barometers), enabling precise motion tracking and environmental monitoring.
- TDK Corporation: Through its subsidiary InvenSense, TDK Corporation is a key supplier of MEMS-based motion sensors, including accelerometers and gyroscopes, which are essential for navigation, gaming, and various motion-sensing applications in smartphones.
- Broadcom Inc.: Broadcom provides a range of connectivity and sensing solutions, including specialized modules that integrate various sensor functions, contributing to the overall semiconductor ecosystem supporting smartphone development.
- NXP Semiconductors: NXP offers secure connectivity solutions and a variety of sensors for mobile, focusing on secure identification and processing, including NFC and certain sensor integration modules.
- Texas Instruments Incorporated: A broad-line semiconductor company, Texas Instruments supplies a vast array of analog and embedded processing components, including specific sensor interfaces and power management ICs that are critical for sensor operation in smartphones.
- OmniVision Technologies, Inc.: A prominent developer of advanced digital imaging solutions, OmniVision is a key competitor in the Image Sensors Market, providing innovative CMOS image sensors for camera modules in a wide range of smartphones.
- Huawei Technologies: As a major smartphone manufacturer, Huawei designs and integrates its own sophisticated sensor technologies, particularly in camera and AI-driven sensing applications, within its extensive product portfolio.
Recent Developments & Milestones in Smartphone Sensors Market
Recent developments in the Smartphone Sensors Market have largely focused on enhancing computational capabilities, miniaturization, and the integration of novel sensing functionalities.
- Early 2022: Leading sensor manufacturers announced breakthroughs in under-display Fingerprint Sensor technology, improving reliability and reducing latency, thereby enabling seamless full-screen smartphone designs without compromising security.
- Mid 2022: Advancements in Time-of-Flight (ToF) Sensors allowed for more accurate 3D depth mapping, leading to improved facial recognition systems, enhanced augmented reality experiences, and more sophisticated camera autofocus capabilities in flagship smartphones.
- Late 2022: The introduction of next-generation Image Sensors with larger pixel sizes and advanced processing algorithms significantly improved low-light photography and dynamic range in smartphone cameras, setting new benchmarks for mobile imaging performance.
- Early 2023: Several major smartphone OEMs integrated advanced environmental sensors, including more precise temperature and humidity sensors, enabling health-monitoring features and improved climate adaptation for device performance.
- Mid 2023: A notable trend involved the deeper integration of AI capabilities directly into sensor modules, allowing for on-device processing of sensor data to reduce latency and enhance power efficiency for applications like gesture control and context awareness.
- Late 2023: Developments in MEMS Sensors Market led to the production of even smaller and more energy-efficient accelerometers and gyroscopes, crucial for the ongoing miniaturization of smartphones and the enhancement of motion-tracking applications and gaming.
- Early 2024: Collaborative efforts between sensor suppliers and smartphone makers focused on improving GPS and location-based service (LBS) accuracy through multi-frequency and multi-constellation GNSS sensors, benefiting navigation and location-based applications.
- Mid 2024: New optical sensor designs emerged, promising to enable more versatile ambient light sensing and even rudimentary spectral analysis for advanced display calibration and material identification through a smartphone camera.
Regional Market Breakdown for Smartphone Sensors Market
The Global Smartphone Sensors Market exhibits varied dynamics across different regions, influenced by smartphone penetration rates, technological adoption, and manufacturing hubs. Asia Pacific currently commands the largest revenue share and is anticipated to maintain its dominance as the fastest-growing region throughout the forecast period. Countries like China, India, Japan, and South Korea are at the forefront, driven by a massive consumer base, extensive smartphone manufacturing capabilities, and rapid adoption of advanced mobile technologies. The primary demand driver in Asia Pacific is the sheer volume of smartphone sales, coupled with a growing inclination towards feature-rich devices even in the mid-range and budget segments. This region is also a key hub for Semiconductor Components Market manufacturing, directly supporting the supply chain for smartphone sensors.
North America represents a mature market characterized by high disposable incomes and early adoption of flagship smartphones. The demand here is primarily driven by technological innovation, such as the integration of advanced biometric security (Fingerprint Sensor, facial recognition using Time-of-Flight Sensors) and sophisticated Image Sensors for computational photography. While its growth rate is steady, it contributes significantly to the premium segment of the Smartphone Sensors Market due to strong R&D investment and a consumer base willing to pay for cutting-edge features.
Europe closely mirrors North America in terms of market maturity and demand drivers. Key countries like Germany, France, and the UK prioritize data privacy and security, fueling the demand for robust authentication sensors. Furthermore, the strong emphasis on mobile gaming and Augmented Reality Market applications contributes to the demand for high-performance gyroscopes and accelerometers. Europe’s regional CAGR is expected to be stable, driven by replacement cycles and a focus on premium device upgrades.
Middle East & Africa (MEA), alongside South America, represent emerging markets with significant growth potential. These regions are experiencing rapid smartphone penetration, transitioning from feature phones to smartphones. The demand here is largely for affordable and mid-range devices, with a growing appetite for functionalities like improved cameras and reliable basic sensors. While the absolute market size in these regions is smaller than Asia Pacific, the higher growth rates are attributable to increasing internet access, rising disposable incomes, and the expansion of mobile payment ecosystems, which in turn require security and connectivity sensors, thus fostering the Internet of Things Devices Market indirectly through smartphone adoption.
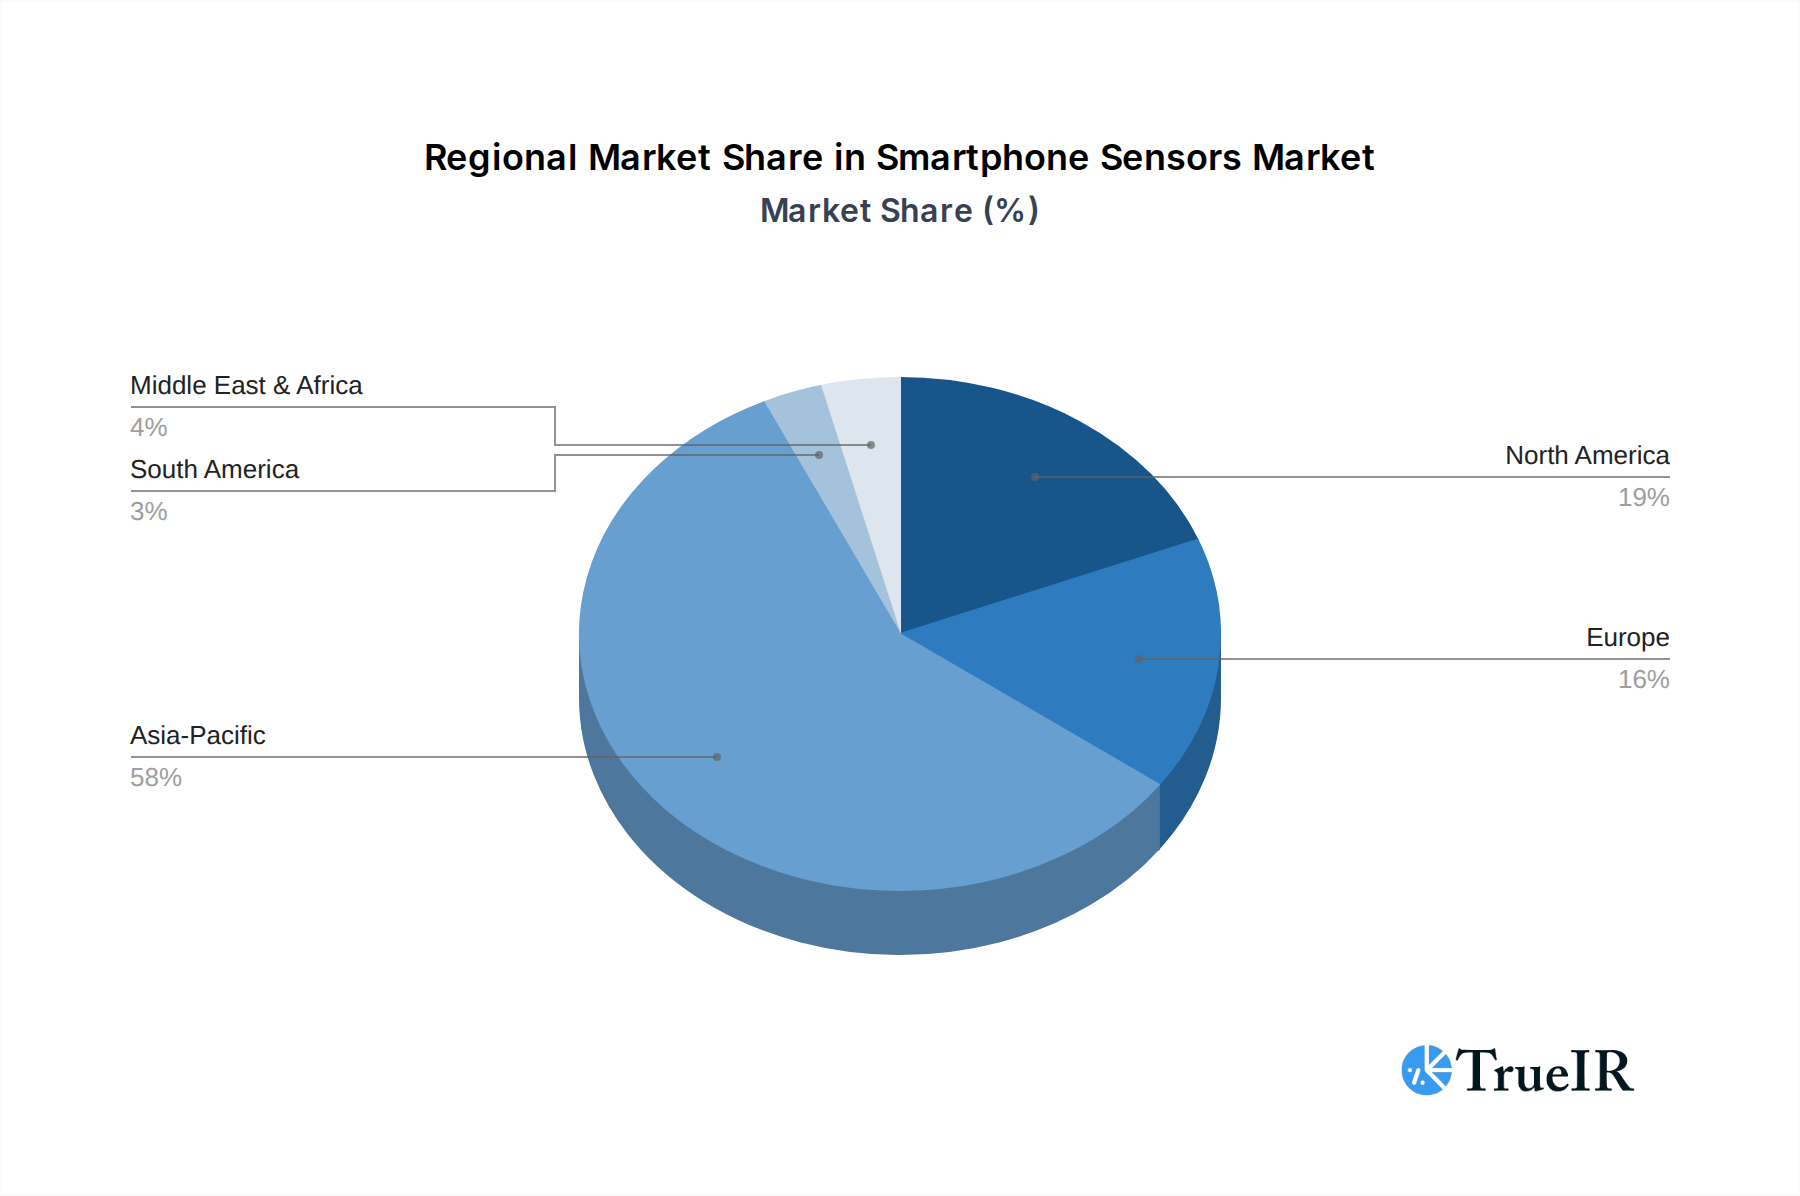
Smartphone Sensors Regional Market Share
Customer Segmentation & Buying Behavior in Smartphone Sensors Market
Customer segmentation in the Smartphone Sensors Market is primarily dictated by the smartphone device tier: Premium/Flagship, Mid-Range, and Budget/Economy Smartphones, each exhibiting distinct purchasing criteria and price sensitivity. Buyers of Premium/Flagship Smartphones prioritize cutting-edge technology, superior performance, and innovative features. Their purchasing criteria include exceptional imaging quality (driving demand for advanced Image Sensors), robust biometric security (via sophisticated Fingerprint Sensor and 3D ToF Sensors), and advanced capabilities for Augmented Reality Market and gaming (requiring high-precision accelerometers and gyroscopes). Price sensitivity is lower in this segment, as consumers are willing to pay a premium for the latest sensor advancements and seamless integration.
Customers opting for Mid-Range Smartphones seek a balance between performance, features, and cost. Their buying behavior is influenced by strong camera performance, reliable biometric authentication, and smooth navigation capabilities. While not necessarily demanding the absolute latest sensor technology, they expect competent Image Sensors, functional Fingerprint Sensor, and accurate GPS. Price sensitivity is moderate, making cost-effective yet high-performing sensor solutions attractive. Procurement channels for both premium and mid-range devices often involve direct carrier subsidies, online retail, and flagship store experiences.
Consumers of Budget/Economy Smartphones are highly price-sensitive, with their purchasing decisions driven primarily by affordability and essential functionality. They require basic yet reliable sensors, such as standard Image Sensors for casual photography, rudimentary accelerometers for basic motion tracking, and sometimes a simple Fingerprint Sensor for security. While advanced features are desirable, they are secondary to cost-effectiveness. The procurement channel for this segment heavily relies on mass-market retail, online discounters, and in some regions, independent distributors.
In recent cycles, there has been a notable shift in buyer preference, especially within the mid-range segment. Consumers are increasingly expecting advanced sensor features, previously exclusive to flagships, to trickle down into more affordable devices. This upward pressure on mid-range specifications necessitates sensor manufacturers to innovate towards more cost-effective, yet high-performance, solutions. Furthermore, the growing awareness of health and fitness has increased demand for integrated health-tracking sensors, influencing purchasing decisions across all tiers and blurring the lines with the Wearable Devices Market in terms of integrated sensor capabilities.
Investment & Funding Activity in Smartphone Sensors Market
Investment and funding activity within the Smartphone Sensors Market over the past 2-3 years has largely centered on strategic acquisitions, venture capital infusions into specialized sensor startups, and collaborative partnerships aimed at advancing next-generation mobile sensing technologies. The intense competition and rapid innovation cycles necessitate continuous capital deployment to maintain a competitive edge and drive new product development.
M&A activity has seen larger Semiconductor Components Market players acquiring smaller, specialized sensor companies to integrate specific technologies, expand intellectual property portfolios, or capture niche markets. For instance, acquisitions targeting companies proficient in advanced Image Sensors or Time-of-Flight Sensors have been prominent, as these areas are critical for enhancing smartphone photography, augmented reality, and biometric security. These strategic moves aim to consolidate expertise and accelerate the time-to-market for integrated sensor solutions.
Venture funding rounds have been active, particularly for startups focusing on innovative sensor materials, AI-driven sensor processing, and micro-electromechanical systems (MEMS) technologies. Sub-segments attracting the most capital include: MEMS Sensors Market due to its versatility in motion tracking, pressure sensing, and environmental monitoring; companies developing next-generation optical sensors for improved low-light performance and spectral analysis; and firms specializing in advanced Time-of-Flight Sensors for enhanced 3D sensing and gesture recognition. The emphasis is on energy efficiency, miniaturization, and the ability to process data at the edge, reducing reliance on cloud computing.
Strategic partnerships between sensor manufacturers and smartphone original equipment manufacturers (OEMs) are also commonplace. These collaborations often involve co-development agreements to tailor sensor designs for specific smartphone models, ensuring seamless integration and optimized performance. Such partnerships are crucial for integrating complex sensor arrays, like those used in multi-camera systems or for advanced biometric authentication. Funding is also directed towards R&D efforts in integrating sensors for health and wellness applications, moving beyond basic step counting to more sophisticated physiological monitoring, which also has implications for the Wearable Devices Market. Overall, the investment landscape reflects a strong belief in the continued importance of advanced sensing capabilities as a key differentiator in the highly competitive smartphone industry.
Smartphone Sensors Segmentation
-
1. Product Type
- 1.1. Image Sensors
-
1.2. Time-of-Flight (ToF) Sensors
- 1.2.1. 1D ToF Sensor
- 1.2.2. 3D ToF Sensor
- 1.3. Pressure Sensor (Barometer)
- 1.4. Temperature/Humidity Sensors
- 1.5. Accelerometer
- 1.6. Gyroscope
- 1.7. Magnetometer
- 1.8. GPS
- 1.9. Ambient Light Sensor
- 1.10. Fingerprint Sensor
- 1.11. Others
-
2. Component
- 2.1. Hardware
- 2.2. Software
-
3. Device Tier
- 3.1. Premium/Flagship Smartphones
- 3.2. Mid-Range Smartphones
- 3.3. Budget/Economy Smartphones
-
4. Application
- 4.1. Imaging & Photography
- 4.2. Motion Tracking & Gaming
- 4.3. Navigation & Location-Based Services
- 4.4. Security & Authentication
- 4.5. Augmented Reality (AR) & Gaming
- 4.6. Health & Fitness Tracking
- 4.7. Connectivity
- 4.8. Mobile Payments
- 4.9. Others
Smartphone Sensors Segmentation By Geography
-
1. North America
- 1.1. United States
- 1.2. Canada
- 1.3. Mexico
-
2. South America
- 2.1. Brazil
- 2.2. Argentina
- 2.3. Rest of South America
-
3. Europe
- 3.1. United Kingdom
- 3.2. Germany
- 3.3. France
- 3.4. Italy
- 3.5. Spain
- 3.6. Russia
- 3.7. Benelux
- 3.8. Nordics
- 3.9. Rest of Europe
-
4. Middle East & Africa
- 4.1. Turkey
- 4.2. Israel
- 4.3. GCC
- 4.4. North Africa
- 4.5. South Africa
- 4.6. Rest of Middle East & Africa
-
5. Asia Pacific
- 5.1. China
- 5.2. India
- 5.3. Japan
- 5.4. South Korea
- 5.5. ASEAN
- 5.6. Oceania
- 5.7. Rest of Asia Pacific
Smartphone Sensors Regional Market Share
Geographic Coverage of Smartphone Sensors
Smartphone Sensors REPORT HIGHLIGHTS
| Aspects | Details |
|---|---|
| Study Period | 2020-2034 |
| Base Year | 2025 |
| Estimated Year | 2026 |
| Forecast Period | 2026-2034 |
| Historical Period | 2020-2025 |
| Growth Rate | CAGR of 5.44% from 2020-2034 |
| Segmentation |
|
Table of Contents
- 1. Introduction
- 1.1. Research Scope
- 1.2. Market Segmentation
- 1.3. Research Objective
- 1.4. Definitions and Assumptions
- 2. Executive Summary
- 2.1. Market Snapshot
- 3. Market Dynamics
- 3.1. Market Drivers
- 3.2. Market Restrains
- 3.3. Market Trends
- 3.4. Market Opportunities
- 4. Market Factor Analysis
- 4.1. Porters Five Forces
- 4.1.1. Bargaining Power of Suppliers
- 4.1.2. Bargaining Power of Buyers
- 4.1.3. Threat of New Entrants
- 4.1.4. Threat of Substitutes
- 4.1.5. Competitive Rivalry
- 4.2. PESTEL analysis
- 4.3. BCG Analysis
- 4.3.1. Stars (High Growth, High Market Share)
- 4.3.2. Cash Cows (Low Growth, High Market Share)
- 4.3.3. Question Mark (High Growth, Low Market Share)
- 4.3.4. Dogs (Low Growth, Low Market Share)
- 4.4. Ansoff Matrix Analysis
- 4.5. Supply Chain Analysis
- 4.6. Regulatory Landscape
- 4.7. Current Market Potential and Opportunity Assessment (TAM–SAM–SOM Framework)
- 4.8. TIR Analyst Note
- 4.1. Porters Five Forces
- 5. Market Analysis, Insights and Forecast 2021-2033
- 5.1. Market Analysis, Insights and Forecast - by Product Type
- 5.1.1. Image Sensors
- 5.1.2. Time-of-Flight (ToF) Sensors
- 5.1.2.1. 1D ToF Sensor
- 5.1.2.2. 3D ToF Sensor
- 5.1.3. Pressure Sensor (Barometer)
- 5.1.4. Temperature/Humidity Sensors
- 5.1.5. Accelerometer
- 5.1.6. Gyroscope
- 5.1.7. Magnetometer
- 5.1.8. GPS
- 5.1.9. Ambient Light Sensor
- 5.1.10. Fingerprint Sensor
- 5.1.11. Others
- 5.2. Market Analysis, Insights and Forecast - by Component
- 5.2.1. Hardware
- 5.2.2. Software
- 5.3. Market Analysis, Insights and Forecast - by Device Tier
- 5.3.1. Premium/Flagship Smartphones
- 5.3.2. Mid-Range Smartphones
- 5.3.3. Budget/Economy Smartphones
- 5.4. Market Analysis, Insights and Forecast - by Application
- 5.4.1. Imaging & Photography
- 5.4.2. Motion Tracking & Gaming
- 5.4.3. Navigation & Location-Based Services
- 5.4.4. Security & Authentication
- 5.4.5. Augmented Reality (AR) & Gaming
- 5.4.6. Health & Fitness Tracking
- 5.4.7. Connectivity
- 5.4.8. Mobile Payments
- 5.4.9. Others
- 5.5. Market Analysis, Insights and Forecast - by Region
- 5.5.1. North America
- 5.5.2. South America
- 5.5.3. Europe
- 5.5.4. Middle East & Africa
- 5.5.5. Asia Pacific
- 5.1. Market Analysis, Insights and Forecast - by Product Type
- 6. Global Smartphone Sensors Analysis, Insights and Forecast, 2021-2033
- 6.1. Market Analysis, Insights and Forecast - by Product Type
- 6.1.1. Image Sensors
- 6.1.2. Time-of-Flight (ToF) Sensors
- 6.1.2.1. 1D ToF Sensor
- 6.1.2.2. 3D ToF Sensor
- 6.1.3. Pressure Sensor (Barometer)
- 6.1.4. Temperature/Humidity Sensors
- 6.1.5. Accelerometer
- 6.1.6. Gyroscope
- 6.1.7. Magnetometer
- 6.1.8. GPS
- 6.1.9. Ambient Light Sensor
- 6.1.10. Fingerprint Sensor
- 6.1.11. Others
- 6.2. Market Analysis, Insights and Forecast - by Component
- 6.2.1. Hardware
- 6.2.2. Software
- 6.3. Market Analysis, Insights and Forecast - by Device Tier
- 6.3.1. Premium/Flagship Smartphones
- 6.3.2. Mid-Range Smartphones
- 6.3.3. Budget/Economy Smartphones
- 6.4. Market Analysis, Insights and Forecast - by Application
- 6.4.1. Imaging & Photography
- 6.4.2. Motion Tracking & Gaming
- 6.4.3. Navigation & Location-Based Services
- 6.4.4. Security & Authentication
- 6.4.5. Augmented Reality (AR) & Gaming
- 6.4.6. Health & Fitness Tracking
- 6.4.7. Connectivity
- 6.4.8. Mobile Payments
- 6.4.9. Others
- 6.1. Market Analysis, Insights and Forecast - by Product Type
- 7. North America Smartphone Sensors Analysis, Insights and Forecast, 2020-2032
- 7.1. Market Analysis, Insights and Forecast - by Product Type
- 7.1.1. Image Sensors
- 7.1.2. Time-of-Flight (ToF) Sensors
- 7.1.2.1. 1D ToF Sensor
- 7.1.2.2. 3D ToF Sensor
- 7.1.3. Pressure Sensor (Barometer)
- 7.1.4. Temperature/Humidity Sensors
- 7.1.5. Accelerometer
- 7.1.6. Gyroscope
- 7.1.7. Magnetometer
- 7.1.8. GPS
- 7.1.9. Ambient Light Sensor
- 7.1.10. Fingerprint Sensor
- 7.1.11. Others
- 7.2. Market Analysis, Insights and Forecast - by Component
- 7.2.1. Hardware
- 7.2.2. Software
- 7.3. Market Analysis, Insights and Forecast - by Device Tier
- 7.3.1. Premium/Flagship Smartphones
- 7.3.2. Mid-Range Smartphones
- 7.3.3. Budget/Economy Smartphones
- 7.4. Market Analysis, Insights and Forecast - by Application
- 7.4.1. Imaging & Photography
- 7.4.2. Motion Tracking & Gaming
- 7.4.3. Navigation & Location-Based Services
- 7.4.4. Security & Authentication
- 7.4.5. Augmented Reality (AR) & Gaming
- 7.4.6. Health & Fitness Tracking
- 7.4.7. Connectivity
- 7.4.8. Mobile Payments
- 7.4.9. Others
- 7.1. Market Analysis, Insights and Forecast - by Product Type
- 8. South America Smartphone Sensors Analysis, Insights and Forecast, 2020-2032
- 8.1. Market Analysis, Insights and Forecast - by Product Type
- 8.1.1. Image Sensors
- 8.1.2. Time-of-Flight (ToF) Sensors
- 8.1.2.1. 1D ToF Sensor
- 8.1.2.2. 3D ToF Sensor
- 8.1.3. Pressure Sensor (Barometer)
- 8.1.4. Temperature/Humidity Sensors
- 8.1.5. Accelerometer
- 8.1.6. Gyroscope
- 8.1.7. Magnetometer
- 8.1.8. GPS
- 8.1.9. Ambient Light Sensor
- 8.1.10. Fingerprint Sensor
- 8.1.11. Others
- 8.2. Market Analysis, Insights and Forecast - by Component
- 8.2.1. Hardware
- 8.2.2. Software
- 8.3. Market Analysis, Insights and Forecast - by Device Tier
- 8.3.1. Premium/Flagship Smartphones
- 8.3.2. Mid-Range Smartphones
- 8.3.3. Budget/Economy Smartphones
- 8.4. Market Analysis, Insights and Forecast - by Application
- 8.4.1. Imaging & Photography
- 8.4.2. Motion Tracking & Gaming
- 8.4.3. Navigation & Location-Based Services
- 8.4.4. Security & Authentication
- 8.4.5. Augmented Reality (AR) & Gaming
- 8.4.6. Health & Fitness Tracking
- 8.4.7. Connectivity
- 8.4.8. Mobile Payments
- 8.4.9. Others
- 8.1. Market Analysis, Insights and Forecast - by Product Type
- 9. Europe Smartphone Sensors Analysis, Insights and Forecast, 2020-2032
- 9.1. Market Analysis, Insights and Forecast - by Product Type
- 9.1.1. Image Sensors
- 9.1.2. Time-of-Flight (ToF) Sensors
- 9.1.2.1. 1D ToF Sensor
- 9.1.2.2. 3D ToF Sensor
- 9.1.3. Pressure Sensor (Barometer)
- 9.1.4. Temperature/Humidity Sensors
- 9.1.5. Accelerometer
- 9.1.6. Gyroscope
- 9.1.7. Magnetometer
- 9.1.8. GPS
- 9.1.9. Ambient Light Sensor
- 9.1.10. Fingerprint Sensor
- 9.1.11. Others
- 9.2. Market Analysis, Insights and Forecast - by Component
- 9.2.1. Hardware
- 9.2.2. Software
- 9.3. Market Analysis, Insights and Forecast - by Device Tier
- 9.3.1. Premium/Flagship Smartphones
- 9.3.2. Mid-Range Smartphones
- 9.3.3. Budget/Economy Smartphones
- 9.4. Market Analysis, Insights and Forecast - by Application
- 9.4.1. Imaging & Photography
- 9.4.2. Motion Tracking & Gaming
- 9.4.3. Navigation & Location-Based Services
- 9.4.4. Security & Authentication
- 9.4.5. Augmented Reality (AR) & Gaming
- 9.4.6. Health & Fitness Tracking
- 9.4.7. Connectivity
- 9.4.8. Mobile Payments
- 9.4.9. Others
- 9.1. Market Analysis, Insights and Forecast - by Product Type
- 10. Middle East & Africa Smartphone Sensors Analysis, Insights and Forecast, 2020-2032
- 10.1. Market Analysis, Insights and Forecast - by Product Type
- 10.1.1. Image Sensors
- 10.1.2. Time-of-Flight (ToF) Sensors
- 10.1.2.1. 1D ToF Sensor
- 10.1.2.2. 3D ToF Sensor
- 10.1.3. Pressure Sensor (Barometer)
- 10.1.4. Temperature/Humidity Sensors
- 10.1.5. Accelerometer
- 10.1.6. Gyroscope
- 10.1.7. Magnetometer
- 10.1.8. GPS
- 10.1.9. Ambient Light Sensor
- 10.1.10. Fingerprint Sensor
- 10.1.11. Others
- 10.2. Market Analysis, Insights and Forecast - by Component
- 10.2.1. Hardware
- 10.2.2. Software
- 10.3. Market Analysis, Insights and Forecast - by Device Tier
- 10.3.1. Premium/Flagship Smartphones
- 10.3.2. Mid-Range Smartphones
- 10.3.3. Budget/Economy Smartphones
- 10.4. Market Analysis, Insights and Forecast - by Application
- 10.4.1. Imaging & Photography
- 10.4.2. Motion Tracking & Gaming
- 10.4.3. Navigation & Location-Based Services
- 10.4.4. Security & Authentication
- 10.4.5. Augmented Reality (AR) & Gaming
- 10.4.6. Health & Fitness Tracking
- 10.4.7. Connectivity
- 10.4.8. Mobile Payments
- 10.4.9. Others
- 10.1. Market Analysis, Insights and Forecast - by Product Type
- 11. Asia Pacific Smartphone Sensors Analysis, Insights and Forecast, 2020-2032
- 11.1. Market Analysis, Insights and Forecast - by Product Type
- 11.1.1. Image Sensors
- 11.1.2. Time-of-Flight (ToF) Sensors
- 11.1.2.1. 1D ToF Sensor
- 11.1.2.2. 3D ToF Sensor
- 11.1.3. Pressure Sensor (Barometer)
- 11.1.4. Temperature/Humidity Sensors
- 11.1.5. Accelerometer
- 11.1.6. Gyroscope
- 11.1.7. Magnetometer
- 11.1.8. GPS
- 11.1.9. Ambient Light Sensor
- 11.1.10. Fingerprint Sensor
- 11.1.11. Others
- 11.2. Market Analysis, Insights and Forecast - by Component
- 11.2.1. Hardware
- 11.2.2. Software
- 11.3. Market Analysis, Insights and Forecast - by Device Tier
- 11.3.1. Premium/Flagship Smartphones
- 11.3.2. Mid-Range Smartphones
- 11.3.3. Budget/Economy Smartphones
- 11.4. Market Analysis, Insights and Forecast - by Application
- 11.4.1. Imaging & Photography
- 11.4.2. Motion Tracking & Gaming
- 11.4.3. Navigation & Location-Based Services
- 11.4.4. Security & Authentication
- 11.4.5. Augmented Reality (AR) & Gaming
- 11.4.6. Health & Fitness Tracking
- 11.4.7. Connectivity
- 11.4.8. Mobile Payments
- 11.4.9. Others
- 11.1. Market Analysis, Insights and Forecast - by Product Type
- 12. Competitive Analysis
- 12.1. Company Profiles
- 12.1.1 Sony Corporation
- 12.1.1.1. Company Overview
- 12.1.1.2. Products
- 12.1.1.3. Company Financials
- 12.1.1.4. SWOT Analysis
- 12.1.2 Samsung Electronics
- 12.1.2.1. Company Overview
- 12.1.2.2. Products
- 12.1.2.3. Company Financials
- 12.1.2.4. SWOT Analysis
- 12.1.3 STMicroelectronics
- 12.1.3.1. Company Overview
- 12.1.3.2. Products
- 12.1.3.3. Company Financials
- 12.1.3.4. SWOT Analysis
- 12.1.4 ams AG
- 12.1.4.1. Company Overview
- 12.1.4.2. Products
- 12.1.4.3. Company Financials
- 12.1.4.4. SWOT Analysis
- 12.1.5 Infineon Technologies AG
- 12.1.5.1. Company Overview
- 12.1.5.2. Products
- 12.1.5.3. Company Financials
- 12.1.5.4. SWOT Analysis
- 12.1.6 Omron
- 12.1.6.1. Company Overview
- 12.1.6.2. Products
- 12.1.6.3. Company Financials
- 12.1.6.4. SWOT Analysis
- 12.1.7 Bosch Sensortec
- 12.1.7.1. Company Overview
- 12.1.7.2. Products
- 12.1.7.3. Company Financials
- 12.1.7.4. SWOT Analysis
- 12.1.8 TDK Corporation
- 12.1.8.1. Company Overview
- 12.1.8.2. Products
- 12.1.8.3. Company Financials
- 12.1.8.4. SWOT Analysis
- 12.1.9 Broadcom Inc.
- 12.1.9.1. Company Overview
- 12.1.9.2. Products
- 12.1.9.3. Company Financials
- 12.1.9.4. SWOT Analysis
- 12.1.10 NXP Semiconductors
- 12.1.10.1. Company Overview
- 12.1.10.2. Products
- 12.1.10.3. Company Financials
- 12.1.10.4. SWOT Analysis
- 12.1.11 Texas Instruments Incorporated
- 12.1.11.1. Company Overview
- 12.1.11.2. Products
- 12.1.11.3. Company Financials
- 12.1.11.4. SWOT Analysis
- 12.1.12 OmniVision Technologies Inc.
- 12.1.12.1. Company Overview
- 12.1.12.2. Products
- 12.1.12.3. Company Financials
- 12.1.12.4. SWOT Analysis
- 12.1.13 Huawei Technologies
- 12.1.13.1. Company Overview
- 12.1.13.2. Products
- 12.1.13.3. Company Financials
- 12.1.13.4. SWOT Analysis
- 12.1.14 Others
- 12.1.14.1. Company Overview
- 12.1.14.2. Products
- 12.1.14.3. Company Financials
- 12.1.14.4. SWOT Analysis
- 12.1.1 Sony Corporation
- 12.2. Market Entropy
- 12.2.1 Company's Key Areas Served
- 12.2.2 Recent Developments
- 12.3. Company Market Share Analysis 2025
- 12.3.1 Top 5 Companies Market Share Analysis
- 12.3.2 Top 3 Companies Market Share Analysis
- 12.4. List of Potential Customers
- 13. Research Methodology
List of Figures
- Figure 1: Global Smartphone Sensors Revenue Breakdown (billion, %) by Region 2025 & 2033
- Figure 2: Global Smartphone Sensors Volume Breakdown (K, %) by Region 2025 & 2033
- Figure 3: North America Smartphone Sensors Revenue (billion), by Product Type 2025 & 2033
- Figure 4: North America Smartphone Sensors Volume (K), by Product Type 2025 & 2033
- Figure 5: North America Smartphone Sensors Revenue Share (%), by Product Type 2025 & 2033
- Figure 6: North America Smartphone Sensors Volume Share (%), by Product Type 2025 & 2033
- Figure 7: North America Smartphone Sensors Revenue (billion), by Component 2025 & 2033
- Figure 8: North America Smartphone Sensors Volume (K), by Component 2025 & 2033
- Figure 9: North America Smartphone Sensors Revenue Share (%), by Component 2025 & 2033
- Figure 10: North America Smartphone Sensors Volume Share (%), by Component 2025 & 2033
- Figure 11: North America Smartphone Sensors Revenue (billion), by Device Tier 2025 & 2033
- Figure 12: North America Smartphone Sensors Volume (K), by Device Tier 2025 & 2033
- Figure 13: North America Smartphone Sensors Revenue Share (%), by Device Tier 2025 & 2033
- Figure 14: North America Smartphone Sensors Volume Share (%), by Device Tier 2025 & 2033
- Figure 15: North America Smartphone Sensors Revenue (billion), by Application 2025 & 2033
- Figure 16: North America Smartphone Sensors Volume (K), by Application 2025 & 2033
- Figure 17: North America Smartphone Sensors Revenue Share (%), by Application 2025 & 2033
- Figure 18: North America Smartphone Sensors Volume Share (%), by Application 2025 & 2033
- Figure 19: North America Smartphone Sensors Revenue (billion), by Country 2025 & 2033
- Figure 20: North America Smartphone Sensors Volume (K), by Country 2025 & 2033
- Figure 21: North America Smartphone Sensors Revenue Share (%), by Country 2025 & 2033
- Figure 22: North America Smartphone Sensors Volume Share (%), by Country 2025 & 2033
- Figure 23: South America Smartphone Sensors Revenue (billion), by Product Type 2025 & 2033
- Figure 24: South America Smartphone Sensors Volume (K), by Product Type 2025 & 2033
- Figure 25: South America Smartphone Sensors Revenue Share (%), by Product Type 2025 & 2033
- Figure 26: South America Smartphone Sensors Volume Share (%), by Product Type 2025 & 2033
- Figure 27: South America Smartphone Sensors Revenue (billion), by Component 2025 & 2033
- Figure 28: South America Smartphone Sensors Volume (K), by Component 2025 & 2033
- Figure 29: South America Smartphone Sensors Revenue Share (%), by Component 2025 & 2033
- Figure 30: South America Smartphone Sensors Volume Share (%), by Component 2025 & 2033
- Figure 31: South America Smartphone Sensors Revenue (billion), by Device Tier 2025 & 2033
- Figure 32: South America Smartphone Sensors Volume (K), by Device Tier 2025 & 2033
- Figure 33: South America Smartphone Sensors Revenue Share (%), by Device Tier 2025 & 2033
- Figure 34: South America Smartphone Sensors Volume Share (%), by Device Tier 2025 & 2033
- Figure 35: South America Smartphone Sensors Revenue (billion), by Application 2025 & 2033
- Figure 36: South America Smartphone Sensors Volume (K), by Application 2025 & 2033
- Figure 37: South America Smartphone Sensors Revenue Share (%), by Application 2025 & 2033
- Figure 38: South America Smartphone Sensors Volume Share (%), by Application 2025 & 2033
- Figure 39: South America Smartphone Sensors Revenue (billion), by Country 2025 & 2033
- Figure 40: South America Smartphone Sensors Volume (K), by Country 2025 & 2033
- Figure 41: South America Smartphone Sensors Revenue Share (%), by Country 2025 & 2033
- Figure 42: South America Smartphone Sensors Volume Share (%), by Country 2025 & 2033
- Figure 43: Europe Smartphone Sensors Revenue (billion), by Product Type 2025 & 2033
- Figure 44: Europe Smartphone Sensors Volume (K), by Product Type 2025 & 2033
- Figure 45: Europe Smartphone Sensors Revenue Share (%), by Product Type 2025 & 2033
- Figure 46: Europe Smartphone Sensors Volume Share (%), by Product Type 2025 & 2033
- Figure 47: Europe Smartphone Sensors Revenue (billion), by Component 2025 & 2033
- Figure 48: Europe Smartphone Sensors Volume (K), by Component 2025 & 2033
- Figure 49: Europe Smartphone Sensors Revenue Share (%), by Component 2025 & 2033
- Figure 50: Europe Smartphone Sensors Volume Share (%), by Component 2025 & 2033
- Figure 51: Europe Smartphone Sensors Revenue (billion), by Device Tier 2025 & 2033
- Figure 52: Europe Smartphone Sensors Volume (K), by Device Tier 2025 & 2033
- Figure 53: Europe Smartphone Sensors Revenue Share (%), by Device Tier 2025 & 2033
- Figure 54: Europe Smartphone Sensors Volume Share (%), by Device Tier 2025 & 2033
- Figure 55: Europe Smartphone Sensors Revenue (billion), by Application 2025 & 2033
- Figure 56: Europe Smartphone Sensors Volume (K), by Application 2025 & 2033
- Figure 57: Europe Smartphone Sensors Revenue Share (%), by Application 2025 & 2033
- Figure 58: Europe Smartphone Sensors Volume Share (%), by Application 2025 & 2033
- Figure 59: Europe Smartphone Sensors Revenue (billion), by Country 2025 & 2033
- Figure 60: Europe Smartphone Sensors Volume (K), by Country 2025 & 2033
- Figure 61: Europe Smartphone Sensors Revenue Share (%), by Country 2025 & 2033
- Figure 62: Europe Smartphone Sensors Volume Share (%), by Country 2025 & 2033
- Figure 63: Middle East & Africa Smartphone Sensors Revenue (billion), by Product Type 2025 & 2033
- Figure 64: Middle East & Africa Smartphone Sensors Volume (K), by Product Type 2025 & 2033
- Figure 65: Middle East & Africa Smartphone Sensors Revenue Share (%), by Product Type 2025 & 2033
- Figure 66: Middle East & Africa Smartphone Sensors Volume Share (%), by Product Type 2025 & 2033
- Figure 67: Middle East & Africa Smartphone Sensors Revenue (billion), by Component 2025 & 2033
- Figure 68: Middle East & Africa Smartphone Sensors Volume (K), by Component 2025 & 2033
- Figure 69: Middle East & Africa Smartphone Sensors Revenue Share (%), by Component 2025 & 2033
- Figure 70: Middle East & Africa Smartphone Sensors Volume Share (%), by Component 2025 & 2033
- Figure 71: Middle East & Africa Smartphone Sensors Revenue (billion), by Device Tier 2025 & 2033
- Figure 72: Middle East & Africa Smartphone Sensors Volume (K), by Device Tier 2025 & 2033
- Figure 73: Middle East & Africa Smartphone Sensors Revenue Share (%), by Device Tier 2025 & 2033
- Figure 74: Middle East & Africa Smartphone Sensors Volume Share (%), by Device Tier 2025 & 2033
- Figure 75: Middle East & Africa Smartphone Sensors Revenue (billion), by Application 2025 & 2033
- Figure 76: Middle East & Africa Smartphone Sensors Volume (K), by Application 2025 & 2033
- Figure 77: Middle East & Africa Smartphone Sensors Revenue Share (%), by Application 2025 & 2033
- Figure 78: Middle East & Africa Smartphone Sensors Volume Share (%), by Application 2025 & 2033
- Figure 79: Middle East & Africa Smartphone Sensors Revenue (billion), by Country 2025 & 2033
- Figure 80: Middle East & Africa Smartphone Sensors Volume (K), by Country 2025 & 2033
- Figure 81: Middle East & Africa Smartphone Sensors Revenue Share (%), by Country 2025 & 2033
- Figure 82: Middle East & Africa Smartphone Sensors Volume Share (%), by Country 2025 & 2033
- Figure 83: Asia Pacific Smartphone Sensors Revenue (billion), by Product Type 2025 & 2033
- Figure 84: Asia Pacific Smartphone Sensors Volume (K), by Product Type 2025 & 2033
- Figure 85: Asia Pacific Smartphone Sensors Revenue Share (%), by Product Type 2025 & 2033
- Figure 86: Asia Pacific Smartphone Sensors Volume Share (%), by Product Type 2025 & 2033
- Figure 87: Asia Pacific Smartphone Sensors Revenue (billion), by Component 2025 & 2033
- Figure 88: Asia Pacific Smartphone Sensors Volume (K), by Component 2025 & 2033
- Figure 89: Asia Pacific Smartphone Sensors Revenue Share (%), by Component 2025 & 2033
- Figure 90: Asia Pacific Smartphone Sensors Volume Share (%), by Component 2025 & 2033
- Figure 91: Asia Pacific Smartphone Sensors Revenue (billion), by Device Tier 2025 & 2033
- Figure 92: Asia Pacific Smartphone Sensors Volume (K), by Device Tier 2025 & 2033
- Figure 93: Asia Pacific Smartphone Sensors Revenue Share (%), by Device Tier 2025 & 2033
- Figure 94: Asia Pacific Smartphone Sensors Volume Share (%), by Device Tier 2025 & 2033
- Figure 95: Asia Pacific Smartphone Sensors Revenue (billion), by Application 2025 & 2033
- Figure 96: Asia Pacific Smartphone Sensors Volume (K), by Application 2025 & 2033
- Figure 97: Asia Pacific Smartphone Sensors Revenue Share (%), by Application 2025 & 2033
- Figure 98: Asia Pacific Smartphone Sensors Volume Share (%), by Application 2025 & 2033
- Figure 99: Asia Pacific Smartphone Sensors Revenue (billion), by Country 2025 & 2033
- Figure 100: Asia Pacific Smartphone Sensors Volume (K), by Country 2025 & 2033
- Figure 101: Asia Pacific Smartphone Sensors Revenue Share (%), by Country 2025 & 2033
- Figure 102: Asia Pacific Smartphone Sensors Volume Share (%), by Country 2025 & 2033
List of Tables
- Table 1: Global Smartphone Sensors Revenue billion Forecast, by Product Type 2020 & 2033
- Table 2: Global Smartphone Sensors Volume K Forecast, by Product Type 2020 & 2033
- Table 3: Global Smartphone Sensors Revenue billion Forecast, by Component 2020 & 2033
- Table 4: Global Smartphone Sensors Volume K Forecast, by Component 2020 & 2033
- Table 5: Global Smartphone Sensors Revenue billion Forecast, by Device Tier 2020 & 2033
- Table 6: Global Smartphone Sensors Volume K Forecast, by Device Tier 2020 & 2033
- Table 7: Global Smartphone Sensors Revenue billion Forecast, by Application 2020 & 2033
- Table 8: Global Smartphone Sensors Volume K Forecast, by Application 2020 & 2033
- Table 9: Global Smartphone Sensors Revenue billion Forecast, by Region 2020 & 2033
- Table 10: Global Smartphone Sensors Volume K Forecast, by Region 2020 & 2033
- Table 11: Global Smartphone Sensors Revenue billion Forecast, by Product Type 2020 & 2033
- Table 12: Global Smartphone Sensors Volume K Forecast, by Product Type 2020 & 2033
- Table 13: Global Smartphone Sensors Revenue billion Forecast, by Component 2020 & 2033
- Table 14: Global Smartphone Sensors Volume K Forecast, by Component 2020 & 2033
- Table 15: Global Smartphone Sensors Revenue billion Forecast, by Device Tier 2020 & 2033
- Table 16: Global Smartphone Sensors Volume K Forecast, by Device Tier 2020 & 2033
- Table 17: Global Smartphone Sensors Revenue billion Forecast, by Application 2020 & 2033
- Table 18: Global Smartphone Sensors Volume K Forecast, by Application 2020 & 2033
- Table 19: Global Smartphone Sensors Revenue billion Forecast, by Country 2020 & 2033
- Table 20: Global Smartphone Sensors Volume K Forecast, by Country 2020 & 2033
- Table 21: United States Smartphone Sensors Revenue (billion) Forecast, by Application 2020 & 2033
- Table 22: United States Smartphone Sensors Volume (K) Forecast, by Application 2020 & 2033
- Table 23: Canada Smartphone Sensors Revenue (billion) Forecast, by Application 2020 & 2033
- Table 24: Canada Smartphone Sensors Volume (K) Forecast, by Application 2020 & 2033
- Table 25: Mexico Smartphone Sensors Revenue (billion) Forecast, by Application 2020 & 2033
- Table 26: Mexico Smartphone Sensors Volume (K) Forecast, by Application 2020 & 2033
- Table 27: Global Smartphone Sensors Revenue billion Forecast, by Product Type 2020 & 2033
- Table 28: Global Smartphone Sensors Volume K Forecast, by Product Type 2020 & 2033
- Table 29: Global Smartphone Sensors Revenue billion Forecast, by Component 2020 & 2033
- Table 30: Global Smartphone Sensors Volume K Forecast, by Component 2020 & 2033
- Table 31: Global Smartphone Sensors Revenue billion Forecast, by Device Tier 2020 & 2033
- Table 32: Global Smartphone Sensors Volume K Forecast, by Device Tier 2020 & 2033
- Table 33: Global Smartphone Sensors Revenue billion Forecast, by Application 2020 & 2033
- Table 34: Global Smartphone Sensors Volume K Forecast, by Application 2020 & 2033
- Table 35: Global Smartphone Sensors Revenue billion Forecast, by Country 2020 & 2033
- Table 36: Global Smartphone Sensors Volume K Forecast, by Country 2020 & 2033
- Table 37: Brazil Smartphone Sensors Revenue (billion) Forecast, by Application 2020 & 2033
- Table 38: Brazil Smartphone Sensors Volume (K) Forecast, by Application 2020 & 2033
- Table 39: Argentina Smartphone Sensors Revenue (billion) Forecast, by Application 2020 & 2033
- Table 40: Argentina Smartphone Sensors Volume (K) Forecast, by Application 2020 & 2033
- Table 41: Rest of South America Smartphone Sensors Revenue (billion) Forecast, by Application 2020 & 2033
- Table 42: Rest of South America Smartphone Sensors Volume (K) Forecast, by Application 2020 & 2033
- Table 43: Global Smartphone Sensors Revenue billion Forecast, by Product Type 2020 & 2033
- Table 44: Global Smartphone Sensors Volume K Forecast, by Product Type 2020 & 2033
- Table 45: Global Smartphone Sensors Revenue billion Forecast, by Component 2020 & 2033
- Table 46: Global Smartphone Sensors Volume K Forecast, by Component 2020 & 2033
- Table 47: Global Smartphone Sensors Revenue billion Forecast, by Device Tier 2020 & 2033
- Table 48: Global Smartphone Sensors Volume K Forecast, by Device Tier 2020 & 2033
- Table 49: Global Smartphone Sensors Revenue billion Forecast, by Application 2020 & 2033
- Table 50: Global Smartphone Sensors Volume K Forecast, by Application 2020 & 2033
- Table 51: Global Smartphone Sensors Revenue billion Forecast, by Country 2020 & 2033
- Table 52: Global Smartphone Sensors Volume K Forecast, by Country 2020 & 2033
- Table 53: United Kingdom Smartphone Sensors Revenue (billion) Forecast, by Application 2020 & 2033
- Table 54: United Kingdom Smartphone Sensors Volume (K) Forecast, by Application 2020 & 2033
- Table 55: Germany Smartphone Sensors Revenue (billion) Forecast, by Application 2020 & 2033
- Table 56: Germany Smartphone Sensors Volume (K) Forecast, by Application 2020 & 2033
- Table 57: France Smartphone Sensors Revenue (billion) Forecast, by Application 2020 & 2033
- Table 58: France Smartphone Sensors Volume (K) Forecast, by Application 2020 & 2033
- Table 59: Italy Smartphone Sensors Revenue (billion) Forecast, by Application 2020 & 2033
- Table 60: Italy Smartphone Sensors Volume (K) Forecast, by Application 2020 & 2033
- Table 61: Spain Smartphone Sensors Revenue (billion) Forecast, by Application 2020 & 2033
- Table 62: Spain Smartphone Sensors Volume (K) Forecast, by Application 2020 & 2033
- Table 63: Russia Smartphone Sensors Revenue (billion) Forecast, by Application 2020 & 2033
- Table 64: Russia Smartphone Sensors Volume (K) Forecast, by Application 2020 & 2033
- Table 65: Benelux Smartphone Sensors Revenue (billion) Forecast, by Application 2020 & 2033
- Table 66: Benelux Smartphone Sensors Volume (K) Forecast, by Application 2020 & 2033
- Table 67: Nordics Smartphone Sensors Revenue (billion) Forecast, by Application 2020 & 2033
- Table 68: Nordics Smartphone Sensors Volume (K) Forecast, by Application 2020 & 2033
- Table 69: Rest of Europe Smartphone Sensors Revenue (billion) Forecast, by Application 2020 & 2033
- Table 70: Rest of Europe Smartphone Sensors Volume (K) Forecast, by Application 2020 & 2033
- Table 71: Global Smartphone Sensors Revenue billion Forecast, by Product Type 2020 & 2033
- Table 72: Global Smartphone Sensors Volume K Forecast, by Product Type 2020 & 2033
- Table 73: Global Smartphone Sensors Revenue billion Forecast, by Component 2020 & 2033
- Table 74: Global Smartphone Sensors Volume K Forecast, by Component 2020 & 2033
- Table 75: Global Smartphone Sensors Revenue billion Forecast, by Device Tier 2020 & 2033
- Table 76: Global Smartphone Sensors Volume K Forecast, by Device Tier 2020 & 2033
- Table 77: Global Smartphone Sensors Revenue billion Forecast, by Application 2020 & 2033
- Table 78: Global Smartphone Sensors Volume K Forecast, by Application 2020 & 2033
- Table 79: Global Smartphone Sensors Revenue billion Forecast, by Country 2020 & 2033
- Table 80: Global Smartphone Sensors Volume K Forecast, by Country 2020 & 2033
- Table 81: Turkey Smartphone Sensors Revenue (billion) Forecast, by Application 2020 & 2033
- Table 82: Turkey Smartphone Sensors Volume (K) Forecast, by Application 2020 & 2033
- Table 83: Israel Smartphone Sensors Revenue (billion) Forecast, by Application 2020 & 2033
- Table 84: Israel Smartphone Sensors Volume (K) Forecast, by Application 2020 & 2033
- Table 85: GCC Smartphone Sensors Revenue (billion) Forecast, by Application 2020 & 2033
- Table 86: GCC Smartphone Sensors Volume (K) Forecast, by Application 2020 & 2033
- Table 87: North Africa Smartphone Sensors Revenue (billion) Forecast, by Application 2020 & 2033
- Table 88: North Africa Smartphone Sensors Volume (K) Forecast, by Application 2020 & 2033
- Table 89: South Africa Smartphone Sensors Revenue (billion) Forecast, by Application 2020 & 2033
- Table 90: South Africa Smartphone Sensors Volume (K) Forecast, by Application 2020 & 2033
- Table 91: Rest of Middle East & Africa Smartphone Sensors Revenue (billion) Forecast, by Application 2020 & 2033
- Table 92: Rest of Middle East & Africa Smartphone Sensors Volume (K) Forecast, by Application 2020 & 2033
- Table 93: Global Smartphone Sensors Revenue billion Forecast, by Product Type 2020 & 2033
- Table 94: Global Smartphone Sensors Volume K Forecast, by Product Type 2020 & 2033
- Table 95: Global Smartphone Sensors Revenue billion Forecast, by Component 2020 & 2033
- Table 96: Global Smartphone Sensors Volume K Forecast, by Component 2020 & 2033
- Table 97: Global Smartphone Sensors Revenue billion Forecast, by Device Tier 2020 & 2033
- Table 98: Global Smartphone Sensors Volume K Forecast, by Device Tier 2020 & 2033
- Table 99: Global Smartphone Sensors Revenue billion Forecast, by Application 2020 & 2033
- Table 100: Global Smartphone Sensors Volume K Forecast, by Application 2020 & 2033
- Table 101: Global Smartphone Sensors Revenue billion Forecast, by Country 2020 & 2033
- Table 102: Global Smartphone Sensors Volume K Forecast, by Country 2020 & 2033
- Table 103: China Smartphone Sensors Revenue (billion) Forecast, by Application 2020 & 2033
- Table 104: China Smartphone Sensors Volume (K) Forecast, by Application 2020 & 2033
- Table 105: India Smartphone Sensors Revenue (billion) Forecast, by Application 2020 & 2033
- Table 106: India Smartphone Sensors Volume (K) Forecast, by Application 2020 & 2033
- Table 107: Japan Smartphone Sensors Revenue (billion) Forecast, by Application 2020 & 2033
- Table 108: Japan Smartphone Sensors Volume (K) Forecast, by Application 2020 & 2033
- Table 109: South Korea Smartphone Sensors Revenue (billion) Forecast, by Application 2020 & 2033
- Table 110: South Korea Smartphone Sensors Volume (K) Forecast, by Application 2020 & 2033
- Table 111: ASEAN Smartphone Sensors Revenue (billion) Forecast, by Application 2020 & 2033
- Table 112: ASEAN Smartphone Sensors Volume (K) Forecast, by Application 2020 & 2033
- Table 113: Oceania Smartphone Sensors Revenue (billion) Forecast, by Application 2020 & 2033
- Table 114: Oceania Smartphone Sensors Volume (K) Forecast, by Application 2020 & 2033
- Table 115: Rest of Asia Pacific Smartphone Sensors Revenue (billion) Forecast, by Application 2020 & 2033
- Table 116: Rest of Asia Pacific Smartphone Sensors Volume (K) Forecast, by Application 2020 & 2033
Frequently Asked Questions
1. What is the projected Compound Annual Growth Rate (CAGR) of the Smartphone Sensors?
The projected CAGR is approximately 5.44%.
2. Which companies are prominent players in the Smartphone Sensors?
Key companies in the market include Sony Corporation, Samsung Electronics, STMicroelectronics, ams AG, Infineon Technologies AG, Omron, Bosch Sensortec, TDK Corporation, Broadcom Inc., NXP Semiconductors, Texas Instruments Incorporated, OmniVision Technologies, Inc., Huawei Technologies, Others.
3. What are the main segments of the Smartphone Sensors?
The market segments include Product Type, Component, Device Tier, Application.
4. Can you provide details about the market size?
The market size is estimated to be USD 15.98 billion as of 2022.
5. What are some drivers contributing to market growth?
N/A
6. What are the notable trends driving market growth?
N/A
7. Are there any restraints impacting market growth?
N/A
8. Can you provide examples of recent developments in the market?
N/A
9. What pricing options are available for accessing the report?
Pricing options include single-user, multi-user, and enterprise licenses priced at USD 3950.00, USD 5925.00, and USD 7900.00 respectively.
10. Is the market size provided in terms of value or volume?
The market size is provided in terms of value, measured in billion and volume, measured in K.
11. Are there any specific market keywords associated with the report?
Yes, the market keyword associated with the report is "Smartphone Sensors," which aids in identifying and referencing the specific market segment covered.
12. How do I determine which pricing option suits my needs best?
The pricing options vary based on user requirements and access needs. Individual users may opt for single-user licenses, while businesses requiring broader access may choose multi-user or enterprise licenses for cost-effective access to the report.
13. Are there any additional resources or data provided in the Smartphone Sensors report?
While the report offers comprehensive insights, it's advisable to review the specific contents or supplementary materials provided to ascertain if additional resources or data are available.
14. How can I stay updated on further developments or reports in the Smartphone Sensors?
To stay informed about further developments, trends, and reports in the Smartphone Sensors, consider subscribing to industry newsletters, following relevant companies and organizations, or regularly checking reputable industry news sources and publications.
Methodology
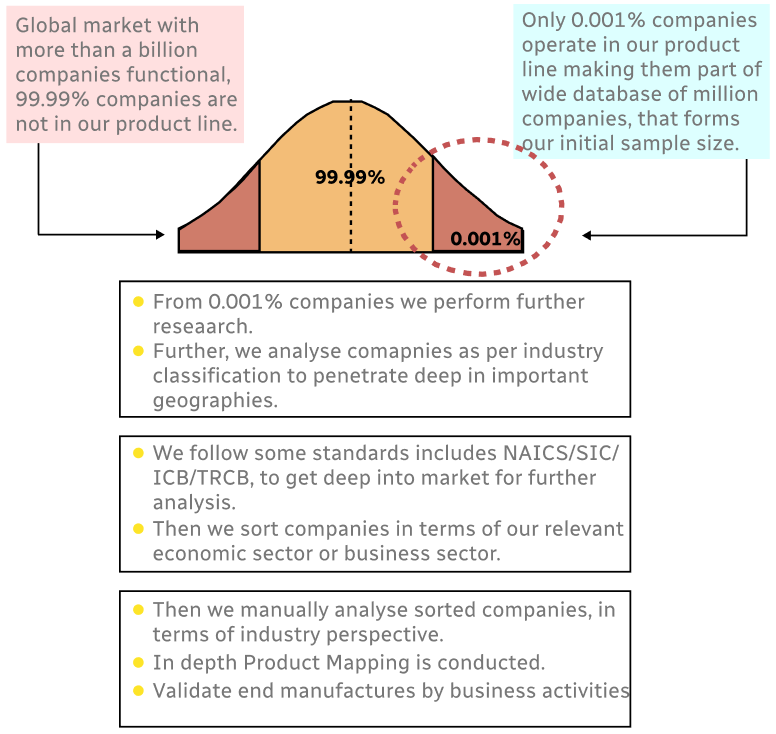
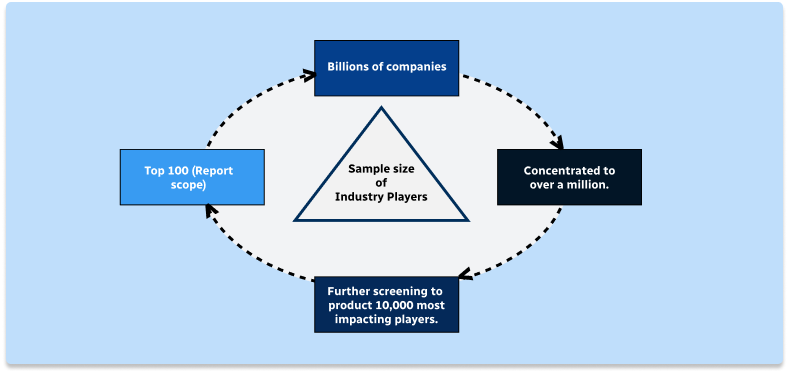
Step 1 - Identification of Relevant Samples Size from Population Database
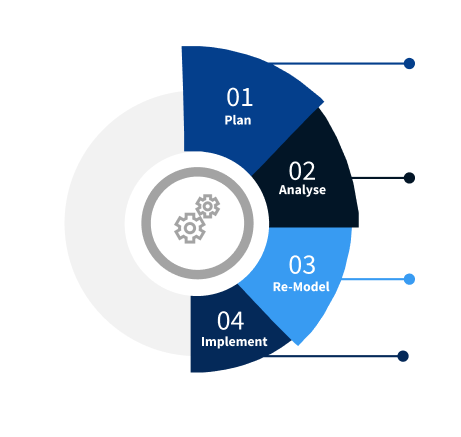
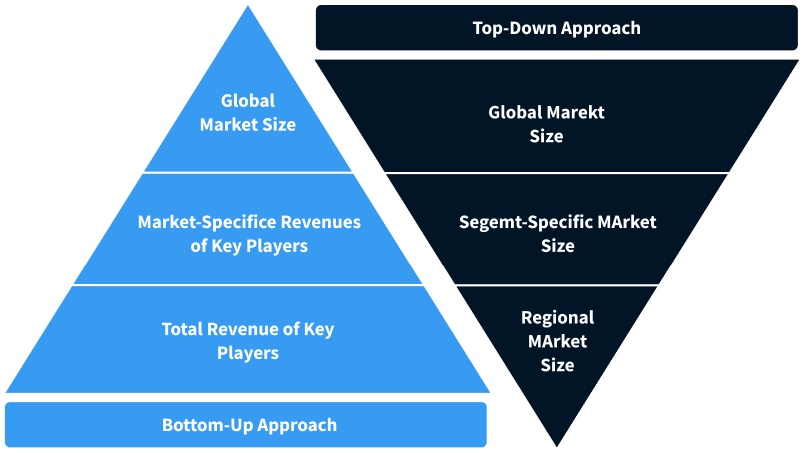
Step 2 - Approaches for Defining Global Market Size (Value, Volume* & Price*)
Note*: In applicable scenarios
Step 3 - Data Sources
Primary Research
- Web Analytics
- Survey Reports
- Research Institute
- Latest Research Reports
- Opinion Leaders
Secondary Research
- Annual Reports
- White Paper
- Latest Press Release
- Industry Association
- Paid Database
- Investor Presentations
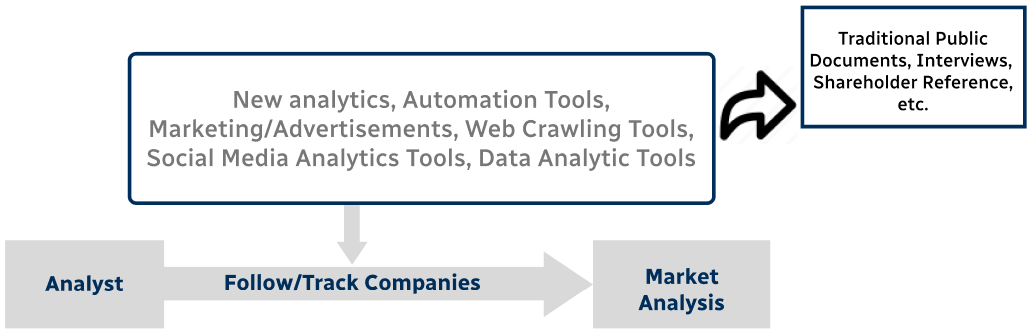
Step 4 - Data Triangulation
Involves using different sources of information in order to increase the validity of a study
These sources are likely to be stakeholders in a program - participants, other researchers, program staff, other community members, and so on.
Then we put all data in single framework & apply various statistical tools to find out the dynamic on the market.
During the analysis stage, feedback from the stakeholder groups would be compared to determine areas of agreement as well as areas of divergence