

Key Insights
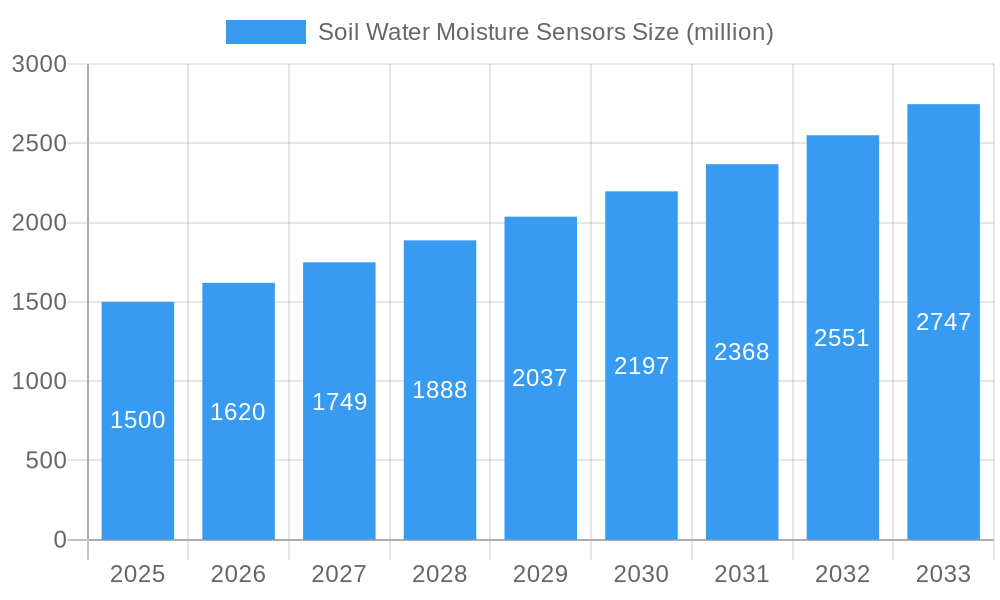
The global soil water moisture sensor market is experiencing robust growth, driven by the increasing demand for precision agriculture and efficient irrigation management. The market, estimated at $1.5 billion in 2025, is projected to expand at a compound annual growth rate (CAGR) of 8% from 2025 to 2033, reaching approximately $2.8 billion by 2033. This growth is fueled by several key factors, including the rising adoption of smart farming technologies, increasing water scarcity in various regions, and government initiatives promoting sustainable agricultural practices. The market is segmented by sensor type (e.g., capacitive, tensiometric, time domain reflectometry), application (e.g., agriculture, horticulture, environmental monitoring), and region. Leading players such as The Toro Company, Rain Bird, and others are actively investing in research and development to improve sensor accuracy, durability, and connectivity, further fueling market expansion.
Soil Water Moisture Sensors Market Size (In Billion)
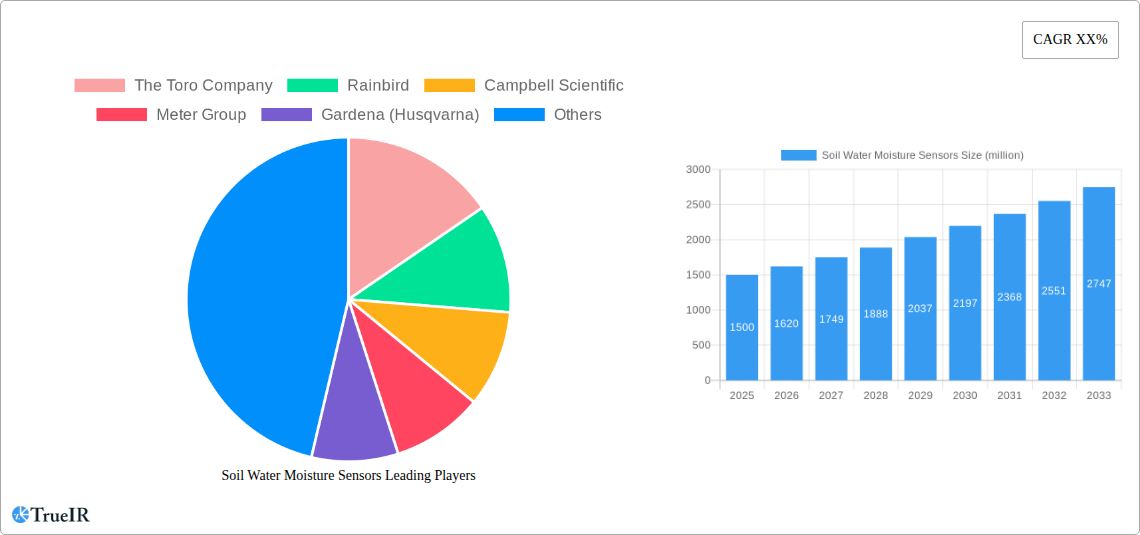
The market's growth trajectory is influenced by several trends. The integration of soil moisture sensors with IoT platforms is enabling real-time data monitoring and automated irrigation systems, leading to optimized water usage and improved crop yields. The development of low-cost, energy-efficient sensors is making the technology more accessible to smallholder farmers. However, the market faces certain restraints, including high initial investment costs for sensor deployment and the need for reliable internet connectivity in remote agricultural areas. Despite these challenges, the long-term prospects for the soil water moisture sensor market remain positive, with continuous technological advancements and increasing awareness of water conservation contributing to sustained market expansion. The diverse range of sensor types offered by companies like Campbell Scientific, Meter Group, and Gardena caters to various needs and budgets, fostering market competitiveness and broadening accessibility across different agricultural practices and scales.
Soil Water Moisture Sensors Company Market Share
Dynamic Soil Water Moisture Sensors Market Report: 2019-2033
This comprehensive report provides a detailed analysis of the global Soil Water Moisture Sensors market, projecting a market size exceeding $XX million by 2033. The study covers the period 2019-2033, with a base year of 2025 and a forecast period of 2025-2033. This in-depth analysis incorporates historical data (2019-2024) and future projections, providing valuable insights for stakeholders across the agricultural technology, environmental monitoring, and irrigation management sectors. Expect detailed analysis of market trends, competitive landscapes, and key growth drivers, empowering businesses to make data-driven decisions.
Soil Water Moisture Sensors Market Structure & Competitive Landscape
The Soil Water Moisture Sensors market exhibits a moderately fragmented structure. While several major players dominate, numerous smaller companies contribute significantly to innovation and niche market segments. The market concentration ratio (CR4) in 2024 was estimated at XX%, indicating a competitive landscape. Key drivers of innovation include the increasing demand for precision agriculture, advancements in sensor technology (e.g., wireless communication, improved accuracy), and the rising adoption of smart irrigation systems. Regulatory impacts vary across regions, with some emphasizing sustainable water management practices, leading to increased demand for efficient irrigation solutions. Substitutes include traditional methods like visual inspection and soil sampling, but these lack the precision and real-time data offered by sensors. The end-user segments include agriculture (largest segment), landscaping, environmental monitoring, and research institutions. M&A activity in the period 2019-2024 witnessed approximately XX million USD in transactions, primarily focused on enhancing technological capabilities and expanding market reach. This activity is predicted to increase, reaching approximately XX million USD between 2025 and 2033.
Soil Water Moisture Sensors Market Trends & Opportunities
The global Soil Water Moisture Sensors market is experiencing robust growth, with a projected Compound Annual Growth Rate (CAGR) of XX% during 2025-2033. This growth is fueled by several factors: the increasing adoption of precision agriculture techniques driven by the need for higher crop yields and improved water-use efficiency; technological advancements, including the development of low-cost, high-precision sensors and wireless communication capabilities; growing government initiatives and subsidies promoting sustainable agriculture and water resource management; and rising consumer awareness regarding environmental sustainability and water conservation. Market penetration remains relatively low in several developing economies, presenting substantial opportunities for market expansion. The competitive landscape is dynamic, with companies continuously investing in R&D to enhance product features and improve market share. The shift towards cloud-based data analytics platforms and the integration of IoT technologies offer significant opportunities for value creation and increased market penetration. By 2033, market penetration in key agricultural regions is expected to reach approximately XX%.
Dominant Markets & Segments in Soil Water Moisture Sensors
The North American region currently dominates the Soil Water Moisture Sensors market, driven by high adoption rates in precision agriculture and advanced irrigation systems. Within this region, the United States holds the largest market share. Key growth drivers in this segment include:
- Robust agricultural sector: High investment in technology and advanced farming practices.
- Favorable government policies: Support for sustainable water management initiatives.
- Strong technological infrastructure: Facilitates widespread adoption of smart irrigation and precision agriculture.
Other regions, including Europe and Asia-Pacific, are experiencing rapid growth, driven by increasing awareness of water scarcity and the rising adoption of precision agriculture techniques. The agricultural segment holds the largest market share, with strong growth expected in the landscaping and environmental monitoring sectors. Increased government funding for research and development in water management technologies is further bolstering market growth in several countries.
Soil Water Moisture Sensors Product Analysis
The market offers a diverse range of soil water moisture sensors, varying in technology (e.g., time domain reflectometry (TDR), capacitance, neutron probes), communication protocols (wired, wireless), and application-specific features. Recent innovations include advancements in sensor miniaturization, improved accuracy and reliability, and the integration of GPS and IoT capabilities for real-time data monitoring and remote management. These advancements cater to the growing demand for precise and efficient water management solutions in diverse settings, from large-scale commercial farms to small-scale horticultural operations.
Key Drivers, Barriers & Challenges in Soil Water Moisture Sensors
Key Drivers: Technological advancements, increasing demand for water-efficient irrigation, government regulations promoting sustainable agriculture, and rising consumer awareness of environmental concerns are key drivers. For example, the development of low-cost, wireless sensors has significantly broadened the market accessibility.
Challenges: High initial investment costs, the need for skilled labor for sensor installation and data interpretation, potential data inaccuracies due to soil heterogeneity, and the complexity of integrating sensors into existing irrigation systems pose significant challenges. Supply chain disruptions, particularly those related to electronic components, have impacted sensor production and availability, resulting in estimated XX million USD in lost revenue in 2024.
Growth Drivers in the Soil Water Moisture Sensors Market
The market's growth is fueled by technological advancements (e.g., improved sensor accuracy, wireless communication), increasing demand for precise irrigation in agriculture and landscaping, government policies promoting water conservation, and rising awareness of environmental sustainability.
Challenges Impacting Soil Water Moisture Sensors Growth
High initial investment costs, potential data inaccuracies due to soil variability, the need for skilled personnel, and supply chain disruptions are key challenges hindering market growth. Regulatory complexities and the availability of competing technologies also pose challenges.
Key Players Shaping the Soil Water Moisture Sensors Market
Significant Soil Water Moisture Sensors Industry Milestones
- 2020: Introduction of low-power, long-range wireless soil moisture sensors by several key players.
- 2021: Several mergers and acquisitions consolidating market share within the industry.
- 2022: Launch of cloud-based data platforms for remote soil moisture monitoring and analysis.
- 2023: Increased regulatory scrutiny on water usage driving adoption of advanced irrigation technologies.
- 2024: Development of next-generation sensors with improved accuracy and durability.
Future Outlook for Soil Water Moisture Sensors Market
The Soil Water Moisture Sensors market is poised for continued growth, driven by technological innovations, increasing demand for sustainable agriculture, and supportive government policies. Strategic opportunities exist in developing low-cost, high-performance sensors targeted at emerging markets. The integration of advanced analytics and AI capabilities for predictive irrigation management will also drive future market expansion. The market is expected to reach over $XX million by 2033, representing substantial growth potential for established and emerging players.
Soil Water Moisture Sensors Segmentation
-
1. Application
- 1.1. Agriculture
- 1.2. Landscaping
- 1.3. Residential
- 1.4. Forestry
- 1.5. Sports Turf
- 1.6. Construction and Mining
- 1.7. Research
- 1.8. Others
-
2. Types
- 2.1. Soil Water Potential
- 2.2. Volumetric
Soil Water Moisture Sensors Segmentation By Geography
-
1. North America
- 1.1. United States
- 1.2. Canada
- 1.3. Mexico
-
2. South America
- 2.1. Brazil
- 2.2. Argentina
- 2.3. Rest of South America
-
3. Europe
- 3.1. United Kingdom
- 3.2. Germany
- 3.3. France
- 3.4. Italy
- 3.5. Spain
- 3.6. Russia
- 3.7. Benelux
- 3.8. Nordics
- 3.9. Rest of Europe
-
4. Middle East & Africa
- 4.1. Turkey
- 4.2. Israel
- 4.3. GCC
- 4.4. North Africa
- 4.5. South Africa
- 4.6. Rest of Middle East & Africa
-
5. Asia Pacific
- 5.1. China
- 5.2. India
- 5.3. Japan
- 5.4. South Korea
- 5.5. ASEAN
- 5.6. Oceania
- 5.7. Rest of Asia Pacific
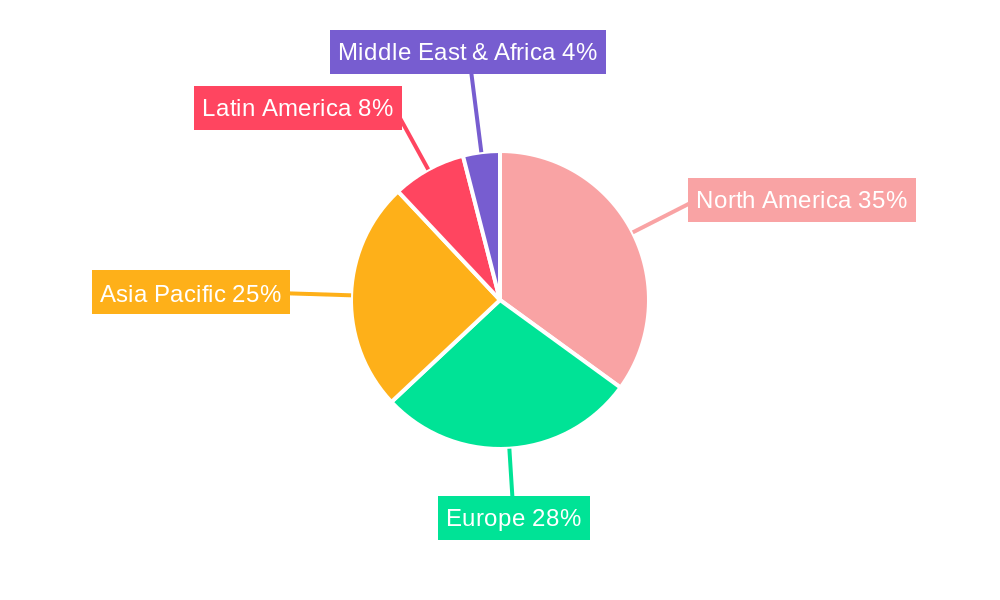
Soil Water Moisture Sensors Regional Market Share
Geographic Coverage of Soil Water Moisture Sensors
Soil Water Moisture Sensors REPORT HIGHLIGHTS
| Aspects | Details |
|---|---|
| Study Period | 2020-2034 |
| Base Year | 2025 |
| Estimated Year | 2026 |
| Forecast Period | 2026-2034 |
| Historical Period | 2020-2025 |
| Growth Rate | CAGR of 14.1% from 2020-2034 |
| Segmentation |
|
Table of Contents
- 1. Introduction
- 1.1. Research Scope
- 1.2. Market Segmentation
- 1.3. Research Objective
- 1.4. Definitions and Assumptions
- 2. Executive Summary
- 2.1. Market Snapshot
- 3. Market Dynamics
- 3.1. Market Drivers
- 3.2. Market Restrains
- 3.3. Market Trends
- 3.4. Market Opportunities
- 4. Market Factor Analysis
- 4.1. Porters Five Forces
- 4.1.1. Bargaining Power of Suppliers
- 4.1.2. Bargaining Power of Buyers
- 4.1.3. Threat of New Entrants
- 4.1.4. Threat of Substitutes
- 4.1.5. Competitive Rivalry
- 4.2. PESTEL analysis
- 4.3. BCG Analysis
- 4.3.1. Stars (High Growth, High Market Share)
- 4.3.2. Cash Cows (Low Growth, High Market Share)
- 4.3.3. Question Mark (High Growth, Low Market Share)
- 4.3.4. Dogs (Low Growth, Low Market Share)
- 4.4. Ansoff Matrix Analysis
- 4.5. Supply Chain Analysis
- 4.6. Regulatory Landscape
- 4.7. Current Market Potential and Opportunity Assessment (TAM–SAM–SOM Framework)
- 4.8. TIR Analyst Note
- 4.1. Porters Five Forces
- 5. Market Analysis, Insights and Forecast 2021-2033
- 5.1. Market Analysis, Insights and Forecast - by Application
- 5.1.1. Agriculture
- 5.1.2. Landscaping
- 5.1.3. Residential
- 5.1.4. Forestry
- 5.1.5. Sports Turf
- 5.1.6. Construction and Mining
- 5.1.7. Research
- 5.1.8. Others
- 5.2. Market Analysis, Insights and Forecast - by Types
- 5.2.1. Soil Water Potential
- 5.2.2. Volumetric
- 5.3. Market Analysis, Insights and Forecast - by Region
- 5.3.1. North America
- 5.3.2. South America
- 5.3.3. Europe
- 5.3.4. Middle East & Africa
- 5.3.5. Asia Pacific
- 5.1. Market Analysis, Insights and Forecast - by Application
- 6. Global Soil Water Moisture Sensors Analysis, Insights and Forecast, 2021-2033
- 6.1. Market Analysis, Insights and Forecast - by Application
- 6.1.1. Agriculture
- 6.1.2. Landscaping
- 6.1.3. Residential
- 6.1.4. Forestry
- 6.1.5. Sports Turf
- 6.1.6. Construction and Mining
- 6.1.7. Research
- 6.1.8. Others
- 6.2. Market Analysis, Insights and Forecast - by Types
- 6.2.1. Soil Water Potential
- 6.2.2. Volumetric
- 6.1. Market Analysis, Insights and Forecast - by Application
- 7. North America Soil Water Moisture Sensors Analysis, Insights and Forecast, 2020-2032
- 7.1. Market Analysis, Insights and Forecast - by Application
- 7.1.1. Agriculture
- 7.1.2. Landscaping
- 7.1.3. Residential
- 7.1.4. Forestry
- 7.1.5. Sports Turf
- 7.1.6. Construction and Mining
- 7.1.7. Research
- 7.1.8. Others
- 7.2. Market Analysis, Insights and Forecast - by Types
- 7.2.1. Soil Water Potential
- 7.2.2. Volumetric
- 7.1. Market Analysis, Insights and Forecast - by Application
- 8. South America Soil Water Moisture Sensors Analysis, Insights and Forecast, 2020-2032
- 8.1. Market Analysis, Insights and Forecast - by Application
- 8.1.1. Agriculture
- 8.1.2. Landscaping
- 8.1.3. Residential
- 8.1.4. Forestry
- 8.1.5. Sports Turf
- 8.1.6. Construction and Mining
- 8.1.7. Research
- 8.1.8. Others
- 8.2. Market Analysis, Insights and Forecast - by Types
- 8.2.1. Soil Water Potential
- 8.2.2. Volumetric
- 8.1. Market Analysis, Insights and Forecast - by Application
- 9. Europe Soil Water Moisture Sensors Analysis, Insights and Forecast, 2020-2032
- 9.1. Market Analysis, Insights and Forecast - by Application
- 9.1.1. Agriculture
- 9.1.2. Landscaping
- 9.1.3. Residential
- 9.1.4. Forestry
- 9.1.5. Sports Turf
- 9.1.6. Construction and Mining
- 9.1.7. Research
- 9.1.8. Others
- 9.2. Market Analysis, Insights and Forecast - by Types
- 9.2.1. Soil Water Potential
- 9.2.2. Volumetric
- 9.1. Market Analysis, Insights and Forecast - by Application
- 10. Middle East & Africa Soil Water Moisture Sensors Analysis, Insights and Forecast, 2020-2032
- 10.1. Market Analysis, Insights and Forecast - by Application
- 10.1.1. Agriculture
- 10.1.2. Landscaping
- 10.1.3. Residential
- 10.1.4. Forestry
- 10.1.5. Sports Turf
- 10.1.6. Construction and Mining
- 10.1.7. Research
- 10.1.8. Others
- 10.2. Market Analysis, Insights and Forecast - by Types
- 10.2.1. Soil Water Potential
- 10.2.2. Volumetric
- 10.1. Market Analysis, Insights and Forecast - by Application
- 11. Asia Pacific Soil Water Moisture Sensors Analysis, Insights and Forecast, 2020-2032
- 11.1. Market Analysis, Insights and Forecast - by Application
- 11.1.1. Agriculture
- 11.1.2. Landscaping
- 11.1.3. Residential
- 11.1.4. Forestry
- 11.1.5. Sports Turf
- 11.1.6. Construction and Mining
- 11.1.7. Research
- 11.1.8. Others
- 11.2. Market Analysis, Insights and Forecast - by Types
- 11.2.1. Soil Water Potential
- 11.2.2. Volumetric
- 11.1. Market Analysis, Insights and Forecast - by Application
- 12. Competitive Analysis
- 12.1. Company Profiles
- 12.1.1 The Toro Company
- 12.1.1.1. Company Overview
- 12.1.1.2. Products
- 12.1.1.3. Company Financials
- 12.1.1.4. SWOT Analysis
- 12.1.2 Rainbird
- 12.1.2.1. Company Overview
- 12.1.2.2. Products
- 12.1.2.3. Company Financials
- 12.1.2.4. SWOT Analysis
- 12.1.3 Campbell Scientific
- 12.1.3.1. Company Overview
- 12.1.3.2. Products
- 12.1.3.3. Company Financials
- 12.1.3.4. SWOT Analysis
- 12.1.4 Meter Group
- 12.1.4.1. Company Overview
- 12.1.4.2. Products
- 12.1.4.3. Company Financials
- 12.1.4.4. SWOT Analysis
- 12.1.5 Gardena (Husqvarna)
- 12.1.5.1. Company Overview
- 12.1.5.2. Products
- 12.1.5.3. Company Financials
- 12.1.5.4. SWOT Analysis
- 12.1.6 Davis Instruments
- 12.1.6.1. Company Overview
- 12.1.6.2. Products
- 12.1.6.3. Company Financials
- 12.1.6.4. SWOT Analysis
- 12.1.7 Vernier
- 12.1.7.1. Company Overview
- 12.1.7.2. Products
- 12.1.7.3. Company Financials
- 12.1.7.4. SWOT Analysis
- 12.1.8 IMKO (Endress+Hauser)
- 12.1.8.1. Company Overview
- 12.1.8.2. Products
- 12.1.8.3. Company Financials
- 12.1.8.4. SWOT Analysis
- 12.1.9 Dynamax
- 12.1.9.1. Company Overview
- 12.1.9.2. Products
- 12.1.9.3. Company Financials
- 12.1.9.4. SWOT Analysis
- 12.1.10 Irrometer
- 12.1.10.1. Company Overview
- 12.1.10.2. Products
- 12.1.10.3. Company Financials
- 12.1.10.4. SWOT Analysis
- 12.1.11 Delta-T Devices
- 12.1.11.1. Company Overview
- 12.1.11.2. Products
- 12.1.11.3. Company Financials
- 12.1.11.4. SWOT Analysis
- 12.1.12 Stevens Water
- 12.1.12.1. Company Overview
- 12.1.12.2. Products
- 12.1.12.3. Company Financials
- 12.1.12.4. SWOT Analysis
- 12.1.13 Vegetronix
- 12.1.13.1. Company Overview
- 12.1.13.2. Products
- 12.1.13.3. Company Financials
- 12.1.13.4. SWOT Analysis
- 12.1.14 Acclima
- 12.1.14.1. Company Overview
- 12.1.14.2. Products
- 12.1.14.3. Company Financials
- 12.1.14.4. SWOT Analysis
- 12.1.1 The Toro Company
- 12.2. Market Entropy
- 12.2.1 Company's Key Areas Served
- 12.2.2 Recent Developments
- 12.3. Company Market Share Analysis 2025
- 12.3.1 Top 5 Companies Market Share Analysis
- 12.3.2 Top 3 Companies Market Share Analysis
- 12.4. List of Potential Customers
- 13. Research Methodology
List of Figures
- Figure 1: Global Soil Water Moisture Sensors Revenue Breakdown (undefined, %) by Region 2025 & 2033
- Figure 2: Global Soil Water Moisture Sensors Volume Breakdown (K, %) by Region 2025 & 2033
- Figure 3: North America Soil Water Moisture Sensors Revenue (undefined), by Application 2025 & 2033
- Figure 4: North America Soil Water Moisture Sensors Volume (K), by Application 2025 & 2033
- Figure 5: North America Soil Water Moisture Sensors Revenue Share (%), by Application 2025 & 2033
- Figure 6: North America Soil Water Moisture Sensors Volume Share (%), by Application 2025 & 2033
- Figure 7: North America Soil Water Moisture Sensors Revenue (undefined), by Types 2025 & 2033
- Figure 8: North America Soil Water Moisture Sensors Volume (K), by Types 2025 & 2033
- Figure 9: North America Soil Water Moisture Sensors Revenue Share (%), by Types 2025 & 2033
- Figure 10: North America Soil Water Moisture Sensors Volume Share (%), by Types 2025 & 2033
- Figure 11: North America Soil Water Moisture Sensors Revenue (undefined), by Country 2025 & 2033
- Figure 12: North America Soil Water Moisture Sensors Volume (K), by Country 2025 & 2033
- Figure 13: North America Soil Water Moisture Sensors Revenue Share (%), by Country 2025 & 2033
- Figure 14: North America Soil Water Moisture Sensors Volume Share (%), by Country 2025 & 2033
- Figure 15: South America Soil Water Moisture Sensors Revenue (undefined), by Application 2025 & 2033
- Figure 16: South America Soil Water Moisture Sensors Volume (K), by Application 2025 & 2033
- Figure 17: South America Soil Water Moisture Sensors Revenue Share (%), by Application 2025 & 2033
- Figure 18: South America Soil Water Moisture Sensors Volume Share (%), by Application 2025 & 2033
- Figure 19: South America Soil Water Moisture Sensors Revenue (undefined), by Types 2025 & 2033
- Figure 20: South America Soil Water Moisture Sensors Volume (K), by Types 2025 & 2033
- Figure 21: South America Soil Water Moisture Sensors Revenue Share (%), by Types 2025 & 2033
- Figure 22: South America Soil Water Moisture Sensors Volume Share (%), by Types 2025 & 2033
- Figure 23: South America Soil Water Moisture Sensors Revenue (undefined), by Country 2025 & 2033
- Figure 24: South America Soil Water Moisture Sensors Volume (K), by Country 2025 & 2033
- Figure 25: South America Soil Water Moisture Sensors Revenue Share (%), by Country 2025 & 2033
- Figure 26: South America Soil Water Moisture Sensors Volume Share (%), by Country 2025 & 2033
- Figure 27: Europe Soil Water Moisture Sensors Revenue (undefined), by Application 2025 & 2033
- Figure 28: Europe Soil Water Moisture Sensors Volume (K), by Application 2025 & 2033
- Figure 29: Europe Soil Water Moisture Sensors Revenue Share (%), by Application 2025 & 2033
- Figure 30: Europe Soil Water Moisture Sensors Volume Share (%), by Application 2025 & 2033
- Figure 31: Europe Soil Water Moisture Sensors Revenue (undefined), by Types 2025 & 2033
- Figure 32: Europe Soil Water Moisture Sensors Volume (K), by Types 2025 & 2033
- Figure 33: Europe Soil Water Moisture Sensors Revenue Share (%), by Types 2025 & 2033
- Figure 34: Europe Soil Water Moisture Sensors Volume Share (%), by Types 2025 & 2033
- Figure 35: Europe Soil Water Moisture Sensors Revenue (undefined), by Country 2025 & 2033
- Figure 36: Europe Soil Water Moisture Sensors Volume (K), by Country 2025 & 2033
- Figure 37: Europe Soil Water Moisture Sensors Revenue Share (%), by Country 2025 & 2033
- Figure 38: Europe Soil Water Moisture Sensors Volume Share (%), by Country 2025 & 2033
- Figure 39: Middle East & Africa Soil Water Moisture Sensors Revenue (undefined), by Application 2025 & 2033
- Figure 40: Middle East & Africa Soil Water Moisture Sensors Volume (K), by Application 2025 & 2033
- Figure 41: Middle East & Africa Soil Water Moisture Sensors Revenue Share (%), by Application 2025 & 2033
- Figure 42: Middle East & Africa Soil Water Moisture Sensors Volume Share (%), by Application 2025 & 2033
- Figure 43: Middle East & Africa Soil Water Moisture Sensors Revenue (undefined), by Types 2025 & 2033
- Figure 44: Middle East & Africa Soil Water Moisture Sensors Volume (K), by Types 2025 & 2033
- Figure 45: Middle East & Africa Soil Water Moisture Sensors Revenue Share (%), by Types 2025 & 2033
- Figure 46: Middle East & Africa Soil Water Moisture Sensors Volume Share (%), by Types 2025 & 2033
- Figure 47: Middle East & Africa Soil Water Moisture Sensors Revenue (undefined), by Country 2025 & 2033
- Figure 48: Middle East & Africa Soil Water Moisture Sensors Volume (K), by Country 2025 & 2033
- Figure 49: Middle East & Africa Soil Water Moisture Sensors Revenue Share (%), by Country 2025 & 2033
- Figure 50: Middle East & Africa Soil Water Moisture Sensors Volume Share (%), by Country 2025 & 2033
- Figure 51: Asia Pacific Soil Water Moisture Sensors Revenue (undefined), by Application 2025 & 2033
- Figure 52: Asia Pacific Soil Water Moisture Sensors Volume (K), by Application 2025 & 2033
- Figure 53: Asia Pacific Soil Water Moisture Sensors Revenue Share (%), by Application 2025 & 2033
- Figure 54: Asia Pacific Soil Water Moisture Sensors Volume Share (%), by Application 2025 & 2033
- Figure 55: Asia Pacific Soil Water Moisture Sensors Revenue (undefined), by Types 2025 & 2033
- Figure 56: Asia Pacific Soil Water Moisture Sensors Volume (K), by Types 2025 & 2033
- Figure 57: Asia Pacific Soil Water Moisture Sensors Revenue Share (%), by Types 2025 & 2033
- Figure 58: Asia Pacific Soil Water Moisture Sensors Volume Share (%), by Types 2025 & 2033
- Figure 59: Asia Pacific Soil Water Moisture Sensors Revenue (undefined), by Country 2025 & 2033
- Figure 60: Asia Pacific Soil Water Moisture Sensors Volume (K), by Country 2025 & 2033
- Figure 61: Asia Pacific Soil Water Moisture Sensors Revenue Share (%), by Country 2025 & 2033
- Figure 62: Asia Pacific Soil Water Moisture Sensors Volume Share (%), by Country 2025 & 2033
List of Tables
- Table 1: Global Soil Water Moisture Sensors Revenue undefined Forecast, by Application 2020 & 2033
- Table 2: Global Soil Water Moisture Sensors Volume K Forecast, by Application 2020 & 2033
- Table 3: Global Soil Water Moisture Sensors Revenue undefined Forecast, by Types 2020 & 2033
- Table 4: Global Soil Water Moisture Sensors Volume K Forecast, by Types 2020 & 2033
- Table 5: Global Soil Water Moisture Sensors Revenue undefined Forecast, by Region 2020 & 2033
- Table 6: Global Soil Water Moisture Sensors Volume K Forecast, by Region 2020 & 2033
- Table 7: Global Soil Water Moisture Sensors Revenue undefined Forecast, by Application 2020 & 2033
- Table 8: Global Soil Water Moisture Sensors Volume K Forecast, by Application 2020 & 2033
- Table 9: Global Soil Water Moisture Sensors Revenue undefined Forecast, by Types 2020 & 2033
- Table 10: Global Soil Water Moisture Sensors Volume K Forecast, by Types 2020 & 2033
- Table 11: Global Soil Water Moisture Sensors Revenue undefined Forecast, by Country 2020 & 2033
- Table 12: Global Soil Water Moisture Sensors Volume K Forecast, by Country 2020 & 2033
- Table 13: United States Soil Water Moisture Sensors Revenue (undefined) Forecast, by Application 2020 & 2033
- Table 14: United States Soil Water Moisture Sensors Volume (K) Forecast, by Application 2020 & 2033
- Table 15: Canada Soil Water Moisture Sensors Revenue (undefined) Forecast, by Application 2020 & 2033
- Table 16: Canada Soil Water Moisture Sensors Volume (K) Forecast, by Application 2020 & 2033
- Table 17: Mexico Soil Water Moisture Sensors Revenue (undefined) Forecast, by Application 2020 & 2033
- Table 18: Mexico Soil Water Moisture Sensors Volume (K) Forecast, by Application 2020 & 2033
- Table 19: Global Soil Water Moisture Sensors Revenue undefined Forecast, by Application 2020 & 2033
- Table 20: Global Soil Water Moisture Sensors Volume K Forecast, by Application 2020 & 2033
- Table 21: Global Soil Water Moisture Sensors Revenue undefined Forecast, by Types 2020 & 2033
- Table 22: Global Soil Water Moisture Sensors Volume K Forecast, by Types 2020 & 2033
- Table 23: Global Soil Water Moisture Sensors Revenue undefined Forecast, by Country 2020 & 2033
- Table 24: Global Soil Water Moisture Sensors Volume K Forecast, by Country 2020 & 2033
- Table 25: Brazil Soil Water Moisture Sensors Revenue (undefined) Forecast, by Application 2020 & 2033
- Table 26: Brazil Soil Water Moisture Sensors Volume (K) Forecast, by Application 2020 & 2033
- Table 27: Argentina Soil Water Moisture Sensors Revenue (undefined) Forecast, by Application 2020 & 2033
- Table 28: Argentina Soil Water Moisture Sensors Volume (K) Forecast, by Application 2020 & 2033
- Table 29: Rest of South America Soil Water Moisture Sensors Revenue (undefined) Forecast, by Application 2020 & 2033
- Table 30: Rest of South America Soil Water Moisture Sensors Volume (K) Forecast, by Application 2020 & 2033
- Table 31: Global Soil Water Moisture Sensors Revenue undefined Forecast, by Application 2020 & 2033
- Table 32: Global Soil Water Moisture Sensors Volume K Forecast, by Application 2020 & 2033
- Table 33: Global Soil Water Moisture Sensors Revenue undefined Forecast, by Types 2020 & 2033
- Table 34: Global Soil Water Moisture Sensors Volume K Forecast, by Types 2020 & 2033
- Table 35: Global Soil Water Moisture Sensors Revenue undefined Forecast, by Country 2020 & 2033
- Table 36: Global Soil Water Moisture Sensors Volume K Forecast, by Country 2020 & 2033
- Table 37: United Kingdom Soil Water Moisture Sensors Revenue (undefined) Forecast, by Application 2020 & 2033
- Table 38: United Kingdom Soil Water Moisture Sensors Volume (K) Forecast, by Application 2020 & 2033
- Table 39: Germany Soil Water Moisture Sensors Revenue (undefined) Forecast, by Application 2020 & 2033
- Table 40: Germany Soil Water Moisture Sensors Volume (K) Forecast, by Application 2020 & 2033
- Table 41: France Soil Water Moisture Sensors Revenue (undefined) Forecast, by Application 2020 & 2033
- Table 42: France Soil Water Moisture Sensors Volume (K) Forecast, by Application 2020 & 2033
- Table 43: Italy Soil Water Moisture Sensors Revenue (undefined) Forecast, by Application 2020 & 2033
- Table 44: Italy Soil Water Moisture Sensors Volume (K) Forecast, by Application 2020 & 2033
- Table 45: Spain Soil Water Moisture Sensors Revenue (undefined) Forecast, by Application 2020 & 2033
- Table 46: Spain Soil Water Moisture Sensors Volume (K) Forecast, by Application 2020 & 2033
- Table 47: Russia Soil Water Moisture Sensors Revenue (undefined) Forecast, by Application 2020 & 2033
- Table 48: Russia Soil Water Moisture Sensors Volume (K) Forecast, by Application 2020 & 2033
- Table 49: Benelux Soil Water Moisture Sensors Revenue (undefined) Forecast, by Application 2020 & 2033
- Table 50: Benelux Soil Water Moisture Sensors Volume (K) Forecast, by Application 2020 & 2033
- Table 51: Nordics Soil Water Moisture Sensors Revenue (undefined) Forecast, by Application 2020 & 2033
- Table 52: Nordics Soil Water Moisture Sensors Volume (K) Forecast, by Application 2020 & 2033
- Table 53: Rest of Europe Soil Water Moisture Sensors Revenue (undefined) Forecast, by Application 2020 & 2033
- Table 54: Rest of Europe Soil Water Moisture Sensors Volume (K) Forecast, by Application 2020 & 2033
- Table 55: Global Soil Water Moisture Sensors Revenue undefined Forecast, by Application 2020 & 2033
- Table 56: Global Soil Water Moisture Sensors Volume K Forecast, by Application 2020 & 2033
- Table 57: Global Soil Water Moisture Sensors Revenue undefined Forecast, by Types 2020 & 2033
- Table 58: Global Soil Water Moisture Sensors Volume K Forecast, by Types 2020 & 2033
- Table 59: Global Soil Water Moisture Sensors Revenue undefined Forecast, by Country 2020 & 2033
- Table 60: Global Soil Water Moisture Sensors Volume K Forecast, by Country 2020 & 2033
- Table 61: Turkey Soil Water Moisture Sensors Revenue (undefined) Forecast, by Application 2020 & 2033
- Table 62: Turkey Soil Water Moisture Sensors Volume (K) Forecast, by Application 2020 & 2033
- Table 63: Israel Soil Water Moisture Sensors Revenue (undefined) Forecast, by Application 2020 & 2033
- Table 64: Israel Soil Water Moisture Sensors Volume (K) Forecast, by Application 2020 & 2033
- Table 65: GCC Soil Water Moisture Sensors Revenue (undefined) Forecast, by Application 2020 & 2033
- Table 66: GCC Soil Water Moisture Sensors Volume (K) Forecast, by Application 2020 & 2033
- Table 67: North Africa Soil Water Moisture Sensors Revenue (undefined) Forecast, by Application 2020 & 2033
- Table 68: North Africa Soil Water Moisture Sensors Volume (K) Forecast, by Application 2020 & 2033
- Table 69: South Africa Soil Water Moisture Sensors Revenue (undefined) Forecast, by Application 2020 & 2033
- Table 70: South Africa Soil Water Moisture Sensors Volume (K) Forecast, by Application 2020 & 2033
- Table 71: Rest of Middle East & Africa Soil Water Moisture Sensors Revenue (undefined) Forecast, by Application 2020 & 2033
- Table 72: Rest of Middle East & Africa Soil Water Moisture Sensors Volume (K) Forecast, by Application 2020 & 2033
- Table 73: Global Soil Water Moisture Sensors Revenue undefined Forecast, by Application 2020 & 2033
- Table 74: Global Soil Water Moisture Sensors Volume K Forecast, by Application 2020 & 2033
- Table 75: Global Soil Water Moisture Sensors Revenue undefined Forecast, by Types 2020 & 2033
- Table 76: Global Soil Water Moisture Sensors Volume K Forecast, by Types 2020 & 2033
- Table 77: Global Soil Water Moisture Sensors Revenue undefined Forecast, by Country 2020 & 2033
- Table 78: Global Soil Water Moisture Sensors Volume K Forecast, by Country 2020 & 2033
- Table 79: China Soil Water Moisture Sensors Revenue (undefined) Forecast, by Application 2020 & 2033
- Table 80: China Soil Water Moisture Sensors Volume (K) Forecast, by Application 2020 & 2033
- Table 81: India Soil Water Moisture Sensors Revenue (undefined) Forecast, by Application 2020 & 2033
- Table 82: India Soil Water Moisture Sensors Volume (K) Forecast, by Application 2020 & 2033
- Table 83: Japan Soil Water Moisture Sensors Revenue (undefined) Forecast, by Application 2020 & 2033
- Table 84: Japan Soil Water Moisture Sensors Volume (K) Forecast, by Application 2020 & 2033
- Table 85: South Korea Soil Water Moisture Sensors Revenue (undefined) Forecast, by Application 2020 & 2033
- Table 86: South Korea Soil Water Moisture Sensors Volume (K) Forecast, by Application 2020 & 2033
- Table 87: ASEAN Soil Water Moisture Sensors Revenue (undefined) Forecast, by Application 2020 & 2033
- Table 88: ASEAN Soil Water Moisture Sensors Volume (K) Forecast, by Application 2020 & 2033
- Table 89: Oceania Soil Water Moisture Sensors Revenue (undefined) Forecast, by Application 2020 & 2033
- Table 90: Oceania Soil Water Moisture Sensors Volume (K) Forecast, by Application 2020 & 2033
- Table 91: Rest of Asia Pacific Soil Water Moisture Sensors Revenue (undefined) Forecast, by Application 2020 & 2033
- Table 92: Rest of Asia Pacific Soil Water Moisture Sensors Volume (K) Forecast, by Application 2020 & 2033
Frequently Asked Questions
1. What is the projected Compound Annual Growth Rate (CAGR) of the Soil Water Moisture Sensors?
The projected CAGR is approximately 14.1%.
2. Which companies are prominent players in the Soil Water Moisture Sensors?
Key companies in the market include The Toro Company, Rainbird, Campbell Scientific, Meter Group, Gardena (Husqvarna), Davis Instruments, Vernier, IMKO (Endress+Hauser), Dynamax, Irrometer, Delta-T Devices, Stevens Water, Vegetronix, Acclima.
3. What are the main segments of the Soil Water Moisture Sensors?
The market segments include Application, Types.
4. Can you provide details about the market size?
The market size is estimated to be USD XXX N/A as of 2022.
5. What are some drivers contributing to market growth?
N/A
6. What are the notable trends driving market growth?
N/A
7. Are there any restraints impacting market growth?
N/A
8. Can you provide examples of recent developments in the market?
N/A
9. What pricing options are available for accessing the report?
Pricing options include single-user, multi-user, and enterprise licenses priced at USD 4900.00, USD 7350.00, and USD 9800.00 respectively.
10. Is the market size provided in terms of value or volume?
The market size is provided in terms of value, measured in N/A and volume, measured in K.
11. Are there any specific market keywords associated with the report?
Yes, the market keyword associated with the report is "Soil Water Moisture Sensors," which aids in identifying and referencing the specific market segment covered.
12. How do I determine which pricing option suits my needs best?
The pricing options vary based on user requirements and access needs. Individual users may opt for single-user licenses, while businesses requiring broader access may choose multi-user or enterprise licenses for cost-effective access to the report.
13. Are there any additional resources or data provided in the Soil Water Moisture Sensors report?
While the report offers comprehensive insights, it's advisable to review the specific contents or supplementary materials provided to ascertain if additional resources or data are available.
14. How can I stay updated on further developments or reports in the Soil Water Moisture Sensors?
To stay informed about further developments, trends, and reports in the Soil Water Moisture Sensors, consider subscribing to industry newsletters, following relevant companies and organizations, or regularly checking reputable industry news sources and publications.
Methodology
Step 1 - Identification of Relevant Samples Size from Population Database


Step 2 - Approaches for Defining Global Market Size (Value, Volume* & Price*)

Note*: In applicable scenarios
Step 3 - Data Sources
Primary Research
- Web Analytics
- Survey Reports
- Research Institute
- Latest Research Reports
- Opinion Leaders
Secondary Research
- Annual Reports
- White Paper
- Latest Press Release
- Industry Association
- Paid Database
- Investor Presentations

Step 4 - Data Triangulation
Involves using different sources of information in order to increase the validity of a study
These sources are likely to be stakeholders in a program - participants, other researchers, program staff, other community members, and so on.
Then we put all data in single framework & apply various statistical tools to find out the dynamic on the market.
During the analysis stage, feedback from the stakeholder groups would be compared to determine areas of agreement as well as areas of divergence