

Key Insights
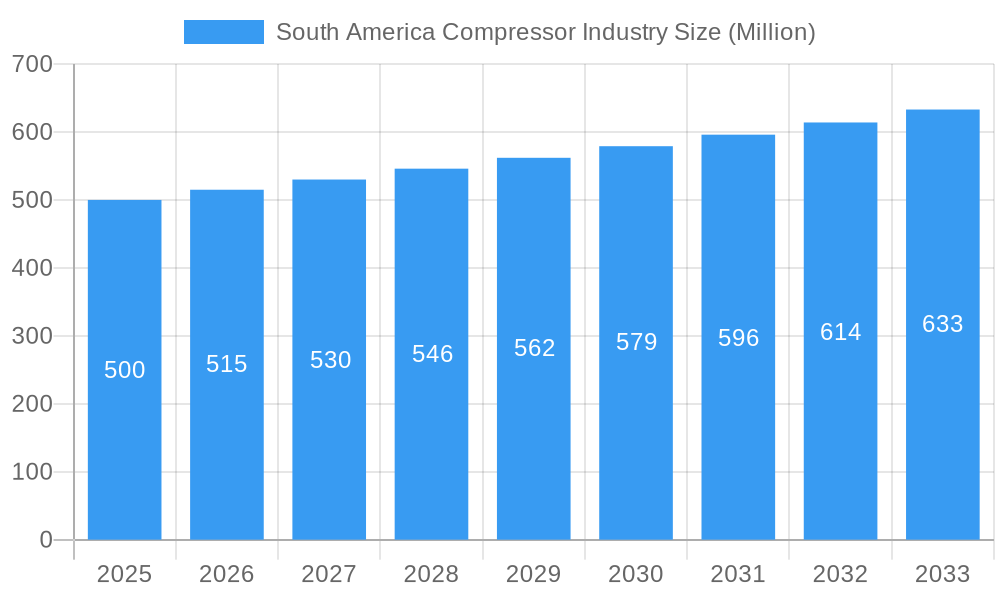
The South American compressor market, valued at 1445.4 million in 2024, is poised for robust expansion. This growth is primarily driven by the thriving oil and gas sector, with Brazil and Argentina leading the surge. Significant investments in infrastructure development and escalating energy demand across manufacturing and power generation industries are key market accelerators. The region's preference for positive displacement compressors, coupled with a growing adoption of energy-efficient dynamic compressor technologies, highlights a dynamic market evolution. Despite economic volatilities and potential regulatory challenges, the long-term outlook is optimistic, forecasting a Compound Annual Growth Rate (CAGR) of 4%. Growth is expected to be concentrated in sectors demanding high-pressure and high-volume air compression, including petrochemical facilities and industrial manufacturing plants.
South America Compressor Industry Market Size (In Billion)
Further market expansion will be spurred by the integration of advanced compressor technologies prioritizing energy efficiency and environmental sustainability. Key industry players such as Trane Technologies, Ebara Corporation, and Atlas Copco, alongside prominent regional manufacturers, are strategically positioned to capitalize on this growth by catering to the specific requirements of South American industries. The market's future trajectory will be significantly influenced by government industrial development policies, renewable energy infrastructure investments, and the overall economic stability of major regional economies. The "Rest of South America" segment offers substantial untapped potential for market penetration, driven by ongoing infrastructure development and industrialization that currently trail behind Brazil and Argentina.
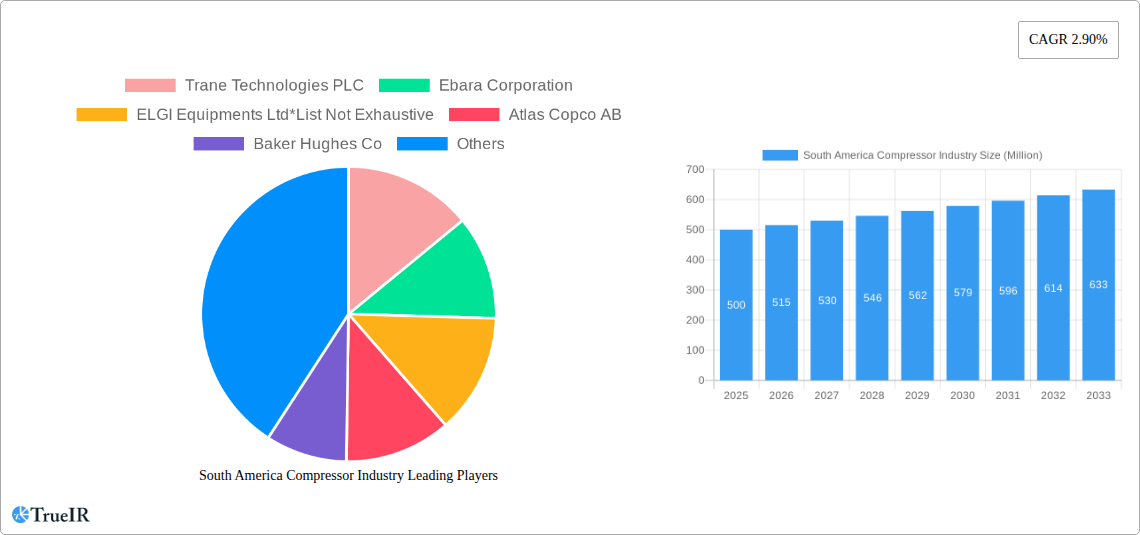
South America Compressor Industry Company Market Share
South America Compressor Industry Market Report: 2019-2033
This comprehensive report provides an in-depth analysis of the South America compressor industry, offering invaluable insights for businesses, investors, and stakeholders. Covering the period from 2019 to 2033, with a focus on 2025, this report leverages extensive market research to project future trends and opportunities. Expect detailed breakdowns of market segmentation, competitive landscapes, and key growth drivers, all presented with robust data and analysis.
South America Compressor Industry Market Structure & Competitive Landscape
The South American compressor market exhibits a moderately consolidated structure, with a few major players holding significant market share. Concentration ratios, while varying across segments, are estimated to be around xx% for the overall market in 2025. Key players such as Trane Technologies PLC, Ebara Corporation, ELGI Equipments Ltd, Atlas Copco AB, Baker Hughes Co, Aerzener Maschinenfabrik GmbH, Siemens AG, Schulz S A, and General Electric Company drive innovation through continuous product development and technological advancements.
Regulatory landscapes vary across South American nations, impacting market dynamics. Product substitution is currently limited, with specialized compressors dominating specific end-use sectors. The Oil & Gas industry remains a dominant end-user segment, driving significant demand. M&A activity has been relatively low in recent years, with an estimated xx Million USD in deal volume during 2019-2024. However, increasing consolidation is anticipated in the coming years.
- Market Concentration: xx% in 2025 (estimated)
- Innovation Drivers: Technological advancements, evolving end-user demands
- Regulatory Impacts: Varying across countries, impacting market access and compliance
- Product Substitutes: Limited substitution currently observed
- End-User Segmentation: Oil & Gas, Power, Manufacturing, Chemicals & Petrochemicals, Other
- M&A Trends: Low activity (2019-2024), anticipated increase in future years
South America Compressor Industry Market Trends & Opportunities
The South American compressor market is poised for robust growth, with an estimated Compound Annual Growth Rate (CAGR) of xx% during the forecast period (2025-2033). Market size is projected to reach xx Million USD by 2033, driven by expanding industrial sectors, particularly oil and gas exploration and production, power generation projects, and rising manufacturing activities. Technological shifts towards energy-efficient compressors and digitalization are transforming the industry, creating new opportunities for players offering advanced solutions. Consumer preference is shifting towards higher efficiency and lower maintenance products. Market penetration rates are expected to increase significantly, particularly in the less-developed regions of South America. Competitive dynamics will continue to shape the landscape with increased focus on technological differentiation and value-added services.
Dominant Markets & Segments in South America Compressor Industry
The Brazilian market holds the largest share of the South American compressor industry, followed by Colombia and Argentina. Within compressor types, positive displacement compressors dominate, catering to various end-use segments. The Oil and Gas industry is the leading end-user segment, driven by large-scale projects and exploration activities.
- Key Growth Drivers:
- Brazil: Robust industrial growth, government investment in infrastructure
- Oil & Gas Industry: Exploration and production activities, LNG projects (like the YPF/Petronas LNG plant)
- Positive Displacement Compressors: Versatility and suitability for high-pressure applications
- Market Dominance: Brazil (largest market share), Oil & Gas (leading end-user)
South America Compressor Industry Product Analysis
Technological advancements are focused on increasing efficiency, reducing energy consumption, and enhancing reliability. Innovations like variable speed drives, advanced cooling systems, and digital monitoring are driving product differentiation. The market is witnessing a growing demand for customized compressors tailored to specific end-user requirements. This focus on niche applications and industry-specific solutions, coupled with the increasing emphasis on energy-efficient solutions, is driving the adoption of new compressor technologies.
Key Drivers, Barriers & Challenges in South America Compressor Industry
Key Drivers:
- Expanding industrial sectors (Oil & Gas, Power Generation, Manufacturing)
- Infrastructure development projects (pipelines, power plants)
- Government initiatives promoting industrialization and energy efficiency.
- Technological advancements in compressor technology, offering higher efficiency and reliability.
Challenges:
- Economic volatility and fluctuating energy prices
- Supply chain disruptions impacting component availability and costs, creating potential delays in production and impacting overall project timelines.
- Regulatory hurdles and varying standards across different South American countries, posing challenges for standardization and regulatory compliance.
- Intense competition, particularly from established international players.
Growth Drivers in the South America Compressor Industry Market
The South American compressor market is driven by sustained growth in various sectors such as oil & gas, power generation, and manufacturing. Government investments in infrastructure projects and policies supporting energy efficiency further enhance market potential. Technological advancements in compressor design, offering greater energy efficiency and reliability, are also key drivers.
Challenges Impacting South America Compressor Industry Growth
Economic instability and fluctuating energy prices in some South American countries pose significant challenges. Supply chain disruptions and the complexity of navigating diverse regulatory environments across the region represent notable restraints. Furthermore, intense competition from established international players and local competitors can impede growth for individual companies.
Key Players Shaping the South America Compressor Industry Market
- Trane Technologies PLC
- Ebara Corporation
- ELGI Equipments Ltd
- Atlas Copco AB
- Baker Hughes Co
- Aerzener Maschinenfabrik GmbH
- Siemens AG
- Schulz S A
- General Electric Company
Significant South America Compressor Industry Industry Milestones
- September 2022: YPF and Petronas' USD 10 Billion LNG plant and pipeline project announcement significantly boosts long-term demand for compressors in the Oil & Gas sector. This project alone is expected to generate demand for xx Million USD worth of compressors.
- January 2023: Compass Gás e Energia's USD 140 Million LNG regasification terminal in São Paulo further strengthens the LNG market and related compressor demand, with estimated compressor purchases reaching xx Million USD.
Future Outlook for South America Compressor Industry Market
The South American compressor market anticipates sustained growth, driven by continuous industrial expansion, infrastructure development, and technological advancements. Strategic opportunities lie in developing energy-efficient solutions and catering to niche market segments. The expanding energy sector and increasing demand from various industrial sectors will continue to drive significant market expansion in the coming years.
South America Compressor Industry Segmentation
-
1. Type
- 1.1. Positive Diplacement
- 1.2. Dynamic
-
2. End User
- 2.1. Oil and Gas Industry
- 2.2. Power Sector
- 2.3. Manufacturing Sector
- 2.4. Chemicals and Petrochemical Industry
- 2.5. Other End Users
-
3. Geography
- 3.1. Brazil
- 3.2. Argentina
- 3.3. Rest of South America
South America Compressor Industry Segmentation By Geography
- 1. Brazil
- 2. Argentina
- 3. Rest of South America
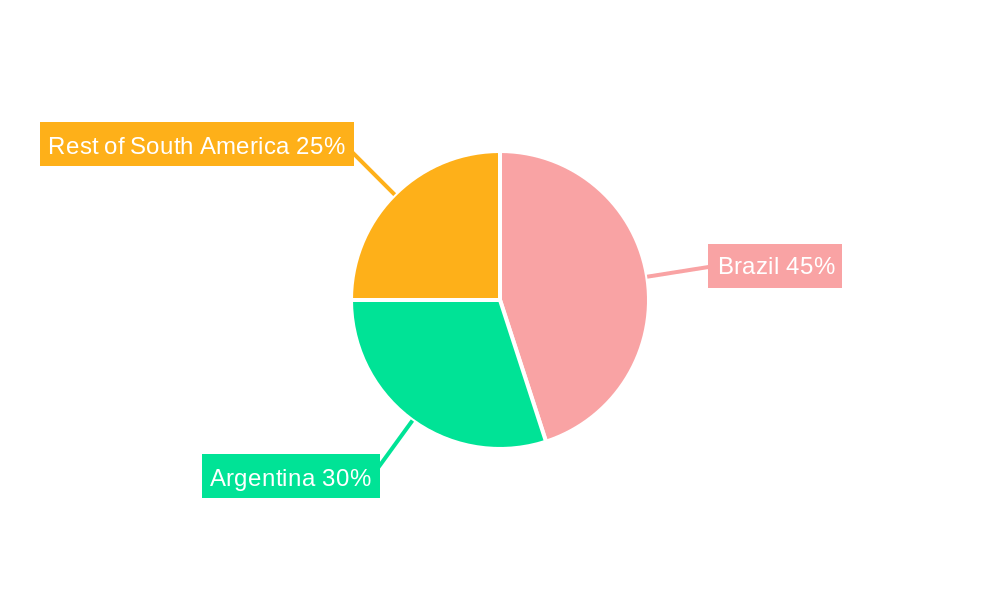
South America Compressor Industry Regional Market Share
Geographic Coverage of South America Compressor Industry
South America Compressor Industry REPORT HIGHLIGHTS
| Aspects | Details |
|---|---|
| Study Period | 2020-2034 |
| Base Year | 2025 |
| Estimated Year | 2026 |
| Forecast Period | 2026-2034 |
| Historical Period | 2020-2025 |
| Growth Rate | CAGR of 4% from 2020-2034 |
| Segmentation |
|
Table of Contents
- 1. Introduction
- 1.1. Research Scope
- 1.2. Market Segmentation
- 1.3. Research Objective
- 1.4. Definitions and Assumptions
- 2. Executive Summary
- 2.1. Market Snapshot
- 3. Market Dynamics
- 3.1. Market Drivers
- 3.2. Market Restrains
- 3.3. Market Trends
- 3.4. Market Opportunities
- 4. Market Factor Analysis
- 4.1. Porters Five Forces
- 4.1.1. Bargaining Power of Suppliers
- 4.1.2. Bargaining Power of Buyers
- 4.1.3. Threat of New Entrants
- 4.1.4. Threat of Substitutes
- 4.1.5. Competitive Rivalry
- 4.2. PESTEL analysis
- 4.3. BCG Analysis
- 4.3.1. Stars (High Growth, High Market Share)
- 4.3.2. Cash Cows (Low Growth, High Market Share)
- 4.3.3. Question Mark (High Growth, Low Market Share)
- 4.3.4. Dogs (Low Growth, Low Market Share)
- 4.4. Ansoff Matrix Analysis
- 4.5. Supply Chain Analysis
- 4.6. Regulatory Landscape
- 4.7. Current Market Potential and Opportunity Assessment (TAM–SAM–SOM Framework)
- 4.8. TIR Analyst Note
- 4.1. Porters Five Forces
- 5. Market Analysis, Insights and Forecast 2021-2033
- 5.1. Market Analysis, Insights and Forecast - by Type
- 5.1.1. Positive Diplacement
- 5.1.2. Dynamic
- 5.2. Market Analysis, Insights and Forecast - by End User
- 5.2.1. Oil and Gas Industry
- 5.2.2. Power Sector
- 5.2.3. Manufacturing Sector
- 5.2.4. Chemicals and Petrochemical Industry
- 5.2.5. Other End Users
- 5.3. Market Analysis, Insights and Forecast - by Geography
- 5.3.1. Brazil
- 5.3.2. Argentina
- 5.3.3. Rest of South America
- 5.4. Market Analysis, Insights and Forecast - by Region
- 5.4.1. Brazil
- 5.4.2. Argentina
- 5.4.3. Rest of South America
- 5.1. Market Analysis, Insights and Forecast - by Type
- 6. South America Compressor Industry Analysis, Insights and Forecast, 2021-2033
- 6.1. Market Analysis, Insights and Forecast - by Type
- 6.1.1. Positive Diplacement
- 6.1.2. Dynamic
- 6.2. Market Analysis, Insights and Forecast - by End User
- 6.2.1. Oil and Gas Industry
- 6.2.2. Power Sector
- 6.2.3. Manufacturing Sector
- 6.2.4. Chemicals and Petrochemical Industry
- 6.2.5. Other End Users
- 6.3. Market Analysis, Insights and Forecast - by Geography
- 6.3.1. Brazil
- 6.3.2. Argentina
- 6.3.3. Rest of South America
- 6.1. Market Analysis, Insights and Forecast - by Type
- 7. Brazil South America Compressor Industry Analysis, Insights and Forecast, 2020-2032
- 7.1. Market Analysis, Insights and Forecast - by Type
- 7.1.1. Positive Diplacement
- 7.1.2. Dynamic
- 7.2. Market Analysis, Insights and Forecast - by End User
- 7.2.1. Oil and Gas Industry
- 7.2.2. Power Sector
- 7.2.3. Manufacturing Sector
- 7.2.4. Chemicals and Petrochemical Industry
- 7.2.5. Other End Users
- 7.3. Market Analysis, Insights and Forecast - by Geography
- 7.3.1. Brazil
- 7.3.2. Argentina
- 7.3.3. Rest of South America
- 7.1. Market Analysis, Insights and Forecast - by Type
- 8. Argentina South America Compressor Industry Analysis, Insights and Forecast, 2020-2032
- 8.1. Market Analysis, Insights and Forecast - by Type
- 8.1.1. Positive Diplacement
- 8.1.2. Dynamic
- 8.2. Market Analysis, Insights and Forecast - by End User
- 8.2.1. Oil and Gas Industry
- 8.2.2. Power Sector
- 8.2.3. Manufacturing Sector
- 8.2.4. Chemicals and Petrochemical Industry
- 8.2.5. Other End Users
- 8.3. Market Analysis, Insights and Forecast - by Geography
- 8.3.1. Brazil
- 8.3.2. Argentina
- 8.3.3. Rest of South America
- 8.1. Market Analysis, Insights and Forecast - by Type
- 9. Rest of South America South America Compressor Industry Analysis, Insights and Forecast, 2020-2032
- 9.1. Market Analysis, Insights and Forecast - by Type
- 9.1.1. Positive Diplacement
- 9.1.2. Dynamic
- 9.2. Market Analysis, Insights and Forecast - by End User
- 9.2.1. Oil and Gas Industry
- 9.2.2. Power Sector
- 9.2.3. Manufacturing Sector
- 9.2.4. Chemicals and Petrochemical Industry
- 9.2.5. Other End Users
- 9.3. Market Analysis, Insights and Forecast - by Geography
- 9.3.1. Brazil
- 9.3.2. Argentina
- 9.3.3. Rest of South America
- 9.1. Market Analysis, Insights and Forecast - by Type
- 10. Competitive Analysis
- 10.1. Company Profiles
- 10.1.1 Trane Technologies PLC
- 10.1.1.1. Company Overview
- 10.1.1.2. Products
- 10.1.1.3. Company Financials
- 10.1.1.4. SWOT Analysis
- 10.1.2 Ebara Corporation
- 10.1.2.1. Company Overview
- 10.1.2.2. Products
- 10.1.2.3. Company Financials
- 10.1.2.4. SWOT Analysis
- 10.1.3 ELGI Equipments Ltd*List Not Exhaustive
- 10.1.3.1. Company Overview
- 10.1.3.2. Products
- 10.1.3.3. Company Financials
- 10.1.3.4. SWOT Analysis
- 10.1.4 Atlas Copco AB
- 10.1.4.1. Company Overview
- 10.1.4.2. Products
- 10.1.4.3. Company Financials
- 10.1.4.4. SWOT Analysis
- 10.1.5 Baker Hughes Co
- 10.1.5.1. Company Overview
- 10.1.5.2. Products
- 10.1.5.3. Company Financials
- 10.1.5.4. SWOT Analysis
- 10.1.6 Aerzener Maschinenfabrik GmbH
- 10.1.6.1. Company Overview
- 10.1.6.2. Products
- 10.1.6.3. Company Financials
- 10.1.6.4. SWOT Analysis
- 10.1.7 Siemens AG
- 10.1.7.1. Company Overview
- 10.1.7.2. Products
- 10.1.7.3. Company Financials
- 10.1.7.4. SWOT Analysis
- 10.1.8 Schulz S A
- 10.1.8.1. Company Overview
- 10.1.8.2. Products
- 10.1.8.3. Company Financials
- 10.1.8.4. SWOT Analysis
- 10.1.9 General Electric Company
- 10.1.9.1. Company Overview
- 10.1.9.2. Products
- 10.1.9.3. Company Financials
- 10.1.9.4. SWOT Analysis
- 10.1.1 Trane Technologies PLC
- 10.2. Market Entropy
- 10.2.1 Company's Key Areas Served
- 10.2.2 Recent Developments
- 10.3. Company Market Share Analysis 2025
- 10.3.1 Top 5 Companies Market Share Analysis
- 10.3.2 Top 3 Companies Market Share Analysis
- 10.4. List of Potential Customers
- 11. Research Methodology
List of Figures
- Figure 1: South America Compressor Industry Revenue Breakdown (million, %) by Product 2025 & 2033
- Figure 2: South America Compressor Industry Share (%) by Company 2025
List of Tables
- Table 1: South America Compressor Industry Revenue million Forecast, by Type 2020 & 2033
- Table 2: South America Compressor Industry Volume K Units Forecast, by Type 2020 & 2033
- Table 3: South America Compressor Industry Revenue million Forecast, by End User 2020 & 2033
- Table 4: South America Compressor Industry Volume K Units Forecast, by End User 2020 & 2033
- Table 5: South America Compressor Industry Revenue million Forecast, by Geography 2020 & 2033
- Table 6: South America Compressor Industry Volume K Units Forecast, by Geography 2020 & 2033
- Table 7: South America Compressor Industry Revenue million Forecast, by Region 2020 & 2033
- Table 8: South America Compressor Industry Volume K Units Forecast, by Region 2020 & 2033
- Table 9: South America Compressor Industry Revenue million Forecast, by Type 2020 & 2033
- Table 10: South America Compressor Industry Volume K Units Forecast, by Type 2020 & 2033
- Table 11: South America Compressor Industry Revenue million Forecast, by End User 2020 & 2033
- Table 12: South America Compressor Industry Volume K Units Forecast, by End User 2020 & 2033
- Table 13: South America Compressor Industry Revenue million Forecast, by Geography 2020 & 2033
- Table 14: South America Compressor Industry Volume K Units Forecast, by Geography 2020 & 2033
- Table 15: South America Compressor Industry Revenue million Forecast, by Country 2020 & 2033
- Table 16: South America Compressor Industry Volume K Units Forecast, by Country 2020 & 2033
- Table 17: South America Compressor Industry Revenue million Forecast, by Type 2020 & 2033
- Table 18: South America Compressor Industry Volume K Units Forecast, by Type 2020 & 2033
- Table 19: South America Compressor Industry Revenue million Forecast, by End User 2020 & 2033
- Table 20: South America Compressor Industry Volume K Units Forecast, by End User 2020 & 2033
- Table 21: South America Compressor Industry Revenue million Forecast, by Geography 2020 & 2033
- Table 22: South America Compressor Industry Volume K Units Forecast, by Geography 2020 & 2033
- Table 23: South America Compressor Industry Revenue million Forecast, by Country 2020 & 2033
- Table 24: South America Compressor Industry Volume K Units Forecast, by Country 2020 & 2033
- Table 25: South America Compressor Industry Revenue million Forecast, by Type 2020 & 2033
- Table 26: South America Compressor Industry Volume K Units Forecast, by Type 2020 & 2033
- Table 27: South America Compressor Industry Revenue million Forecast, by End User 2020 & 2033
- Table 28: South America Compressor Industry Volume K Units Forecast, by End User 2020 & 2033
- Table 29: South America Compressor Industry Revenue million Forecast, by Geography 2020 & 2033
- Table 30: South America Compressor Industry Volume K Units Forecast, by Geography 2020 & 2033
- Table 31: South America Compressor Industry Revenue million Forecast, by Country 2020 & 2033
- Table 32: South America Compressor Industry Volume K Units Forecast, by Country 2020 & 2033
Frequently Asked Questions
1. What is the projected Compound Annual Growth Rate (CAGR) of the South America Compressor Industry?
The projected CAGR is approximately 4%.
2. Which companies are prominent players in the South America Compressor Industry?
Key companies in the market include Trane Technologies PLC, Ebara Corporation, ELGI Equipments Ltd*List Not Exhaustive, Atlas Copco AB, Baker Hughes Co, Aerzener Maschinenfabrik GmbH, Siemens AG, Schulz S A, General Electric Company.
3. What are the main segments of the South America Compressor Industry?
The market segments include Type, End User, Geography.
4. Can you provide details about the market size?
The market size is estimated to be USD 1445.4 million as of 2022.
5. What are some drivers contributing to market growth?
4.; Growing Oil and Gas Industry4.; Rapid Growth in the Industrial Sector.
6. What are the notable trends driving market growth?
Oil and Gas Industry Segment Expected to Dominate the Market.
7. Are there any restraints impacting market growth?
4.; Fluctuation in Oil and Gas Prices.
8. Can you provide examples of recent developments in the market?
September 2022: YPF and Petronas signed a deal to build a liquefied natural gas (LNG) plant and a pipeline to transport the fuel. The project's initial investment is estimated at around USD 10 billion. It is expected to have a capacity of a power output of 5 million tonnes of LNG during the first year of operation.
9. What pricing options are available for accessing the report?
Pricing options include single-user, multi-user, and enterprise licenses priced at USD 4750, USD 5250, and USD 8750 respectively.
10. Is the market size provided in terms of value or volume?
The market size is provided in terms of value, measured in million and volume, measured in K Units.
11. Are there any specific market keywords associated with the report?
Yes, the market keyword associated with the report is "South America Compressor Industry," which aids in identifying and referencing the specific market segment covered.
12. How do I determine which pricing option suits my needs best?
The pricing options vary based on user requirements and access needs. Individual users may opt for single-user licenses, while businesses requiring broader access may choose multi-user or enterprise licenses for cost-effective access to the report.
13. Are there any additional resources or data provided in the South America Compressor Industry report?
While the report offers comprehensive insights, it's advisable to review the specific contents or supplementary materials provided to ascertain if additional resources or data are available.
14. How can I stay updated on further developments or reports in the South America Compressor Industry?
To stay informed about further developments, trends, and reports in the South America Compressor Industry, consider subscribing to industry newsletters, following relevant companies and organizations, or regularly checking reputable industry news sources and publications.
Methodology
Step 1 - Identification of Relevant Samples Size from Population Database


Step 2 - Approaches for Defining Global Market Size (Value, Volume* & Price*)

Note*: In applicable scenarios
Step 3 - Data Sources
Primary Research
- Web Analytics
- Survey Reports
- Research Institute
- Latest Research Reports
- Opinion Leaders
Secondary Research
- Annual Reports
- White Paper
- Latest Press Release
- Industry Association
- Paid Database
- Investor Presentations

Step 4 - Data Triangulation
Involves using different sources of information in order to increase the validity of a study
These sources are likely to be stakeholders in a program - participants, other researchers, program staff, other community members, and so on.
Then we put all data in single framework & apply various statistical tools to find out the dynamic on the market.
During the analysis stage, feedback from the stakeholder groups would be compared to determine areas of agreement as well as areas of divergence