

Key Insights
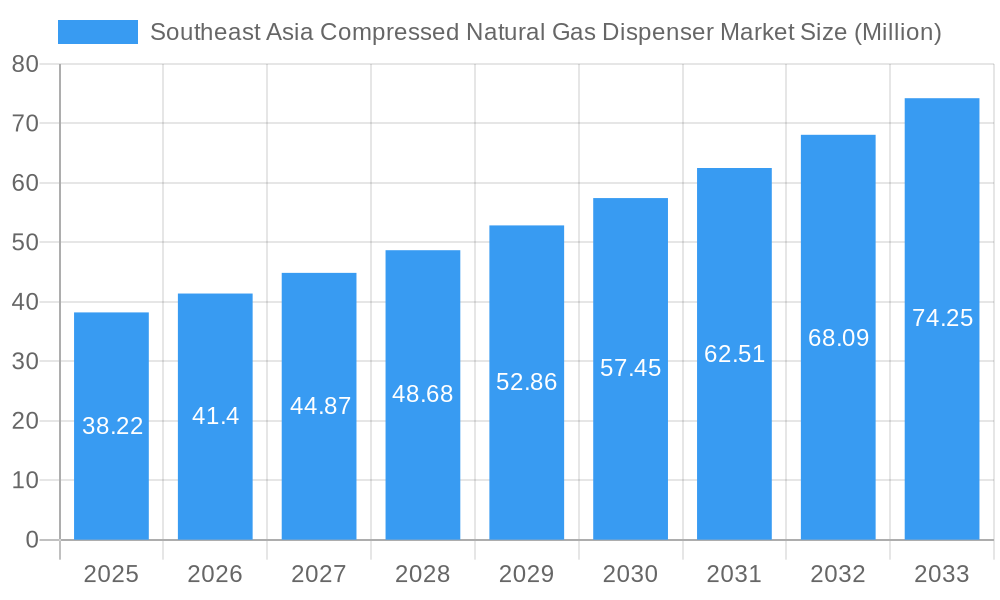
The Southeast Asia Compressed Natural Gas (CNG) Dispenser Market is poised for significant expansion, projected to reach a market size of USD 38.22 million by 2025, with a robust Compound Annual Growth Rate (CAGR) of 8.39% anticipated throughout the forecast period of 2025-2033. This growth is underpinned by a confluence of favorable drivers, including escalating government initiatives promoting cleaner fuel alternatives, the increasing adoption of CNG-powered vehicles across the region, and the inherent cost-effectiveness of natural gas as an automotive fuel compared to conventional options. As environmental concerns intensify and nations within Southeast Asia strive to meet emission reduction targets, the demand for efficient and reliable CNG dispensing infrastructure will naturally surge. The market's momentum is further bolstered by technological advancements in dispenser technology, enhancing safety, accuracy, and user experience. Countries like Thailand, Singapore, Indonesia, and Malaysia are at the forefront of this adoption curve, driven by their respective energy policies and the existing CNG vehicle fleet.
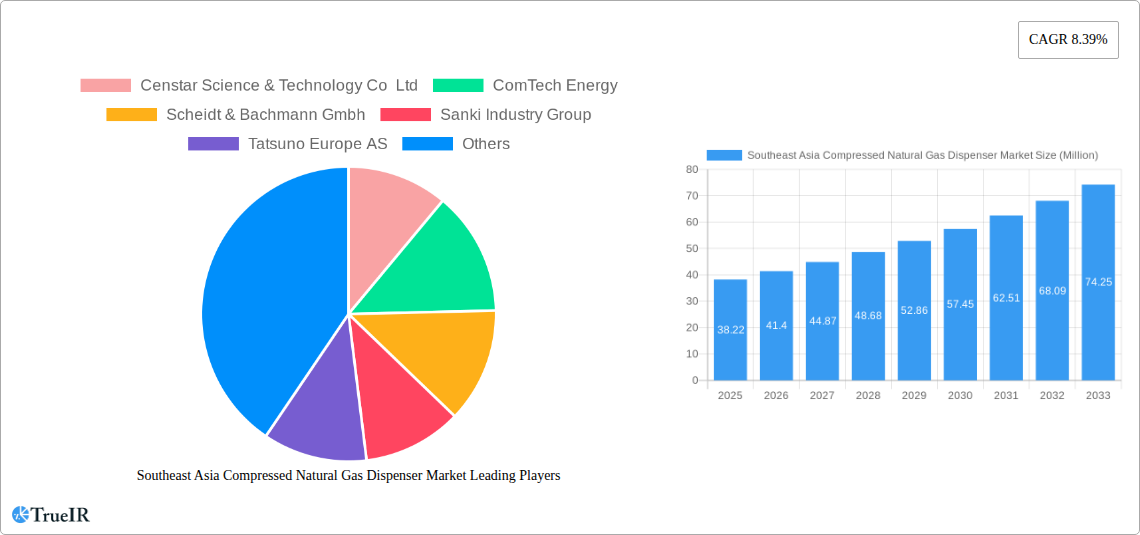
Southeast Asia Compressed Natural Gas Dispenser Market Market Size (In Million)
Despite the promising outlook, certain restraints could temper the market's pace. These may include the initial high capital investment required for setting up CNG refueling stations, potential challenges in securing adequate natural gas supply for widespread distribution, and the need for standardized safety regulations across diverse national frameworks. However, the overarching trend towards sustainable energy solutions and the continuous expansion of CNG vehicle fleets are expected to overshadow these limitations. Key players like Gilbarco Inc., Scheidt & Bachmann GmbH, and Parker Hannifin Corp are strategically positioned to capitalize on this growth, offering innovative solutions and expanding their regional presence. The market's trajectory suggests a strong demand for advanced dispensing systems that can cater to the growing network of CNG refueling stations, ensuring efficient and safe refueling operations across the dynamic Southeast Asian landscape.
Southeast Asia Compressed Natural Gas Dispenser Market Company Market Share
Southeast Asia Compressed Natural Gas Dispenser Market Market Structure & Competitive Landscape
The Southeast Asia Compressed Natural Gas (CNG) Dispenser Market is characterized by a moderate to high level of market concentration, with a few key players dominating significant portions of the market share. Innovation remains a critical driver, fueled by advancements in dispenser technology, safety features, and integrated payment systems. Regulatory impacts, particularly those related to emissions standards and the promotion of cleaner fuels, are shaping market entry and product development. The threat of product substitutes, such as liquefied natural gas (LNG) dispensers and electric vehicle charging infrastructure, necessitates continuous improvement and cost-effectiveness in CNG dispenser offerings. End-user segmentation, primarily driven by fleet operators, public transport authorities, and private vehicle owners, influences product design and service requirements. Mergers and acquisitions (M&A) trends, while not excessively frequent, signify strategic consolidation and expansion efforts by leading companies aiming to enhance their market presence and technological capabilities. M&A volumes have been estimated at approximately 5-10 significant transactions over the historical period (2019-2024), indicating a mature but still active consolidation landscape. Concentration ratios are estimated to be around 60-70% for the top 5 players in major markets.
Southeast Asia Compressed Natural Gas Dispenser Market Market Trends & Opportunities
The Southeast Asia Compressed Natural Gas Dispenser Market is poised for substantial expansion, driven by a confluence of increasing environmental consciousness, government mandates for cleaner fuel adoption, and the growing demand for cost-effective transportation solutions. The market is anticipated to witness a robust Compound Annual Growth Rate (CAGR) of approximately 8-10% during the forecast period (2025-2033). This upward trajectory is underpinned by significant investments in CNG refueling infrastructure across key economies like Indonesia, Thailand, and Malaysia. Technological shifts are focusing on enhanced dispenser accuracy, faster refueling times, improved safety protocols with advanced monitoring systems, and the integration of smart technologies for remote diagnostics and fleet management. Consumer preferences are leaning towards dispensers that offer convenience, reliability, and competitive pricing. The competitive dynamics are evolving with both established global players and emerging regional manufacturers vying for market share. The increasing penetration of CNG vehicles, particularly in the public transportation and commercial fleet sectors, presents a fertile ground for dispenser manufacturers. Opportunities lie in developing solutions tailored to specific regional needs, such as ruggedized designs for varying climatic conditions and advanced features to cater to the burgeoning ride-sharing and logistics industries. Furthermore, the push towards digitalization and the Internet of Things (IoT) is creating avenues for smart dispensers that offer real-time data analytics, optimized station management, and seamless integration with existing fuel management systems. The growing awareness of the cost benefits associated with CNG over traditional fossil fuels continues to fuel demand, creating a sustained opportunity for market growth. The development of modular and scalable dispenser solutions to accommodate varying station capacities will also be a key trend.
Dominant Markets & Segments in Southeast Asia Compressed Natural Gas Dispenser Market
Indonesia is emerging as a dominant market within the Southeast Asia Compressed Natural Gas Dispenser market, driven by its large population, significant natural gas reserves, and proactive government policies promoting the adoption of cleaner fuels. The country's extensive bus rapid transit (BRT) systems and a growing fleet of CNG-powered taxis and commercial vehicles are creating substantial demand for CNG dispensers.
- Key Growth Drivers in Indonesia:
- Government subsidies and incentives for CNG vehicle conversion and infrastructure development.
- Expansion of public transportation networks requiring extensive refueling facilities.
- Abundant domestic natural gas resources contributing to competitive fuel pricing.
- Increasing environmental regulations aimed at reducing vehicular emissions.
Thailand represents another pivotal market, characterized by a strong focus on reducing air pollution and diversifying its energy sources. The government's commitment to developing a robust CNG infrastructure, particularly for its large number of public buses and commercial vehicles, fuels consistent demand for dispensers.
- Key Growth Drivers in Thailand:
- National policies supporting the transition to cleaner fuels.
- Significant presence of CNG-powered vehicles in public transportation fleets.
- Strategic initiatives to expand the CNG refueling station network.
- Growing interest from private fleet operators seeking cost-effective alternatives.
Malaysia is witnessing steady growth in its CNG dispenser market, supported by government initiatives to promote natural gas as an alternative fuel and a focus on reducing the nation's carbon footprint. The expansion of CNG refueling stations, particularly in urban centers, is a key trend.
- Key Growth Drivers in Malaysia:
- Government incentives for CNG station establishment and vehicle adoption.
- Growing adoption of CNG in commercial fleets and taxis.
- Increasing environmental awareness and regulatory push for cleaner air.
Singapore, while a smaller market in terms of sheer volume, plays a crucial role as a hub for technological innovation and high-standards adoption. Its focus on sustainability and advanced infrastructure makes it a key market for sophisticated and efficient CNG dispensing solutions.
- Key Growth Drivers in Singapore:
- Strict emission standards driving the adoption of cleaner fuels.
- Emphasis on smart city initiatives and advanced technological integration.
- Focus on efficient and reliable refueling solutions for its diverse vehicle fleet.
Rest of Southeast Asia encompasses countries like Vietnam, the Philippines, and Myanmar, where the CNG dispenser market is in its nascent stages but exhibits considerable untapped potential. Growing urbanization, increasing vehicle ownership, and a nascent drive towards cleaner energy solutions are expected to catalyze growth in these regions. The development of pilot projects and government support will be crucial in unlocking the full market potential in these emerging economies.
Southeast Asia Compressed Natural Gas Dispenser Market Product Analysis
The Southeast Asia Compressed Natural Gas Dispenser market is witnessing innovation focused on enhanced safety, efficiency, and user experience. Products are evolving from basic dispensing units to sophisticated systems incorporating advanced flow meters for precise measurement, electronic calibration for accuracy, and robust safety features like emergency shut-off valves and leak detection systems. Applications span public transportation fleets, commercial vehicles, taxis, and private automobiles. Competitive advantages are derived from factors such as high dispensing speeds, low maintenance requirements, compliance with international safety standards, and the integration of digital technologies for remote monitoring and data management.
Key Drivers, Barriers & Challenges in Southeast Asia Compressed Natural Gas Dispenser Market
Key Drivers:
- Government Initiatives: Strong policy support and incentives for CNG adoption and infrastructure development are primary growth catalysts.
- Environmental Concerns: Increasing awareness of air pollution and carbon emissions is driving demand for cleaner fuels.
- Cost-Effectiveness: CNG offers a significant cost advantage over traditional fuels, attracting fleet operators.
- Technological Advancements: Improved dispenser efficiency, safety, and integration capabilities enhance market appeal.
Key Barriers & Challenges:
- Infrastructure Development: The high capital cost and time required to build extensive CNG refueling networks remain a significant hurdle.
- Regulatory Hurdles: Inconsistent or evolving regulations across different countries can create market entry complexities.
- Competition from Alternatives: The rise of LNG and electric vehicle infrastructure presents potential competition.
- Supply Chain Disruptions: Geopolitical factors and manufacturing complexities can impact the availability and cost of components.
Growth Drivers in the Southeast Asia Compressed Natural Gas Dispenser Market Market
Key growth drivers for the Southeast Asia Compressed Natural Gas Dispenser Market are multifaceted, stemming from technological, economic, and regulatory factors. Governments across the region are actively promoting CNG as a cleaner and more affordable alternative to gasoline and diesel, leading to supportive policies and financial incentives for both vehicle conversion and the establishment of refueling stations. This regulatory push is a significant catalyst. Economically, the lower price of natural gas compared to conventional fuels makes CNG an attractive option for fleet operators in sectors like public transportation, logistics, and waste management, directly driving demand for CNG dispensers. Technologically, continuous advancements in dispenser design, focusing on improved accuracy, faster refueling speeds, enhanced safety features, and digital integration capabilities such as remote monitoring and diagnostics, are making CNG a more viable and convenient option for end-users.
Challenges Impacting Southeast Asia Compressed Natural Gas Dispenser Market Growth
Several challenges are impacting the growth of the Southeast Asia Compressed Natural Gas Dispenser Market. A primary restraint is the substantial capital investment required for developing a widespread and accessible CNG refueling infrastructure. Building a comprehensive network of stations across diverse geographical terrains and population densities is a slow and costly process. Regulatory complexities and inconsistencies across different Southeast Asian countries can create significant hurdles for market entry and expansion, demanding localized compliance efforts and potentially delaying project timelines. Furthermore, the evolving landscape of alternative fuels, particularly the growing momentum behind electric vehicles (EVs) and the expanding charging infrastructure, presents a competitive pressure, potentially diverting investment and consumer preference away from CNG. Supply chain vulnerabilities, including the availability of specialized components and geopolitical factors affecting natural gas supply, can also pose risks to consistent market development and pricing stability.
Key Players Shaping the Southeast Asia Compressed Natural Gas Dispenser Market Market
- Censtar Science & Technology Co Ltd
- ComTech Energy
- Scheidt & Bachmann Gmbh
- Sanki Industry Group
- Tatsuno Europe AS
- TGT Fuel Technologies India Pvt Ltd
- Gilbarco Inc
- Greka Engineering
- FTI International Group Inc
- Parker Hannifin Corp
Significant Southeast Asia Compressed Natural Gas Dispenser Market Industry Milestones
- 2019-2024: Continued expansion of CNG refueling infrastructure in Indonesia and Thailand, with numerous new station openings.
- 2020: Launch of advanced smart CNG dispenser models with integrated IoT capabilities by key players.
- 2021: Increased government focus on emission reduction policies across multiple Southeast Asian nations, boosting interest in CNG.
- 2022: Several strategic partnerships formed between dispenser manufacturers and energy companies to develop integrated fuel solutions.
- 2023: Significant investments made in upgrading existing CNG dispenser fleets to meet enhanced safety and efficiency standards.
Future Outlook for Southeast Asia Compressed Natural Gas Dispenser Market Market
The future outlook for the Southeast Asia Compressed Natural Gas Dispenser Market is strongly positive, driven by sustained governmental support for cleaner energy alternatives and the inherent cost advantages of CNG. Strategic opportunities lie in expanding into emerging markets within the region, such as Vietnam and the Philippines, by tailoring solutions to local needs and supporting nascent infrastructure development. The market potential is further amplified by the increasing adoption of CNG in the heavy-duty vehicle segment and the ongoing technological evolution of dispensers towards greater automation, data analytics, and a seamless user experience. Manufacturers focusing on robust, reliable, and cost-effective solutions, while also embracing digitalization, are well-positioned for significant growth in the coming years.
Southeast Asia Compressed Natural Gas Dispenser Market Segmentation
- 1. Thailand
- 2. Singapore
- 3. Indonesia
- 4. Malaysia
- 5. Rest of Southeast Asia
Southeast Asia Compressed Natural Gas Dispenser Market Segmentation By Geography
-
1. North America
- 1.1. United States
- 1.2. Canada
- 1.3. Mexico
-
2. South America
- 2.1. Brazil
- 2.2. Argentina
- 2.3. Rest of South America
-
3. Europe
- 3.1. United Kingdom
- 3.2. Germany
- 3.3. France
- 3.4. Italy
- 3.5. Spain
- 3.6. Russia
- 3.7. Benelux
- 3.8. Nordics
- 3.9. Rest of Europe
-
4. Middle East & Africa
- 4.1. Turkey
- 4.2. Israel
- 4.3. GCC
- 4.4. North Africa
- 4.5. South Africa
- 4.6. Rest of Middle East & Africa
-
5. Asia Pacific
- 5.1. China
- 5.2. India
- 5.3. Japan
- 5.4. South Korea
- 5.5. ASEAN
- 5.6. Oceania
- 5.7. Rest of Asia Pacific
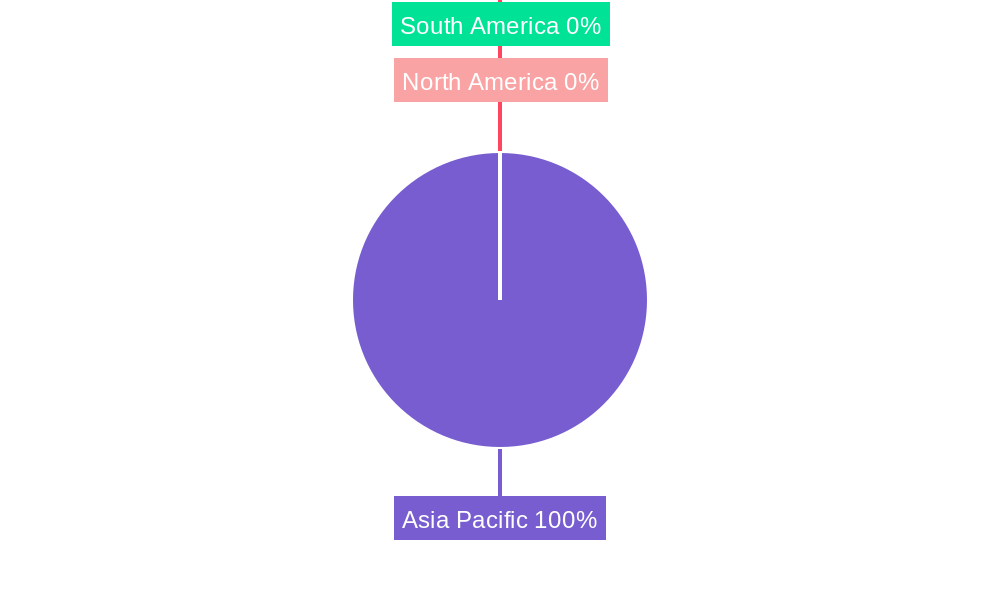
Southeast Asia Compressed Natural Gas Dispenser Market Regional Market Share
Geographic Coverage of Southeast Asia Compressed Natural Gas Dispenser Market
Southeast Asia Compressed Natural Gas Dispenser Market REPORT HIGHLIGHTS
| Aspects | Details |
|---|---|
| Study Period | 2020-2034 |
| Base Year | 2025 |
| Estimated Year | 2026 |
| Forecast Period | 2026-2034 |
| Historical Period | 2020-2025 |
| Growth Rate | CAGR of 8.39% from 2020-2034 |
| Segmentation |
|
Table of Contents
- 1. Introduction
- 1.1. Research Scope
- 1.2. Market Segmentation
- 1.3. Research Objective
- 1.4. Definitions and Assumptions
- 2. Executive Summary
- 2.1. Market Snapshot
- 3. Market Dynamics
- 3.1. Market Drivers
- 3.2. Market Restrains
- 3.3. Market Trends
- 3.4. Market Opportunities
- 4. Market Factor Analysis
- 4.1. Porters Five Forces
- 4.1.1. Bargaining Power of Suppliers
- 4.1.2. Bargaining Power of Buyers
- 4.1.3. Threat of New Entrants
- 4.1.4. Threat of Substitutes
- 4.1.5. Competitive Rivalry
- 4.2. PESTEL analysis
- 4.3. BCG Analysis
- 4.3.1. Stars (High Growth, High Market Share)
- 4.3.2. Cash Cows (Low Growth, High Market Share)
- 4.3.3. Question Mark (High Growth, Low Market Share)
- 4.3.4. Dogs (Low Growth, Low Market Share)
- 4.4. Ansoff Matrix Analysis
- 4.5. Supply Chain Analysis
- 4.6. Regulatory Landscape
- 4.7. Current Market Potential and Opportunity Assessment (TAM–SAM–SOM Framework)
- 4.8. TIR Analyst Note
- 4.1. Porters Five Forces
- 5. Market Analysis, Insights and Forecast 2021-2033
- 5.1. Market Analysis, Insights and Forecast - by Thailand
- 5.2. Market Analysis, Insights and Forecast - by Singapore
- 5.3. Market Analysis, Insights and Forecast - by Indonesia
- 5.4. Market Analysis, Insights and Forecast - by Malaysia
- 5.5. Market Analysis, Insights and Forecast - by Rest of Southeast Asia
- 5.6. Market Analysis, Insights and Forecast - by Region
- 5.6.1. North America
- 5.6.2. South America
- 5.6.3. Europe
- 5.6.4. Middle East & Africa
- 5.6.5. Asia Pacific
- 6. Global Southeast Asia Compressed Natural Gas Dispenser Market Analysis, Insights and Forecast, 2021-2033
- 6.1. Market Analysis, Insights and Forecast - by Thailand
- 6.2. Market Analysis, Insights and Forecast - by Singapore
- 6.3. Market Analysis, Insights and Forecast - by Indonesia
- 6.4. Market Analysis, Insights and Forecast - by Malaysia
- 6.5. Market Analysis, Insights and Forecast - by Rest of Southeast Asia
- 7. North America Southeast Asia Compressed Natural Gas Dispenser Market Analysis, Insights and Forecast, 2020-2032
- 7.1. Market Analysis, Insights and Forecast - by Thailand
- 7.2. Market Analysis, Insights and Forecast - by Singapore
- 7.3. Market Analysis, Insights and Forecast - by Indonesia
- 7.4. Market Analysis, Insights and Forecast - by Malaysia
- 7.5. Market Analysis, Insights and Forecast - by Rest of Southeast Asia
- 8. South America Southeast Asia Compressed Natural Gas Dispenser Market Analysis, Insights and Forecast, 2020-2032
- 8.1. Market Analysis, Insights and Forecast - by Thailand
- 8.2. Market Analysis, Insights and Forecast - by Singapore
- 8.3. Market Analysis, Insights and Forecast - by Indonesia
- 8.4. Market Analysis, Insights and Forecast - by Malaysia
- 8.5. Market Analysis, Insights and Forecast - by Rest of Southeast Asia
- 9. Europe Southeast Asia Compressed Natural Gas Dispenser Market Analysis, Insights and Forecast, 2020-2032
- 9.1. Market Analysis, Insights and Forecast - by Thailand
- 9.2. Market Analysis, Insights and Forecast - by Singapore
- 9.3. Market Analysis, Insights and Forecast - by Indonesia
- 9.4. Market Analysis, Insights and Forecast - by Malaysia
- 9.5. Market Analysis, Insights and Forecast - by Rest of Southeast Asia
- 10. Middle East & Africa Southeast Asia Compressed Natural Gas Dispenser Market Analysis, Insights and Forecast, 2020-2032
- 10.1. Market Analysis, Insights and Forecast - by Thailand
- 10.2. Market Analysis, Insights and Forecast - by Singapore
- 10.3. Market Analysis, Insights and Forecast - by Indonesia
- 10.4. Market Analysis, Insights and Forecast - by Malaysia
- 10.5. Market Analysis, Insights and Forecast - by Rest of Southeast Asia
- 11. Asia Pacific Southeast Asia Compressed Natural Gas Dispenser Market Analysis, Insights and Forecast, 2020-2032
- 11.1. Market Analysis, Insights and Forecast - by Thailand
- 11.2. Market Analysis, Insights and Forecast - by Singapore
- 11.3. Market Analysis, Insights and Forecast - by Indonesia
- 11.4. Market Analysis, Insights and Forecast - by Malaysia
- 11.5. Market Analysis, Insights and Forecast - by Rest of Southeast Asia
- 12. Competitive Analysis
- 12.1. Company Profiles
- 12.1.1 Censtar Science & Technology Co Ltd
- 12.1.1.1. Company Overview
- 12.1.1.2. Products
- 12.1.1.3. Company Financials
- 12.1.1.4. SWOT Analysis
- 12.1.2 ComTech Energy
- 12.1.2.1. Company Overview
- 12.1.2.2. Products
- 12.1.2.3. Company Financials
- 12.1.2.4. SWOT Analysis
- 12.1.3 Scheidt & Bachmann Gmbh
- 12.1.3.1. Company Overview
- 12.1.3.2. Products
- 12.1.3.3. Company Financials
- 12.1.3.4. SWOT Analysis
- 12.1.4 Sanki Industry Group
- 12.1.4.1. Company Overview
- 12.1.4.2. Products
- 12.1.4.3. Company Financials
- 12.1.4.4. SWOT Analysis
- 12.1.5 Tatsuno Europe AS
- 12.1.5.1. Company Overview
- 12.1.5.2. Products
- 12.1.5.3. Company Financials
- 12.1.5.4. SWOT Analysis
- 12.1.6 TGT Fuel Technologies India Pvt Ltd
- 12.1.6.1. Company Overview
- 12.1.6.2. Products
- 12.1.6.3. Company Financials
- 12.1.6.4. SWOT Analysis
- 12.1.7 Gilbarco Inc
- 12.1.7.1. Company Overview
- 12.1.7.2. Products
- 12.1.7.3. Company Financials
- 12.1.7.4. SWOT Analysis
- 12.1.8 Greka Engineering
- 12.1.8.1. Company Overview
- 12.1.8.2. Products
- 12.1.8.3. Company Financials
- 12.1.8.4. SWOT Analysis
- 12.1.9 FTI International Group Inc
- 12.1.9.1. Company Overview
- 12.1.9.2. Products
- 12.1.9.3. Company Financials
- 12.1.9.4. SWOT Analysis
- 12.1.10 Parker Hannifin Corp
- 12.1.10.1. Company Overview
- 12.1.10.2. Products
- 12.1.10.3. Company Financials
- 12.1.10.4. SWOT Analysis
- 12.1.1 Censtar Science & Technology Co Ltd
- 12.2. Market Entropy
- 12.2.1 Company's Key Areas Served
- 12.2.2 Recent Developments
- 12.3. Company Market Share Analysis 2025
- 12.3.1 Top 5 Companies Market Share Analysis
- 12.3.2 Top 3 Companies Market Share Analysis
- 12.4. List of Potential Customers
- 13. Research Methodology
List of Figures
- Figure 1: Global Southeast Asia Compressed Natural Gas Dispenser Market Revenue Breakdown (Million, %) by Region 2025 & 2033
- Figure 2: Global Southeast Asia Compressed Natural Gas Dispenser Market Volume Breakdown (K Unit, %) by Region 2025 & 2033
- Figure 3: North America Southeast Asia Compressed Natural Gas Dispenser Market Revenue (Million), by Thailand 2025 & 2033
- Figure 4: North America Southeast Asia Compressed Natural Gas Dispenser Market Volume (K Unit), by Thailand 2025 & 2033
- Figure 5: North America Southeast Asia Compressed Natural Gas Dispenser Market Revenue Share (%), by Thailand 2025 & 2033
- Figure 6: North America Southeast Asia Compressed Natural Gas Dispenser Market Volume Share (%), by Thailand 2025 & 2033
- Figure 7: North America Southeast Asia Compressed Natural Gas Dispenser Market Revenue (Million), by Singapore 2025 & 2033
- Figure 8: North America Southeast Asia Compressed Natural Gas Dispenser Market Volume (K Unit), by Singapore 2025 & 2033
- Figure 9: North America Southeast Asia Compressed Natural Gas Dispenser Market Revenue Share (%), by Singapore 2025 & 2033
- Figure 10: North America Southeast Asia Compressed Natural Gas Dispenser Market Volume Share (%), by Singapore 2025 & 2033
- Figure 11: North America Southeast Asia Compressed Natural Gas Dispenser Market Revenue (Million), by Indonesia 2025 & 2033
- Figure 12: North America Southeast Asia Compressed Natural Gas Dispenser Market Volume (K Unit), by Indonesia 2025 & 2033
- Figure 13: North America Southeast Asia Compressed Natural Gas Dispenser Market Revenue Share (%), by Indonesia 2025 & 2033
- Figure 14: North America Southeast Asia Compressed Natural Gas Dispenser Market Volume Share (%), by Indonesia 2025 & 2033
- Figure 15: North America Southeast Asia Compressed Natural Gas Dispenser Market Revenue (Million), by Malaysia 2025 & 2033
- Figure 16: North America Southeast Asia Compressed Natural Gas Dispenser Market Volume (K Unit), by Malaysia 2025 & 2033
- Figure 17: North America Southeast Asia Compressed Natural Gas Dispenser Market Revenue Share (%), by Malaysia 2025 & 2033
- Figure 18: North America Southeast Asia Compressed Natural Gas Dispenser Market Volume Share (%), by Malaysia 2025 & 2033
- Figure 19: North America Southeast Asia Compressed Natural Gas Dispenser Market Revenue (Million), by Rest of Southeast Asia 2025 & 2033
- Figure 20: North America Southeast Asia Compressed Natural Gas Dispenser Market Volume (K Unit), by Rest of Southeast Asia 2025 & 2033
- Figure 21: North America Southeast Asia Compressed Natural Gas Dispenser Market Revenue Share (%), by Rest of Southeast Asia 2025 & 2033
- Figure 22: North America Southeast Asia Compressed Natural Gas Dispenser Market Volume Share (%), by Rest of Southeast Asia 2025 & 2033
- Figure 23: North America Southeast Asia Compressed Natural Gas Dispenser Market Revenue (Million), by Country 2025 & 2033
- Figure 24: North America Southeast Asia Compressed Natural Gas Dispenser Market Volume (K Unit), by Country 2025 & 2033
- Figure 25: North America Southeast Asia Compressed Natural Gas Dispenser Market Revenue Share (%), by Country 2025 & 2033
- Figure 26: North America Southeast Asia Compressed Natural Gas Dispenser Market Volume Share (%), by Country 2025 & 2033
- Figure 27: South America Southeast Asia Compressed Natural Gas Dispenser Market Revenue (Million), by Thailand 2025 & 2033
- Figure 28: South America Southeast Asia Compressed Natural Gas Dispenser Market Volume (K Unit), by Thailand 2025 & 2033
- Figure 29: South America Southeast Asia Compressed Natural Gas Dispenser Market Revenue Share (%), by Thailand 2025 & 2033
- Figure 30: South America Southeast Asia Compressed Natural Gas Dispenser Market Volume Share (%), by Thailand 2025 & 2033
- Figure 31: South America Southeast Asia Compressed Natural Gas Dispenser Market Revenue (Million), by Singapore 2025 & 2033
- Figure 32: South America Southeast Asia Compressed Natural Gas Dispenser Market Volume (K Unit), by Singapore 2025 & 2033
- Figure 33: South America Southeast Asia Compressed Natural Gas Dispenser Market Revenue Share (%), by Singapore 2025 & 2033
- Figure 34: South America Southeast Asia Compressed Natural Gas Dispenser Market Volume Share (%), by Singapore 2025 & 2033
- Figure 35: South America Southeast Asia Compressed Natural Gas Dispenser Market Revenue (Million), by Indonesia 2025 & 2033
- Figure 36: South America Southeast Asia Compressed Natural Gas Dispenser Market Volume (K Unit), by Indonesia 2025 & 2033
- Figure 37: South America Southeast Asia Compressed Natural Gas Dispenser Market Revenue Share (%), by Indonesia 2025 & 2033
- Figure 38: South America Southeast Asia Compressed Natural Gas Dispenser Market Volume Share (%), by Indonesia 2025 & 2033
- Figure 39: South America Southeast Asia Compressed Natural Gas Dispenser Market Revenue (Million), by Malaysia 2025 & 2033
- Figure 40: South America Southeast Asia Compressed Natural Gas Dispenser Market Volume (K Unit), by Malaysia 2025 & 2033
- Figure 41: South America Southeast Asia Compressed Natural Gas Dispenser Market Revenue Share (%), by Malaysia 2025 & 2033
- Figure 42: South America Southeast Asia Compressed Natural Gas Dispenser Market Volume Share (%), by Malaysia 2025 & 2033
- Figure 43: South America Southeast Asia Compressed Natural Gas Dispenser Market Revenue (Million), by Rest of Southeast Asia 2025 & 2033
- Figure 44: South America Southeast Asia Compressed Natural Gas Dispenser Market Volume (K Unit), by Rest of Southeast Asia 2025 & 2033
- Figure 45: South America Southeast Asia Compressed Natural Gas Dispenser Market Revenue Share (%), by Rest of Southeast Asia 2025 & 2033
- Figure 46: South America Southeast Asia Compressed Natural Gas Dispenser Market Volume Share (%), by Rest of Southeast Asia 2025 & 2033
- Figure 47: South America Southeast Asia Compressed Natural Gas Dispenser Market Revenue (Million), by Country 2025 & 2033
- Figure 48: South America Southeast Asia Compressed Natural Gas Dispenser Market Volume (K Unit), by Country 2025 & 2033
- Figure 49: South America Southeast Asia Compressed Natural Gas Dispenser Market Revenue Share (%), by Country 2025 & 2033
- Figure 50: South America Southeast Asia Compressed Natural Gas Dispenser Market Volume Share (%), by Country 2025 & 2033
- Figure 51: Europe Southeast Asia Compressed Natural Gas Dispenser Market Revenue (Million), by Thailand 2025 & 2033
- Figure 52: Europe Southeast Asia Compressed Natural Gas Dispenser Market Volume (K Unit), by Thailand 2025 & 2033
- Figure 53: Europe Southeast Asia Compressed Natural Gas Dispenser Market Revenue Share (%), by Thailand 2025 & 2033
- Figure 54: Europe Southeast Asia Compressed Natural Gas Dispenser Market Volume Share (%), by Thailand 2025 & 2033
- Figure 55: Europe Southeast Asia Compressed Natural Gas Dispenser Market Revenue (Million), by Singapore 2025 & 2033
- Figure 56: Europe Southeast Asia Compressed Natural Gas Dispenser Market Volume (K Unit), by Singapore 2025 & 2033
- Figure 57: Europe Southeast Asia Compressed Natural Gas Dispenser Market Revenue Share (%), by Singapore 2025 & 2033
- Figure 58: Europe Southeast Asia Compressed Natural Gas Dispenser Market Volume Share (%), by Singapore 2025 & 2033
- Figure 59: Europe Southeast Asia Compressed Natural Gas Dispenser Market Revenue (Million), by Indonesia 2025 & 2033
- Figure 60: Europe Southeast Asia Compressed Natural Gas Dispenser Market Volume (K Unit), by Indonesia 2025 & 2033
- Figure 61: Europe Southeast Asia Compressed Natural Gas Dispenser Market Revenue Share (%), by Indonesia 2025 & 2033
- Figure 62: Europe Southeast Asia Compressed Natural Gas Dispenser Market Volume Share (%), by Indonesia 2025 & 2033
- Figure 63: Europe Southeast Asia Compressed Natural Gas Dispenser Market Revenue (Million), by Malaysia 2025 & 2033
- Figure 64: Europe Southeast Asia Compressed Natural Gas Dispenser Market Volume (K Unit), by Malaysia 2025 & 2033
- Figure 65: Europe Southeast Asia Compressed Natural Gas Dispenser Market Revenue Share (%), by Malaysia 2025 & 2033
- Figure 66: Europe Southeast Asia Compressed Natural Gas Dispenser Market Volume Share (%), by Malaysia 2025 & 2033
- Figure 67: Europe Southeast Asia Compressed Natural Gas Dispenser Market Revenue (Million), by Rest of Southeast Asia 2025 & 2033
- Figure 68: Europe Southeast Asia Compressed Natural Gas Dispenser Market Volume (K Unit), by Rest of Southeast Asia 2025 & 2033
- Figure 69: Europe Southeast Asia Compressed Natural Gas Dispenser Market Revenue Share (%), by Rest of Southeast Asia 2025 & 2033
- Figure 70: Europe Southeast Asia Compressed Natural Gas Dispenser Market Volume Share (%), by Rest of Southeast Asia 2025 & 2033
- Figure 71: Europe Southeast Asia Compressed Natural Gas Dispenser Market Revenue (Million), by Country 2025 & 2033
- Figure 72: Europe Southeast Asia Compressed Natural Gas Dispenser Market Volume (K Unit), by Country 2025 & 2033
- Figure 73: Europe Southeast Asia Compressed Natural Gas Dispenser Market Revenue Share (%), by Country 2025 & 2033
- Figure 74: Europe Southeast Asia Compressed Natural Gas Dispenser Market Volume Share (%), by Country 2025 & 2033
- Figure 75: Middle East & Africa Southeast Asia Compressed Natural Gas Dispenser Market Revenue (Million), by Thailand 2025 & 2033
- Figure 76: Middle East & Africa Southeast Asia Compressed Natural Gas Dispenser Market Volume (K Unit), by Thailand 2025 & 2033
- Figure 77: Middle East & Africa Southeast Asia Compressed Natural Gas Dispenser Market Revenue Share (%), by Thailand 2025 & 2033
- Figure 78: Middle East & Africa Southeast Asia Compressed Natural Gas Dispenser Market Volume Share (%), by Thailand 2025 & 2033
- Figure 79: Middle East & Africa Southeast Asia Compressed Natural Gas Dispenser Market Revenue (Million), by Singapore 2025 & 2033
- Figure 80: Middle East & Africa Southeast Asia Compressed Natural Gas Dispenser Market Volume (K Unit), by Singapore 2025 & 2033
- Figure 81: Middle East & Africa Southeast Asia Compressed Natural Gas Dispenser Market Revenue Share (%), by Singapore 2025 & 2033
- Figure 82: Middle East & Africa Southeast Asia Compressed Natural Gas Dispenser Market Volume Share (%), by Singapore 2025 & 2033
- Figure 83: Middle East & Africa Southeast Asia Compressed Natural Gas Dispenser Market Revenue (Million), by Indonesia 2025 & 2033
- Figure 84: Middle East & Africa Southeast Asia Compressed Natural Gas Dispenser Market Volume (K Unit), by Indonesia 2025 & 2033
- Figure 85: Middle East & Africa Southeast Asia Compressed Natural Gas Dispenser Market Revenue Share (%), by Indonesia 2025 & 2033
- Figure 86: Middle East & Africa Southeast Asia Compressed Natural Gas Dispenser Market Volume Share (%), by Indonesia 2025 & 2033
- Figure 87: Middle East & Africa Southeast Asia Compressed Natural Gas Dispenser Market Revenue (Million), by Malaysia 2025 & 2033
- Figure 88: Middle East & Africa Southeast Asia Compressed Natural Gas Dispenser Market Volume (K Unit), by Malaysia 2025 & 2033
- Figure 89: Middle East & Africa Southeast Asia Compressed Natural Gas Dispenser Market Revenue Share (%), by Malaysia 2025 & 2033
- Figure 90: Middle East & Africa Southeast Asia Compressed Natural Gas Dispenser Market Volume Share (%), by Malaysia 2025 & 2033
- Figure 91: Middle East & Africa Southeast Asia Compressed Natural Gas Dispenser Market Revenue (Million), by Rest of Southeast Asia 2025 & 2033
- Figure 92: Middle East & Africa Southeast Asia Compressed Natural Gas Dispenser Market Volume (K Unit), by Rest of Southeast Asia 2025 & 2033
- Figure 93: Middle East & Africa Southeast Asia Compressed Natural Gas Dispenser Market Revenue Share (%), by Rest of Southeast Asia 2025 & 2033
- Figure 94: Middle East & Africa Southeast Asia Compressed Natural Gas Dispenser Market Volume Share (%), by Rest of Southeast Asia 2025 & 2033
- Figure 95: Middle East & Africa Southeast Asia Compressed Natural Gas Dispenser Market Revenue (Million), by Country 2025 & 2033
- Figure 96: Middle East & Africa Southeast Asia Compressed Natural Gas Dispenser Market Volume (K Unit), by Country 2025 & 2033
- Figure 97: Middle East & Africa Southeast Asia Compressed Natural Gas Dispenser Market Revenue Share (%), by Country 2025 & 2033
- Figure 98: Middle East & Africa Southeast Asia Compressed Natural Gas Dispenser Market Volume Share (%), by Country 2025 & 2033
- Figure 99: Asia Pacific Southeast Asia Compressed Natural Gas Dispenser Market Revenue (Million), by Thailand 2025 & 2033
- Figure 100: Asia Pacific Southeast Asia Compressed Natural Gas Dispenser Market Volume (K Unit), by Thailand 2025 & 2033
- Figure 101: Asia Pacific Southeast Asia Compressed Natural Gas Dispenser Market Revenue Share (%), by Thailand 2025 & 2033
- Figure 102: Asia Pacific Southeast Asia Compressed Natural Gas Dispenser Market Volume Share (%), by Thailand 2025 & 2033
- Figure 103: Asia Pacific Southeast Asia Compressed Natural Gas Dispenser Market Revenue (Million), by Singapore 2025 & 2033
- Figure 104: Asia Pacific Southeast Asia Compressed Natural Gas Dispenser Market Volume (K Unit), by Singapore 2025 & 2033
- Figure 105: Asia Pacific Southeast Asia Compressed Natural Gas Dispenser Market Revenue Share (%), by Singapore 2025 & 2033
- Figure 106: Asia Pacific Southeast Asia Compressed Natural Gas Dispenser Market Volume Share (%), by Singapore 2025 & 2033
- Figure 107: Asia Pacific Southeast Asia Compressed Natural Gas Dispenser Market Revenue (Million), by Indonesia 2025 & 2033
- Figure 108: Asia Pacific Southeast Asia Compressed Natural Gas Dispenser Market Volume (K Unit), by Indonesia 2025 & 2033
- Figure 109: Asia Pacific Southeast Asia Compressed Natural Gas Dispenser Market Revenue Share (%), by Indonesia 2025 & 2033
- Figure 110: Asia Pacific Southeast Asia Compressed Natural Gas Dispenser Market Volume Share (%), by Indonesia 2025 & 2033
- Figure 111: Asia Pacific Southeast Asia Compressed Natural Gas Dispenser Market Revenue (Million), by Malaysia 2025 & 2033
- Figure 112: Asia Pacific Southeast Asia Compressed Natural Gas Dispenser Market Volume (K Unit), by Malaysia 2025 & 2033
- Figure 113: Asia Pacific Southeast Asia Compressed Natural Gas Dispenser Market Revenue Share (%), by Malaysia 2025 & 2033
- Figure 114: Asia Pacific Southeast Asia Compressed Natural Gas Dispenser Market Volume Share (%), by Malaysia 2025 & 2033
- Figure 115: Asia Pacific Southeast Asia Compressed Natural Gas Dispenser Market Revenue (Million), by Rest of Southeast Asia 2025 & 2033
- Figure 116: Asia Pacific Southeast Asia Compressed Natural Gas Dispenser Market Volume (K Unit), by Rest of Southeast Asia 2025 & 2033
- Figure 117: Asia Pacific Southeast Asia Compressed Natural Gas Dispenser Market Revenue Share (%), by Rest of Southeast Asia 2025 & 2033
- Figure 118: Asia Pacific Southeast Asia Compressed Natural Gas Dispenser Market Volume Share (%), by Rest of Southeast Asia 2025 & 2033
- Figure 119: Asia Pacific Southeast Asia Compressed Natural Gas Dispenser Market Revenue (Million), by Country 2025 & 2033
- Figure 120: Asia Pacific Southeast Asia Compressed Natural Gas Dispenser Market Volume (K Unit), by Country 2025 & 2033
- Figure 121: Asia Pacific Southeast Asia Compressed Natural Gas Dispenser Market Revenue Share (%), by Country 2025 & 2033
- Figure 122: Asia Pacific Southeast Asia Compressed Natural Gas Dispenser Market Volume Share (%), by Country 2025 & 2033
List of Tables
- Table 1: Global Southeast Asia Compressed Natural Gas Dispenser Market Revenue Million Forecast, by Thailand 2020 & 2033
- Table 2: Global Southeast Asia Compressed Natural Gas Dispenser Market Volume K Unit Forecast, by Thailand 2020 & 2033
- Table 3: Global Southeast Asia Compressed Natural Gas Dispenser Market Revenue Million Forecast, by Singapore 2020 & 2033
- Table 4: Global Southeast Asia Compressed Natural Gas Dispenser Market Volume K Unit Forecast, by Singapore 2020 & 2033
- Table 5: Global Southeast Asia Compressed Natural Gas Dispenser Market Revenue Million Forecast, by Indonesia 2020 & 2033
- Table 6: Global Southeast Asia Compressed Natural Gas Dispenser Market Volume K Unit Forecast, by Indonesia 2020 & 2033
- Table 7: Global Southeast Asia Compressed Natural Gas Dispenser Market Revenue Million Forecast, by Malaysia 2020 & 2033
- Table 8: Global Southeast Asia Compressed Natural Gas Dispenser Market Volume K Unit Forecast, by Malaysia 2020 & 2033
- Table 9: Global Southeast Asia Compressed Natural Gas Dispenser Market Revenue Million Forecast, by Rest of Southeast Asia 2020 & 2033
- Table 10: Global Southeast Asia Compressed Natural Gas Dispenser Market Volume K Unit Forecast, by Rest of Southeast Asia 2020 & 2033
- Table 11: Global Southeast Asia Compressed Natural Gas Dispenser Market Revenue Million Forecast, by Region 2020 & 2033
- Table 12: Global Southeast Asia Compressed Natural Gas Dispenser Market Volume K Unit Forecast, by Region 2020 & 2033
- Table 13: Global Southeast Asia Compressed Natural Gas Dispenser Market Revenue Million Forecast, by Thailand 2020 & 2033
- Table 14: Global Southeast Asia Compressed Natural Gas Dispenser Market Volume K Unit Forecast, by Thailand 2020 & 2033
- Table 15: Global Southeast Asia Compressed Natural Gas Dispenser Market Revenue Million Forecast, by Singapore 2020 & 2033
- Table 16: Global Southeast Asia Compressed Natural Gas Dispenser Market Volume K Unit Forecast, by Singapore 2020 & 2033
- Table 17: Global Southeast Asia Compressed Natural Gas Dispenser Market Revenue Million Forecast, by Indonesia 2020 & 2033
- Table 18: Global Southeast Asia Compressed Natural Gas Dispenser Market Volume K Unit Forecast, by Indonesia 2020 & 2033
- Table 19: Global Southeast Asia Compressed Natural Gas Dispenser Market Revenue Million Forecast, by Malaysia 2020 & 2033
- Table 20: Global Southeast Asia Compressed Natural Gas Dispenser Market Volume K Unit Forecast, by Malaysia 2020 & 2033
- Table 21: Global Southeast Asia Compressed Natural Gas Dispenser Market Revenue Million Forecast, by Rest of Southeast Asia 2020 & 2033
- Table 22: Global Southeast Asia Compressed Natural Gas Dispenser Market Volume K Unit Forecast, by Rest of Southeast Asia 2020 & 2033
- Table 23: Global Southeast Asia Compressed Natural Gas Dispenser Market Revenue Million Forecast, by Country 2020 & 2033
- Table 24: Global Southeast Asia Compressed Natural Gas Dispenser Market Volume K Unit Forecast, by Country 2020 & 2033
- Table 25: United States Southeast Asia Compressed Natural Gas Dispenser Market Revenue (Million) Forecast, by Application 2020 & 2033
- Table 26: United States Southeast Asia Compressed Natural Gas Dispenser Market Volume (K Unit) Forecast, by Application 2020 & 2033
- Table 27: Canada Southeast Asia Compressed Natural Gas Dispenser Market Revenue (Million) Forecast, by Application 2020 & 2033
- Table 28: Canada Southeast Asia Compressed Natural Gas Dispenser Market Volume (K Unit) Forecast, by Application 2020 & 2033
- Table 29: Mexico Southeast Asia Compressed Natural Gas Dispenser Market Revenue (Million) Forecast, by Application 2020 & 2033
- Table 30: Mexico Southeast Asia Compressed Natural Gas Dispenser Market Volume (K Unit) Forecast, by Application 2020 & 2033
- Table 31: Global Southeast Asia Compressed Natural Gas Dispenser Market Revenue Million Forecast, by Thailand 2020 & 2033
- Table 32: Global Southeast Asia Compressed Natural Gas Dispenser Market Volume K Unit Forecast, by Thailand 2020 & 2033
- Table 33: Global Southeast Asia Compressed Natural Gas Dispenser Market Revenue Million Forecast, by Singapore 2020 & 2033
- Table 34: Global Southeast Asia Compressed Natural Gas Dispenser Market Volume K Unit Forecast, by Singapore 2020 & 2033
- Table 35: Global Southeast Asia Compressed Natural Gas Dispenser Market Revenue Million Forecast, by Indonesia 2020 & 2033
- Table 36: Global Southeast Asia Compressed Natural Gas Dispenser Market Volume K Unit Forecast, by Indonesia 2020 & 2033
- Table 37: Global Southeast Asia Compressed Natural Gas Dispenser Market Revenue Million Forecast, by Malaysia 2020 & 2033
- Table 38: Global Southeast Asia Compressed Natural Gas Dispenser Market Volume K Unit Forecast, by Malaysia 2020 & 2033
- Table 39: Global Southeast Asia Compressed Natural Gas Dispenser Market Revenue Million Forecast, by Rest of Southeast Asia 2020 & 2033
- Table 40: Global Southeast Asia Compressed Natural Gas Dispenser Market Volume K Unit Forecast, by Rest of Southeast Asia 2020 & 2033
- Table 41: Global Southeast Asia Compressed Natural Gas Dispenser Market Revenue Million Forecast, by Country 2020 & 2033
- Table 42: Global Southeast Asia Compressed Natural Gas Dispenser Market Volume K Unit Forecast, by Country 2020 & 2033
- Table 43: Brazil Southeast Asia Compressed Natural Gas Dispenser Market Revenue (Million) Forecast, by Application 2020 & 2033
- Table 44: Brazil Southeast Asia Compressed Natural Gas Dispenser Market Volume (K Unit) Forecast, by Application 2020 & 2033
- Table 45: Argentina Southeast Asia Compressed Natural Gas Dispenser Market Revenue (Million) Forecast, by Application 2020 & 2033
- Table 46: Argentina Southeast Asia Compressed Natural Gas Dispenser Market Volume (K Unit) Forecast, by Application 2020 & 2033
- Table 47: Rest of South America Southeast Asia Compressed Natural Gas Dispenser Market Revenue (Million) Forecast, by Application 2020 & 2033
- Table 48: Rest of South America Southeast Asia Compressed Natural Gas Dispenser Market Volume (K Unit) Forecast, by Application 2020 & 2033
- Table 49: Global Southeast Asia Compressed Natural Gas Dispenser Market Revenue Million Forecast, by Thailand 2020 & 2033
- Table 50: Global Southeast Asia Compressed Natural Gas Dispenser Market Volume K Unit Forecast, by Thailand 2020 & 2033
- Table 51: Global Southeast Asia Compressed Natural Gas Dispenser Market Revenue Million Forecast, by Singapore 2020 & 2033
- Table 52: Global Southeast Asia Compressed Natural Gas Dispenser Market Volume K Unit Forecast, by Singapore 2020 & 2033
- Table 53: Global Southeast Asia Compressed Natural Gas Dispenser Market Revenue Million Forecast, by Indonesia 2020 & 2033
- Table 54: Global Southeast Asia Compressed Natural Gas Dispenser Market Volume K Unit Forecast, by Indonesia 2020 & 2033
- Table 55: Global Southeast Asia Compressed Natural Gas Dispenser Market Revenue Million Forecast, by Malaysia 2020 & 2033
- Table 56: Global Southeast Asia Compressed Natural Gas Dispenser Market Volume K Unit Forecast, by Malaysia 2020 & 2033
- Table 57: Global Southeast Asia Compressed Natural Gas Dispenser Market Revenue Million Forecast, by Rest of Southeast Asia 2020 & 2033
- Table 58: Global Southeast Asia Compressed Natural Gas Dispenser Market Volume K Unit Forecast, by Rest of Southeast Asia 2020 & 2033
- Table 59: Global Southeast Asia Compressed Natural Gas Dispenser Market Revenue Million Forecast, by Country 2020 & 2033
- Table 60: Global Southeast Asia Compressed Natural Gas Dispenser Market Volume K Unit Forecast, by Country 2020 & 2033
- Table 61: United Kingdom Southeast Asia Compressed Natural Gas Dispenser Market Revenue (Million) Forecast, by Application 2020 & 2033
- Table 62: United Kingdom Southeast Asia Compressed Natural Gas Dispenser Market Volume (K Unit) Forecast, by Application 2020 & 2033
- Table 63: Germany Southeast Asia Compressed Natural Gas Dispenser Market Revenue (Million) Forecast, by Application 2020 & 2033
- Table 64: Germany Southeast Asia Compressed Natural Gas Dispenser Market Volume (K Unit) Forecast, by Application 2020 & 2033
- Table 65: France Southeast Asia Compressed Natural Gas Dispenser Market Revenue (Million) Forecast, by Application 2020 & 2033
- Table 66: France Southeast Asia Compressed Natural Gas Dispenser Market Volume (K Unit) Forecast, by Application 2020 & 2033
- Table 67: Italy Southeast Asia Compressed Natural Gas Dispenser Market Revenue (Million) Forecast, by Application 2020 & 2033
- Table 68: Italy Southeast Asia Compressed Natural Gas Dispenser Market Volume (K Unit) Forecast, by Application 2020 & 2033
- Table 69: Spain Southeast Asia Compressed Natural Gas Dispenser Market Revenue (Million) Forecast, by Application 2020 & 2033
- Table 70: Spain Southeast Asia Compressed Natural Gas Dispenser Market Volume (K Unit) Forecast, by Application 2020 & 2033
- Table 71: Russia Southeast Asia Compressed Natural Gas Dispenser Market Revenue (Million) Forecast, by Application 2020 & 2033
- Table 72: Russia Southeast Asia Compressed Natural Gas Dispenser Market Volume (K Unit) Forecast, by Application 2020 & 2033
- Table 73: Benelux Southeast Asia Compressed Natural Gas Dispenser Market Revenue (Million) Forecast, by Application 2020 & 2033
- Table 74: Benelux Southeast Asia Compressed Natural Gas Dispenser Market Volume (K Unit) Forecast, by Application 2020 & 2033
- Table 75: Nordics Southeast Asia Compressed Natural Gas Dispenser Market Revenue (Million) Forecast, by Application 2020 & 2033
- Table 76: Nordics Southeast Asia Compressed Natural Gas Dispenser Market Volume (K Unit) Forecast, by Application 2020 & 2033
- Table 77: Rest of Europe Southeast Asia Compressed Natural Gas Dispenser Market Revenue (Million) Forecast, by Application 2020 & 2033
- Table 78: Rest of Europe Southeast Asia Compressed Natural Gas Dispenser Market Volume (K Unit) Forecast, by Application 2020 & 2033
- Table 79: Global Southeast Asia Compressed Natural Gas Dispenser Market Revenue Million Forecast, by Thailand 2020 & 2033
- Table 80: Global Southeast Asia Compressed Natural Gas Dispenser Market Volume K Unit Forecast, by Thailand 2020 & 2033
- Table 81: Global Southeast Asia Compressed Natural Gas Dispenser Market Revenue Million Forecast, by Singapore 2020 & 2033
- Table 82: Global Southeast Asia Compressed Natural Gas Dispenser Market Volume K Unit Forecast, by Singapore 2020 & 2033
- Table 83: Global Southeast Asia Compressed Natural Gas Dispenser Market Revenue Million Forecast, by Indonesia 2020 & 2033
- Table 84: Global Southeast Asia Compressed Natural Gas Dispenser Market Volume K Unit Forecast, by Indonesia 2020 & 2033
- Table 85: Global Southeast Asia Compressed Natural Gas Dispenser Market Revenue Million Forecast, by Malaysia 2020 & 2033
- Table 86: Global Southeast Asia Compressed Natural Gas Dispenser Market Volume K Unit Forecast, by Malaysia 2020 & 2033
- Table 87: Global Southeast Asia Compressed Natural Gas Dispenser Market Revenue Million Forecast, by Rest of Southeast Asia 2020 & 2033
- Table 88: Global Southeast Asia Compressed Natural Gas Dispenser Market Volume K Unit Forecast, by Rest of Southeast Asia 2020 & 2033
- Table 89: Global Southeast Asia Compressed Natural Gas Dispenser Market Revenue Million Forecast, by Country 2020 & 2033
- Table 90: Global Southeast Asia Compressed Natural Gas Dispenser Market Volume K Unit Forecast, by Country 2020 & 2033
- Table 91: Turkey Southeast Asia Compressed Natural Gas Dispenser Market Revenue (Million) Forecast, by Application 2020 & 2033
- Table 92: Turkey Southeast Asia Compressed Natural Gas Dispenser Market Volume (K Unit) Forecast, by Application 2020 & 2033
- Table 93: Israel Southeast Asia Compressed Natural Gas Dispenser Market Revenue (Million) Forecast, by Application 2020 & 2033
- Table 94: Israel Southeast Asia Compressed Natural Gas Dispenser Market Volume (K Unit) Forecast, by Application 2020 & 2033
- Table 95: GCC Southeast Asia Compressed Natural Gas Dispenser Market Revenue (Million) Forecast, by Application 2020 & 2033
- Table 96: GCC Southeast Asia Compressed Natural Gas Dispenser Market Volume (K Unit) Forecast, by Application 2020 & 2033
- Table 97: North Africa Southeast Asia Compressed Natural Gas Dispenser Market Revenue (Million) Forecast, by Application 2020 & 2033
- Table 98: North Africa Southeast Asia Compressed Natural Gas Dispenser Market Volume (K Unit) Forecast, by Application 2020 & 2033
- Table 99: South Africa Southeast Asia Compressed Natural Gas Dispenser Market Revenue (Million) Forecast, by Application 2020 & 2033
- Table 100: South Africa Southeast Asia Compressed Natural Gas Dispenser Market Volume (K Unit) Forecast, by Application 2020 & 2033
- Table 101: Rest of Middle East & Africa Southeast Asia Compressed Natural Gas Dispenser Market Revenue (Million) Forecast, by Application 2020 & 2033
- Table 102: Rest of Middle East & Africa Southeast Asia Compressed Natural Gas Dispenser Market Volume (K Unit) Forecast, by Application 2020 & 2033
- Table 103: Global Southeast Asia Compressed Natural Gas Dispenser Market Revenue Million Forecast, by Thailand 2020 & 2033
- Table 104: Global Southeast Asia Compressed Natural Gas Dispenser Market Volume K Unit Forecast, by Thailand 2020 & 2033
- Table 105: Global Southeast Asia Compressed Natural Gas Dispenser Market Revenue Million Forecast, by Singapore 2020 & 2033
- Table 106: Global Southeast Asia Compressed Natural Gas Dispenser Market Volume K Unit Forecast, by Singapore 2020 & 2033
- Table 107: Global Southeast Asia Compressed Natural Gas Dispenser Market Revenue Million Forecast, by Indonesia 2020 & 2033
- Table 108: Global Southeast Asia Compressed Natural Gas Dispenser Market Volume K Unit Forecast, by Indonesia 2020 & 2033
- Table 109: Global Southeast Asia Compressed Natural Gas Dispenser Market Revenue Million Forecast, by Malaysia 2020 & 2033
- Table 110: Global Southeast Asia Compressed Natural Gas Dispenser Market Volume K Unit Forecast, by Malaysia 2020 & 2033
- Table 111: Global Southeast Asia Compressed Natural Gas Dispenser Market Revenue Million Forecast, by Rest of Southeast Asia 2020 & 2033
- Table 112: Global Southeast Asia Compressed Natural Gas Dispenser Market Volume K Unit Forecast, by Rest of Southeast Asia 2020 & 2033
- Table 113: Global Southeast Asia Compressed Natural Gas Dispenser Market Revenue Million Forecast, by Country 2020 & 2033
- Table 114: Global Southeast Asia Compressed Natural Gas Dispenser Market Volume K Unit Forecast, by Country 2020 & 2033
- Table 115: China Southeast Asia Compressed Natural Gas Dispenser Market Revenue (Million) Forecast, by Application 2020 & 2033
- Table 116: China Southeast Asia Compressed Natural Gas Dispenser Market Volume (K Unit) Forecast, by Application 2020 & 2033
- Table 117: India Southeast Asia Compressed Natural Gas Dispenser Market Revenue (Million) Forecast, by Application 2020 & 2033
- Table 118: India Southeast Asia Compressed Natural Gas Dispenser Market Volume (K Unit) Forecast, by Application 2020 & 2033
- Table 119: Japan Southeast Asia Compressed Natural Gas Dispenser Market Revenue (Million) Forecast, by Application 2020 & 2033
- Table 120: Japan Southeast Asia Compressed Natural Gas Dispenser Market Volume (K Unit) Forecast, by Application 2020 & 2033
- Table 121: South Korea Southeast Asia Compressed Natural Gas Dispenser Market Revenue (Million) Forecast, by Application 2020 & 2033
- Table 122: South Korea Southeast Asia Compressed Natural Gas Dispenser Market Volume (K Unit) Forecast, by Application 2020 & 2033
- Table 123: ASEAN Southeast Asia Compressed Natural Gas Dispenser Market Revenue (Million) Forecast, by Application 2020 & 2033
- Table 124: ASEAN Southeast Asia Compressed Natural Gas Dispenser Market Volume (K Unit) Forecast, by Application 2020 & 2033
- Table 125: Oceania Southeast Asia Compressed Natural Gas Dispenser Market Revenue (Million) Forecast, by Application 2020 & 2033
- Table 126: Oceania Southeast Asia Compressed Natural Gas Dispenser Market Volume (K Unit) Forecast, by Application 2020 & 2033
- Table 127: Rest of Asia Pacific Southeast Asia Compressed Natural Gas Dispenser Market Revenue (Million) Forecast, by Application 2020 & 2033
- Table 128: Rest of Asia Pacific Southeast Asia Compressed Natural Gas Dispenser Market Volume (K Unit) Forecast, by Application 2020 & 2033
Frequently Asked Questions
1. What is the projected Compound Annual Growth Rate (CAGR) of the Southeast Asia Compressed Natural Gas Dispenser Market?
The projected CAGR is approximately 8.39%.
2. Which companies are prominent players in the Southeast Asia Compressed Natural Gas Dispenser Market?
Key companies in the market include Censtar Science & Technology Co Ltd, ComTech Energy, Scheidt & Bachmann Gmbh, Sanki Industry Group, Tatsuno Europe AS, TGT Fuel Technologies India Pvt Ltd , Gilbarco Inc, Greka Engineering, FTI International Group Inc, Parker Hannifin Corp.
3. What are the main segments of the Southeast Asia Compressed Natural Gas Dispenser Market?
The market segments include Thailand, Singapore, Indonesia, Malaysia, Rest of Southeast Asia.
4. Can you provide details about the market size?
The market size is estimated to be USD 38.22 Million as of 2022.
5. What are some drivers contributing to market growth?
4.; Growing Demand for Compressed Natural Gas.
6. What are the notable trends driving market growth?
Increasing Natural Gas Consumption Expected to Drive the Market.
7. Are there any restraints impacting market growth?
4.; Rising Alternate Fuel Sources such as Batteries.
8. Can you provide examples of recent developments in the market?
N/A
9. What pricing options are available for accessing the report?
Pricing options include single-user, multi-user, and enterprise licenses priced at USD 4750, USD 5250, and USD 8750 respectively.
10. Is the market size provided in terms of value or volume?
The market size is provided in terms of value, measured in Million and volume, measured in K Unit.
11. Are there any specific market keywords associated with the report?
Yes, the market keyword associated with the report is "Southeast Asia Compressed Natural Gas Dispenser Market," which aids in identifying and referencing the specific market segment covered.
12. How do I determine which pricing option suits my needs best?
The pricing options vary based on user requirements and access needs. Individual users may opt for single-user licenses, while businesses requiring broader access may choose multi-user or enterprise licenses for cost-effective access to the report.
13. Are there any additional resources or data provided in the Southeast Asia Compressed Natural Gas Dispenser Market report?
While the report offers comprehensive insights, it's advisable to review the specific contents or supplementary materials provided to ascertain if additional resources or data are available.
14. How can I stay updated on further developments or reports in the Southeast Asia Compressed Natural Gas Dispenser Market?
To stay informed about further developments, trends, and reports in the Southeast Asia Compressed Natural Gas Dispenser Market, consider subscribing to industry newsletters, following relevant companies and organizations, or regularly checking reputable industry news sources and publications.
Methodology
Step 1 - Identification of Relevant Samples Size from Population Database


Step 2 - Approaches for Defining Global Market Size (Value, Volume* & Price*)

Note*: In applicable scenarios
Step 3 - Data Sources
Primary Research
- Web Analytics
- Survey Reports
- Research Institute
- Latest Research Reports
- Opinion Leaders
Secondary Research
- Annual Reports
- White Paper
- Latest Press Release
- Industry Association
- Paid Database
- Investor Presentations

Step 4 - Data Triangulation
Involves using different sources of information in order to increase the validity of a study
These sources are likely to be stakeholders in a program - participants, other researchers, program staff, other community members, and so on.
Then we put all data in single framework & apply various statistical tools to find out the dynamic on the market.
During the analysis stage, feedback from the stakeholder groups would be compared to determine areas of agreement as well as areas of divergence