

Key Insights
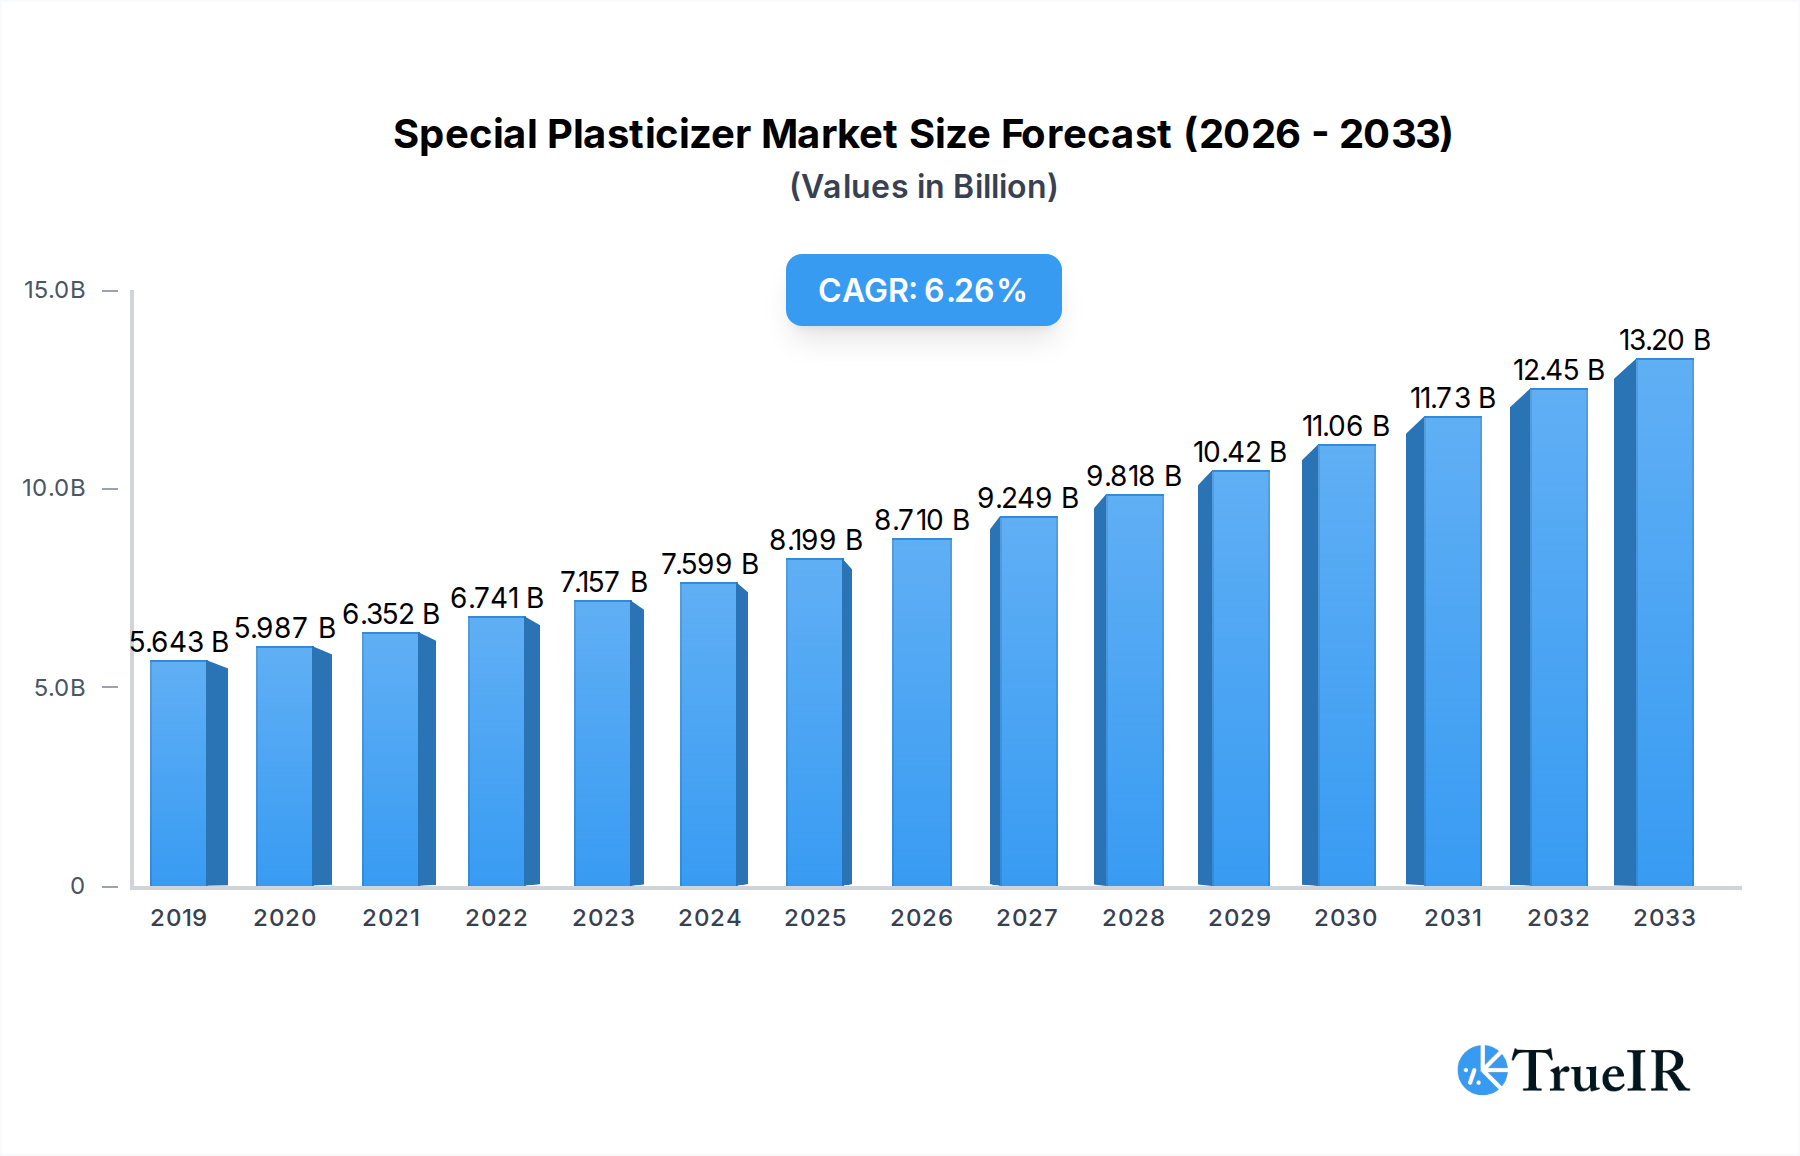
The global Special Plasticizer market is poised for significant growth, with a projected market size of 8199 million by 2025, driven by a robust Compound Annual Growth Rate (CAGR) of 6.2% anticipated over the forecast period of 2025-2033. This expansion is fueled by increasing demand from diverse end-use industries, including architecture, medical devices, automotive components, and food packaging. The growing emphasis on enhanced product performance, flexibility, and durability in these sectors directly translates to a higher consumption of specialized plasticizers. Furthermore, advancements in material science and the development of innovative plasticizer formulations are contributing to market penetration. The trend towards sustainable and bio-based plasticizers, driven by environmental regulations and consumer preferences, is also a key growth catalyst, encouraging manufacturers to invest in eco-friendly alternatives. The market's dynamism is further underscored by ongoing research and development efforts aimed at creating plasticizers with improved properties, such as higher efficiency, lower migration, and better compatibility with various polymers.

Special Plasticizer Market Size (In Billion)
Despite the optimistic outlook, the Special Plasticizer market faces certain restraints that could influence its trajectory. Stringent environmental regulations regarding the use of certain chemical compounds, coupled with concerns over the health implications of some traditional plasticizers, are prompting a shift towards safer and more sustainable options. This transition, while a driver for innovation, can also present challenges in terms of reformulation costs and the adoption of new technologies. Additionally, the price volatility of raw materials used in plasticizer production can impact profit margins for manufacturers. The competitive landscape is characterized by the presence of major global players and a growing number of regional manufacturers, intensifying competition and potentially leading to price pressures. However, the continuous innovation in product development, the increasing adoption of plasticizers in emerging economies, and the expanding applications in high-growth sectors are expected to largely offset these challenges, ensuring a healthy growth trajectory for the Special Plasticizer market.
Special Plasticizer Company Market Share
Special Plasticizer Market Analysis: Unlocking Growth and Innovation
This comprehensive report delves into the dynamic Special Plasticizer Market, a critical component for enhancing the performance and versatility of polymers across numerous high-value industries. With a robust study period spanning from 2019 to 2033, including a base year of 2025 and a forecast period from 2025 to 2033, this analysis provides deep insights into market dynamics, competitive landscapes, and future trajectories. Leveraging extensive historical data from 2019–2024, this report equips stakeholders with the intelligence needed to navigate evolving market conditions and capitalize on emerging opportunities in the global special plasticizer industry.
Special Plasticizer Market Structure & Competitive Landscape
The special plasticizer market exhibits a moderately concentrated structure, with a blend of large multinational corporations and specialized regional players driving innovation and market share. Key companies such as Emery Oleochemicals, Condensia, Polynt, BASF, Adeka, Arkema, Hallstar, ExxonMobil Chemical, KLJ Group, DIC, Mitsubishi Chemical, Eastman, Lanxess, Nayakem Organics, DOW, Cargil, Zhejiang Jiaao Environmental Protection Department, UPC Technology, and Yuanli Chem are actively engaged in research and development, product differentiation, and strategic collaborations. Innovation is a primary driver, fueled by the demand for enhanced performance characteristics like improved flexibility, durability, and thermal resistance in end-use applications. Regulatory impacts, particularly concerning environmental sustainability and health safety, are increasingly shaping product formulations and market access. The threat of product substitutes, while present, is mitigated by the unique performance advantages offered by specialized plasticizers in demanding applications. End-user segmentation, with substantial contributions from Architecture, Medical, Automobile, and Food Packaging sectors, dictates the demand for specific plasticizer types. Merger and acquisition (M&A) activities, though not at an extremely high volume, are observed as companies seek to expand their product portfolios, geographical reach, and technological capabilities. Quantitative analysis indicates that the top five players hold an estimated XX% market share, with ongoing M&A deals totaling approximately $XX million in the historical period.
Special Plasticizer Market Trends & Opportunities
The special plasticizer market is poised for significant expansion, driven by a confluence of technological advancements, evolving consumer preferences, and expanding industrial applications. The estimated market size is projected to reach over $XX million by 2033, exhibiting a compound annual growth rate (CAGR) of approximately XX% over the forecast period. This robust growth is underpinned by the increasing demand for high-performance materials in critical sectors. In the Automobile segment, the drive towards lightweighting and enhanced interior comfort fuels the adoption of specialized plasticizers for interior components, wiring, and under-the-hood applications, contributing an estimated XX% to the overall market. The Medical industry's continuous innovation in devices and equipment necessitates the use of biocompatible and high-purity plasticizers, representing a segment with a projected CAGR of XX%. The Architecture sector benefits from special plasticizers used in advanced roofing membranes, resilient flooring, and high-performance coatings, addressing demands for durability and energy efficiency. Food Packaging applications are witnessing a shift towards safer and more functional plasticizers, aligning with stringent regulatory requirements and consumer expectations for product safety, with an estimated market penetration rate of XX% in this segment. Technological shifts are leaning towards bio-based and phthalate-free plasticizers, driven by sustainability initiatives and regulatory pressures. This presents a substantial opportunity for manufacturers who can develop and scale production of these environmentally friendly alternatives. Consumer preferences are increasingly influenced by product sustainability and health considerations, favoring materials with a lower environmental footprint and no adverse health effects. This trend is particularly evident in sensitive applications like food packaging and medical devices. The competitive dynamics are intensifying, with established players investing heavily in R&D to introduce next-generation special plasticizers that offer superior performance, cost-effectiveness, and improved environmental profiles. Emerging economies are also becoming significant growth hubs, driven by rapid industrialization and infrastructure development, further expanding the market penetration of special plasticizers. The Other application segment, encompassing industries like textiles, wire and cable, and consumer goods, also contributes steadily to market growth, driven by the need for specific material properties. The market is dynamic, with continuous product innovation and strategic partnerships shaping the competitive landscape and creating a fertile ground for growth and investment.
Dominant Markets & Segments in Special Plasticizer
The Special Plasticizer Market is characterized by distinct regional dominance and significant contributions from specific application and product type segments. Geographically, Asia-Pacific emerges as the dominant region, primarily driven by the robust industrial manufacturing base and rapid infrastructure development in countries like China and India. This region accounts for an estimated XX% of the global special plasticizer market share. The Architecture application segment is a major growth engine, fueled by substantial investments in construction and renovation projects worldwide. Key growth drivers include increased urbanization, government initiatives promoting sustainable building practices, and the demand for durable and high-performance building materials. Within this segment, the use of special plasticizers in resilient flooring, roofing membranes, and sealants is particularly prominent, contributing an estimated XX% to the market. The Automobile sector is another critical segment, driven by the increasing production of vehicles and the growing demand for lightweight, flexible, and durable interior and exterior components. The emphasis on enhanced safety features and interior comfort further boosts the adoption of specialized plasticizers. Policies promoting electric vehicles and stringent emission standards are indirectly influencing the demand for advanced plasticizers that can withstand higher operating temperatures and offer improved electrical insulation properties. The Medical application segment, though smaller in volume, represents a high-value niche with consistent growth. The demand for biocompatible, non-toxic, and kink-resistant plasticizers for medical devices such as tubing, bags, and catheters is on the rise. Stringent regulatory approvals and the need for high purity are key factors in this segment, with its CAGR projected to be XX%.
In terms of product types, Polymeric Plasticizers are witnessing increasing adoption due to their superior performance characteristics, such as low migration, excellent permanence, and enhanced durability. Their higher molecular weight and chemical structure make them ideal for applications requiring long-term stability and resistance to extraction, such as in automotive interiors and high-performance cables. The demand for polymeric plasticizers is estimated to reach XX% of the total market by 2033. Monomeric Plasticizers, while still significant, are facing increased scrutiny in certain applications due to regulatory concerns and the growing preference for alternatives with better environmental and health profiles. However, they continue to hold a strong position in cost-sensitive applications and where their specific performance attributes are unmatched. The market dominance is further solidified by the continuous innovation in product formulations, aiming to address specific end-user requirements and regulatory landscapes.
Special Plasticizer Product Analysis
Special plasticizer product innovation is sharply focused on enhancing material performance and addressing growing sustainability demands. Manufacturers are actively developing advanced formulations that offer improved flexibility, superior resistance to extreme temperatures, and increased longevity for polymers. Key advancements include the introduction of bio-based and phthalate-free plasticizers, aligning with global environmental regulations and consumer preferences for safer materials. These novel products find critical applications in demanding sectors like automotive interiors, medical devices, and food packaging, where their unique properties provide a competitive advantage and ensure compliance with stringent industry standards.
Key Drivers, Barriers & Challenges in Special Plasticizer
Key Drivers: The special plasticizer market is propelled by several key forces. Technological advancements in polymer science and material engineering are driving the development of new plasticizers with enhanced properties. Growing demand for high-performance polymers in industries like automotive, construction, and healthcare necessitates specialized plasticizer solutions. Increasing environmental consciousness and regulatory pressures favoring sustainable and non-toxic alternatives are spurring innovation in bio-based and phthalate-free plasticizers. Economic growth, particularly in emerging economies, fuels increased consumption of manufactured goods that utilize plasticizers.
Key Barriers & Challenges: The market faces several hurdles. Stringent regulatory frameworks and evolving environmental standards can lead to compliance costs and market access challenges for certain plasticizer types. Volatility in raw material prices, particularly for petrochemical-based feedstocks, can impact production costs and profit margins. Intense competition from established players and new entrants can lead to price pressures. Supply chain disruptions and geopolitical factors can affect the availability and cost of raw materials, impacting production schedules.
Growth Drivers in the Special Plasticizer Market
The special plasticizer market is experiencing robust growth driven by several interconnected factors. Technological innovation is a primary catalyst, with ongoing research and development yielding novel plasticizers offering superior performance characteristics, such as enhanced flexibility, improved durability, and greater thermal stability. The increasing demand for high-performance polymers across diverse sectors like automotive, architecture, and medical devices directly translates to a higher need for specialized plasticizers that can meet these stringent application requirements. Furthermore, growing global awareness regarding environmental sustainability and health safety is significantly shaping the market. This trend is propelling the adoption of bio-based and phthalate-free plasticizers, creating substantial opportunities for manufacturers who can offer eco-friendly and compliant solutions. Government initiatives and evolving regulatory landscapes in many regions are actively promoting the use of safer and more sustainable chemical additives, further accelerating this shift.
Challenges Impacting Special Plasticizer Growth
Despite the positive growth trajectory, the special plasticizer market is not without its challenges. Regulatory complexities remain a significant factor; evolving environmental regulations and health safety standards can necessitate costly product reformulation and compliance procedures, potentially limiting market access for certain plasticizer types. Supply chain issues, including the availability and price volatility of key raw materials like petrochemical derivatives, can lead to production cost fluctuations and impact the overall profitability of manufacturers. Intense competitive pressures from both established global players and emerging regional manufacturers can result in price erosion and necessitate continuous innovation to maintain market share. Additionally, the perceived environmental impact of some traditional plasticizers continues to be a concern, pushing for greater transparency and the development of demonstrably sustainable alternatives.
Key Players Shaping the Special Plasticizer Market
- Emery Oleochemicals
- Condensia
- Polynt
- BASF
- Adeka
- Arkema
- Hallstar
- ExxonMobil Chemical
- KLJ Group
- DIC
- Mitsubishi Chemical
- Eastman
- Lanxess
- Nayakem Organics
- DOW
- Cargil
- Zhejiang Jiaao Environmental Protection Department
- UPC Technology
- Yuanli Chem
Significant Special Plasticizer Industry Milestones
- 2019: Increased focus on bio-based plasticizer development and market introduction by several key players.
- 2020: Heightened regulatory scrutiny on specific phthalate plasticizers in regions like Europe and North America, driving a shift towards alternatives.
- 2021: Major advancements in polymeric plasticizer formulations for enhanced durability and low migration properties, particularly for automotive applications.
- 2022: Significant M&A activity as companies sought to consolidate market positions and expand their product portfolios in the specialty plasticizer segment.
- 2023: Growing demand for specialized plasticizers in medical devices due to increased healthcare investments and innovations in medical technology.
- 2024: Emergence of new players with innovative, sustainable plasticizer solutions, intensifying market competition.
Future Outlook for Special Plasticizer Market
The future outlook for the special plasticizer market is exceptionally promising, characterized by sustained growth and significant strategic opportunities. The escalating demand for high-performance, sustainable, and safer materials across industries like automotive, medical, and architecture will continue to be the primary growth catalyst. The ongoing shift towards bio-based and phthalate-free plasticizers presents a substantial market potential for innovators and early adopters. Furthermore, the expansion of key end-use industries in emerging economies is expected to further drive market penetration. Strategic investments in research and development, focused on developing next-generation plasticizers with superior properties and enhanced environmental profiles, will be crucial for competitive advantage. Collaborations between material manufacturers, end-users, and regulatory bodies will also play a vital role in shaping the market's future trajectory towards greater sustainability and performance.
Special Plasticizer Segmentation
-
1. Application
- 1.1. Architecture
- 1.2. Medical
- 1.3. Automobile
- 1.4. Food Packaging
- 1.5. Others
-
2. Type
- 2.1. Polymeric Plasticizer
- 2.2. Monomeric Plasticizer
Special Plasticizer Segmentation By Geography
-
1. North America
- 1.1. United States
- 1.2. Canada
- 1.3. Mexico
-
2. South America
- 2.1. Brazil
- 2.2. Argentina
- 2.3. Rest of South America
-
3. Europe
- 3.1. United Kingdom
- 3.2. Germany
- 3.3. France
- 3.4. Italy
- 3.5. Spain
- 3.6. Russia
- 3.7. Benelux
- 3.8. Nordics
- 3.9. Rest of Europe
-
4. Middle East & Africa
- 4.1. Turkey
- 4.2. Israel
- 4.3. GCC
- 4.4. North Africa
- 4.5. South Africa
- 4.6. Rest of Middle East & Africa
-
5. Asia Pacific
- 5.1. China
- 5.2. India
- 5.3. Japan
- 5.4. South Korea
- 5.5. ASEAN
- 5.6. Oceania
- 5.7. Rest of Asia Pacific
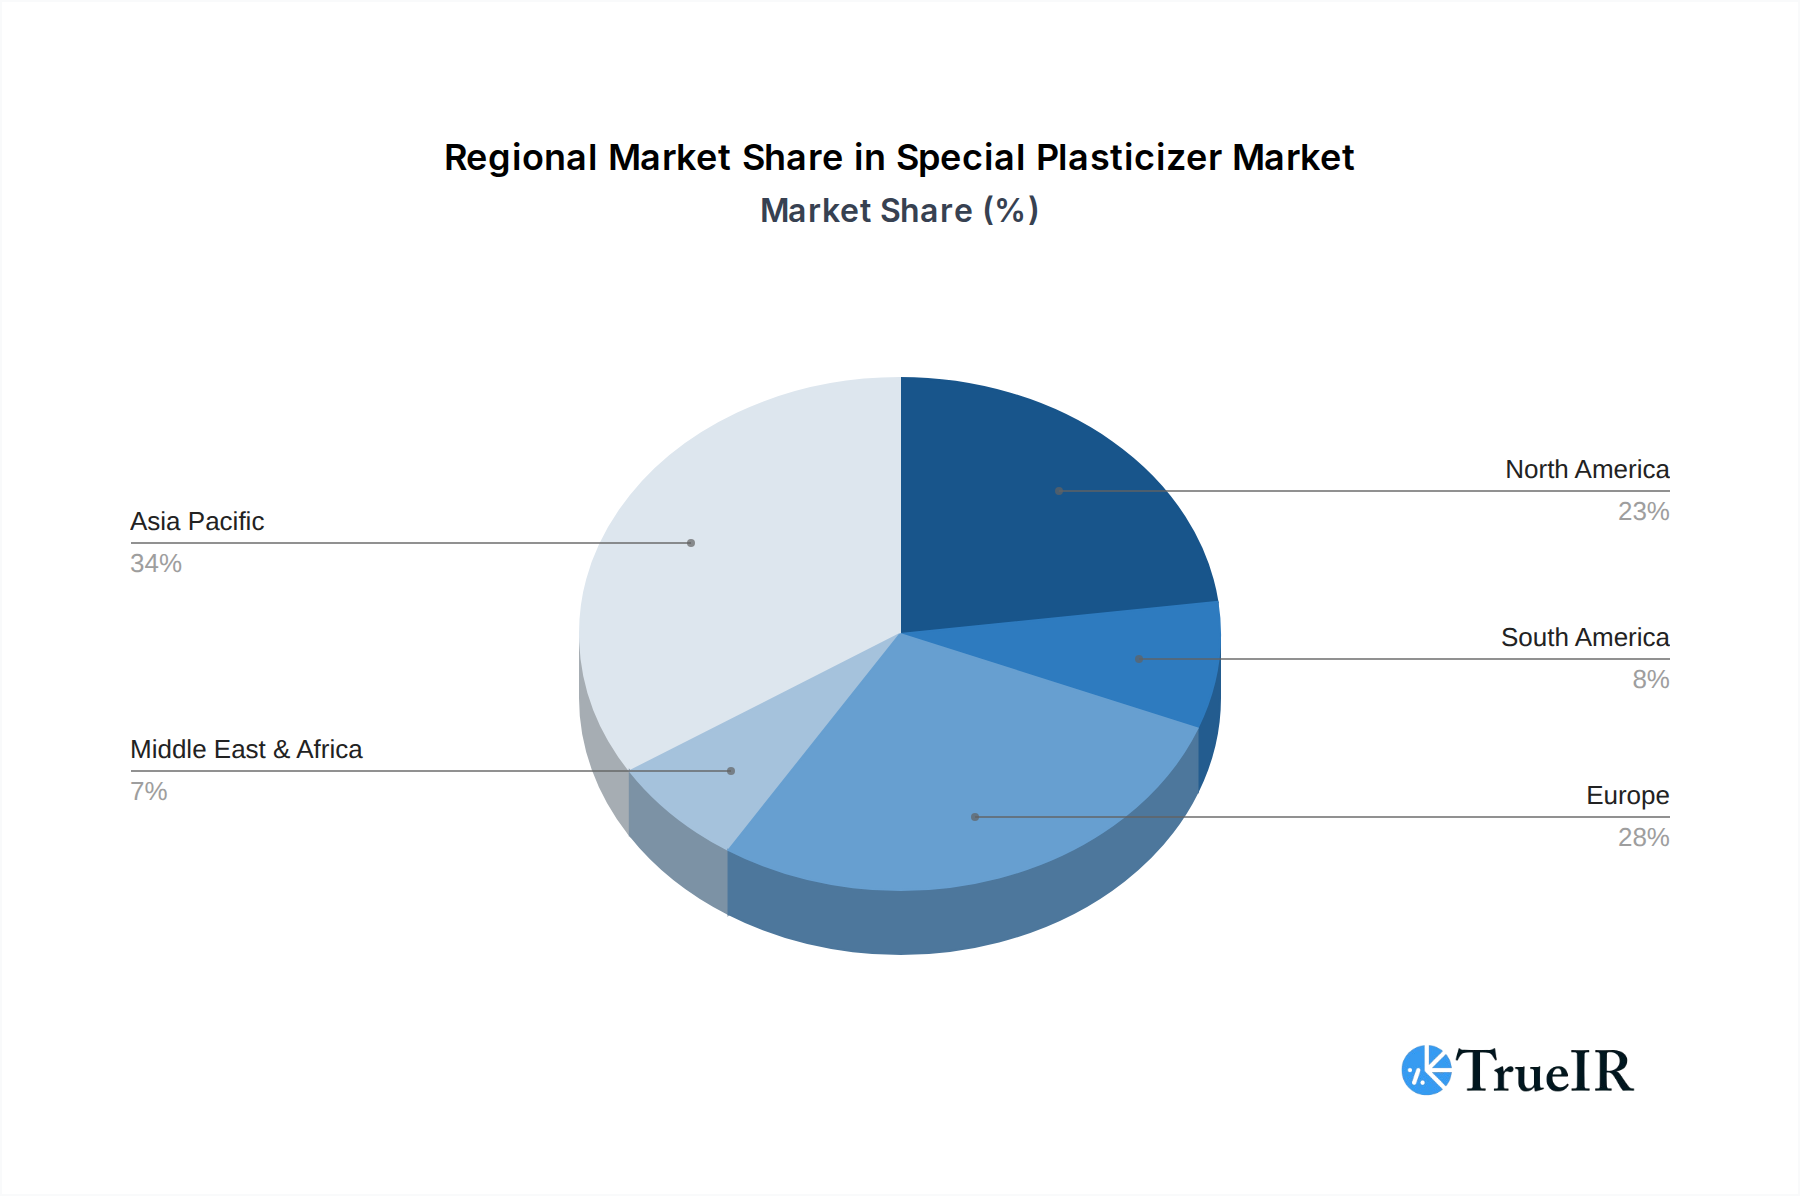
Special Plasticizer Regional Market Share
Geographic Coverage of Special Plasticizer
Special Plasticizer REPORT HIGHLIGHTS
| Aspects | Details |
|---|---|
| Study Period | 2020-2034 |
| Base Year | 2025 |
| Estimated Year | 2026 |
| Forecast Period | 2026-2034 |
| Historical Period | 2020-2025 |
| Growth Rate | CAGR of 6.2% from 2020-2034 |
| Segmentation |
|
Table of Contents
- 1. Introduction
- 1.1. Research Scope
- 1.2. Market Segmentation
- 1.3. Research Methodology
- 1.4. Definitions and Assumptions
- 2. Executive Summary
- 2.1. Introduction
- 3. Market Dynamics
- 3.1. Introduction
- 3.2. Market Drivers
- 3.3. Market Restrains
- 3.4. Market Trends
- 4. Market Factor Analysis
- 4.1. Porters Five Forces
- 4.2. Supply/Value Chain
- 4.3. PESTEL analysis
- 4.4. Market Entropy
- 4.5. Patent/Trademark Analysis
- 5. Global Special Plasticizer Analysis, Insights and Forecast, 2020-2032
- 5.1. Market Analysis, Insights and Forecast - by Application
- 5.1.1. Architecture
- 5.1.2. Medical
- 5.1.3. Automobile
- 5.1.4. Food Packaging
- 5.1.5. Others
- 5.2. Market Analysis, Insights and Forecast - by Type
- 5.2.1. Polymeric Plasticizer
- 5.2.2. Monomeric Plasticizer
- 5.3. Market Analysis, Insights and Forecast - by Region
- 5.3.1. North America
- 5.3.2. South America
- 5.3.3. Europe
- 5.3.4. Middle East & Africa
- 5.3.5. Asia Pacific
- 5.1. Market Analysis, Insights and Forecast - by Application
- 6. North America Special Plasticizer Analysis, Insights and Forecast, 2020-2032
- 6.1. Market Analysis, Insights and Forecast - by Application
- 6.1.1. Architecture
- 6.1.2. Medical
- 6.1.3. Automobile
- 6.1.4. Food Packaging
- 6.1.5. Others
- 6.2. Market Analysis, Insights and Forecast - by Type
- 6.2.1. Polymeric Plasticizer
- 6.2.2. Monomeric Plasticizer
- 6.1. Market Analysis, Insights and Forecast - by Application
- 7. South America Special Plasticizer Analysis, Insights and Forecast, 2020-2032
- 7.1. Market Analysis, Insights and Forecast - by Application
- 7.1.1. Architecture
- 7.1.2. Medical
- 7.1.3. Automobile
- 7.1.4. Food Packaging
- 7.1.5. Others
- 7.2. Market Analysis, Insights and Forecast - by Type
- 7.2.1. Polymeric Plasticizer
- 7.2.2. Monomeric Plasticizer
- 7.1. Market Analysis, Insights and Forecast - by Application
- 8. Europe Special Plasticizer Analysis, Insights and Forecast, 2020-2032
- 8.1. Market Analysis, Insights and Forecast - by Application
- 8.1.1. Architecture
- 8.1.2. Medical
- 8.1.3. Automobile
- 8.1.4. Food Packaging
- 8.1.5. Others
- 8.2. Market Analysis, Insights and Forecast - by Type
- 8.2.1. Polymeric Plasticizer
- 8.2.2. Monomeric Plasticizer
- 8.1. Market Analysis, Insights and Forecast - by Application
- 9. Middle East & Africa Special Plasticizer Analysis, Insights and Forecast, 2020-2032
- 9.1. Market Analysis, Insights and Forecast - by Application
- 9.1.1. Architecture
- 9.1.2. Medical
- 9.1.3. Automobile
- 9.1.4. Food Packaging
- 9.1.5. Others
- 9.2. Market Analysis, Insights and Forecast - by Type
- 9.2.1. Polymeric Plasticizer
- 9.2.2. Monomeric Plasticizer
- 9.1. Market Analysis, Insights and Forecast - by Application
- 10. Asia Pacific Special Plasticizer Analysis, Insights and Forecast, 2020-2032
- 10.1. Market Analysis, Insights and Forecast - by Application
- 10.1.1. Architecture
- 10.1.2. Medical
- 10.1.3. Automobile
- 10.1.4. Food Packaging
- 10.1.5. Others
- 10.2. Market Analysis, Insights and Forecast - by Type
- 10.2.1. Polymeric Plasticizer
- 10.2.2. Monomeric Plasticizer
- 10.1. Market Analysis, Insights and Forecast - by Application
- 11. Competitive Analysis
- 11.1. Global Market Share Analysis 2025
- 11.2. Company Profiles
- 11.2.1 Emery Oleochemicals
- 11.2.1.1. Overview
- 11.2.1.2. Products
- 11.2.1.3. SWOT Analysis
- 11.2.1.4. Recent Developments
- 11.2.1.5. Financials (Based on Availability)
- 11.2.2 Condensia
- 11.2.2.1. Overview
- 11.2.2.2. Products
- 11.2.2.3. SWOT Analysis
- 11.2.2.4. Recent Developments
- 11.2.2.5. Financials (Based on Availability)
- 11.2.3 Polynt
- 11.2.3.1. Overview
- 11.2.3.2. Products
- 11.2.3.3. SWOT Analysis
- 11.2.3.4. Recent Developments
- 11.2.3.5. Financials (Based on Availability)
- 11.2.4 BASF
- 11.2.4.1. Overview
- 11.2.4.2. Products
- 11.2.4.3. SWOT Analysis
- 11.2.4.4. Recent Developments
- 11.2.4.5. Financials (Based on Availability)
- 11.2.5 Adeka
- 11.2.5.1. Overview
- 11.2.5.2. Products
- 11.2.5.3. SWOT Analysis
- 11.2.5.4. Recent Developments
- 11.2.5.5. Financials (Based on Availability)
- 11.2.6 Arkema
- 11.2.6.1. Overview
- 11.2.6.2. Products
- 11.2.6.3. SWOT Analysis
- 11.2.6.4. Recent Developments
- 11.2.6.5. Financials (Based on Availability)
- 11.2.7 Hallstar
- 11.2.7.1. Overview
- 11.2.7.2. Products
- 11.2.7.3. SWOT Analysis
- 11.2.7.4. Recent Developments
- 11.2.7.5. Financials (Based on Availability)
- 11.2.8 ExxonMobil Chemical
- 11.2.8.1. Overview
- 11.2.8.2. Products
- 11.2.8.3. SWOT Analysis
- 11.2.8.4. Recent Developments
- 11.2.8.5. Financials (Based on Availability)
- 11.2.9 KLJ Group
- 11.2.9.1. Overview
- 11.2.9.2. Products
- 11.2.9.3. SWOT Analysis
- 11.2.9.4. Recent Developments
- 11.2.9.5. Financials (Based on Availability)
- 11.2.10 DIC
- 11.2.10.1. Overview
- 11.2.10.2. Products
- 11.2.10.3. SWOT Analysis
- 11.2.10.4. Recent Developments
- 11.2.10.5. Financials (Based on Availability)
- 11.2.11 Mitsubishi Chemical
- 11.2.11.1. Overview
- 11.2.11.2. Products
- 11.2.11.3. SWOT Analysis
- 11.2.11.4. Recent Developments
- 11.2.11.5. Financials (Based on Availability)
- 11.2.12 Eastman
- 11.2.12.1. Overview
- 11.2.12.2. Products
- 11.2.12.3. SWOT Analysis
- 11.2.12.4. Recent Developments
- 11.2.12.5. Financials (Based on Availability)
- 11.2.13 Lanxess
- 11.2.13.1. Overview
- 11.2.13.2. Products
- 11.2.13.3. SWOT Analysis
- 11.2.13.4. Recent Developments
- 11.2.13.5. Financials (Based on Availability)
- 11.2.14 Nayakem Organics
- 11.2.14.1. Overview
- 11.2.14.2. Products
- 11.2.14.3. SWOT Analysis
- 11.2.14.4. Recent Developments
- 11.2.14.5. Financials (Based on Availability)
- 11.2.15 DOW
- 11.2.15.1. Overview
- 11.2.15.2. Products
- 11.2.15.3. SWOT Analysis
- 11.2.15.4. Recent Developments
- 11.2.15.5. Financials (Based on Availability)
- 11.2.16 Cargil
- 11.2.16.1. Overview
- 11.2.16.2. Products
- 11.2.16.3. SWOT Analysis
- 11.2.16.4. Recent Developments
- 11.2.16.5. Financials (Based on Availability)
- 11.2.17 Zhejiang Jiaao Environmental Protection Department
- 11.2.17.1. Overview
- 11.2.17.2. Products
- 11.2.17.3. SWOT Analysis
- 11.2.17.4. Recent Developments
- 11.2.17.5. Financials (Based on Availability)
- 11.2.18 UPC Technology
- 11.2.18.1. Overview
- 11.2.18.2. Products
- 11.2.18.3. SWOT Analysis
- 11.2.18.4. Recent Developments
- 11.2.18.5. Financials (Based on Availability)
- 11.2.19 Yuanli Chem
- 11.2.19.1. Overview
- 11.2.19.2. Products
- 11.2.19.3. SWOT Analysis
- 11.2.19.4. Recent Developments
- 11.2.19.5. Financials (Based on Availability)
- 11.2.1 Emery Oleochemicals
List of Figures
- Figure 1: Global Special Plasticizer Revenue Breakdown (million, %) by Region 2025 & 2033
- Figure 2: Global Special Plasticizer Volume Breakdown (K, %) by Region 2025 & 2033
- Figure 3: North America Special Plasticizer Revenue (million), by Application 2025 & 2033
- Figure 4: North America Special Plasticizer Volume (K), by Application 2025 & 2033
- Figure 5: North America Special Plasticizer Revenue Share (%), by Application 2025 & 2033
- Figure 6: North America Special Plasticizer Volume Share (%), by Application 2025 & 2033
- Figure 7: North America Special Plasticizer Revenue (million), by Type 2025 & 2033
- Figure 8: North America Special Plasticizer Volume (K), by Type 2025 & 2033
- Figure 9: North America Special Plasticizer Revenue Share (%), by Type 2025 & 2033
- Figure 10: North America Special Plasticizer Volume Share (%), by Type 2025 & 2033
- Figure 11: North America Special Plasticizer Revenue (million), by Country 2025 & 2033
- Figure 12: North America Special Plasticizer Volume (K), by Country 2025 & 2033
- Figure 13: North America Special Plasticizer Revenue Share (%), by Country 2025 & 2033
- Figure 14: North America Special Plasticizer Volume Share (%), by Country 2025 & 2033
- Figure 15: South America Special Plasticizer Revenue (million), by Application 2025 & 2033
- Figure 16: South America Special Plasticizer Volume (K), by Application 2025 & 2033
- Figure 17: South America Special Plasticizer Revenue Share (%), by Application 2025 & 2033
- Figure 18: South America Special Plasticizer Volume Share (%), by Application 2025 & 2033
- Figure 19: South America Special Plasticizer Revenue (million), by Type 2025 & 2033
- Figure 20: South America Special Plasticizer Volume (K), by Type 2025 & 2033
- Figure 21: South America Special Plasticizer Revenue Share (%), by Type 2025 & 2033
- Figure 22: South America Special Plasticizer Volume Share (%), by Type 2025 & 2033
- Figure 23: South America Special Plasticizer Revenue (million), by Country 2025 & 2033
- Figure 24: South America Special Plasticizer Volume (K), by Country 2025 & 2033
- Figure 25: South America Special Plasticizer Revenue Share (%), by Country 2025 & 2033
- Figure 26: South America Special Plasticizer Volume Share (%), by Country 2025 & 2033
- Figure 27: Europe Special Plasticizer Revenue (million), by Application 2025 & 2033
- Figure 28: Europe Special Plasticizer Volume (K), by Application 2025 & 2033
- Figure 29: Europe Special Plasticizer Revenue Share (%), by Application 2025 & 2033
- Figure 30: Europe Special Plasticizer Volume Share (%), by Application 2025 & 2033
- Figure 31: Europe Special Plasticizer Revenue (million), by Type 2025 & 2033
- Figure 32: Europe Special Plasticizer Volume (K), by Type 2025 & 2033
- Figure 33: Europe Special Plasticizer Revenue Share (%), by Type 2025 & 2033
- Figure 34: Europe Special Plasticizer Volume Share (%), by Type 2025 & 2033
- Figure 35: Europe Special Plasticizer Revenue (million), by Country 2025 & 2033
- Figure 36: Europe Special Plasticizer Volume (K), by Country 2025 & 2033
- Figure 37: Europe Special Plasticizer Revenue Share (%), by Country 2025 & 2033
- Figure 38: Europe Special Plasticizer Volume Share (%), by Country 2025 & 2033
- Figure 39: Middle East & Africa Special Plasticizer Revenue (million), by Application 2025 & 2033
- Figure 40: Middle East & Africa Special Plasticizer Volume (K), by Application 2025 & 2033
- Figure 41: Middle East & Africa Special Plasticizer Revenue Share (%), by Application 2025 & 2033
- Figure 42: Middle East & Africa Special Plasticizer Volume Share (%), by Application 2025 & 2033
- Figure 43: Middle East & Africa Special Plasticizer Revenue (million), by Type 2025 & 2033
- Figure 44: Middle East & Africa Special Plasticizer Volume (K), by Type 2025 & 2033
- Figure 45: Middle East & Africa Special Plasticizer Revenue Share (%), by Type 2025 & 2033
- Figure 46: Middle East & Africa Special Plasticizer Volume Share (%), by Type 2025 & 2033
- Figure 47: Middle East & Africa Special Plasticizer Revenue (million), by Country 2025 & 2033
- Figure 48: Middle East & Africa Special Plasticizer Volume (K), by Country 2025 & 2033
- Figure 49: Middle East & Africa Special Plasticizer Revenue Share (%), by Country 2025 & 2033
- Figure 50: Middle East & Africa Special Plasticizer Volume Share (%), by Country 2025 & 2033
- Figure 51: Asia Pacific Special Plasticizer Revenue (million), by Application 2025 & 2033
- Figure 52: Asia Pacific Special Plasticizer Volume (K), by Application 2025 & 2033
- Figure 53: Asia Pacific Special Plasticizer Revenue Share (%), by Application 2025 & 2033
- Figure 54: Asia Pacific Special Plasticizer Volume Share (%), by Application 2025 & 2033
- Figure 55: Asia Pacific Special Plasticizer Revenue (million), by Type 2025 & 2033
- Figure 56: Asia Pacific Special Plasticizer Volume (K), by Type 2025 & 2033
- Figure 57: Asia Pacific Special Plasticizer Revenue Share (%), by Type 2025 & 2033
- Figure 58: Asia Pacific Special Plasticizer Volume Share (%), by Type 2025 & 2033
- Figure 59: Asia Pacific Special Plasticizer Revenue (million), by Country 2025 & 2033
- Figure 60: Asia Pacific Special Plasticizer Volume (K), by Country 2025 & 2033
- Figure 61: Asia Pacific Special Plasticizer Revenue Share (%), by Country 2025 & 2033
- Figure 62: Asia Pacific Special Plasticizer Volume Share (%), by Country 2025 & 2033
List of Tables
- Table 1: Global Special Plasticizer Revenue million Forecast, by Application 2020 & 2033
- Table 2: Global Special Plasticizer Volume K Forecast, by Application 2020 & 2033
- Table 3: Global Special Plasticizer Revenue million Forecast, by Type 2020 & 2033
- Table 4: Global Special Plasticizer Volume K Forecast, by Type 2020 & 2033
- Table 5: Global Special Plasticizer Revenue million Forecast, by Region 2020 & 2033
- Table 6: Global Special Plasticizer Volume K Forecast, by Region 2020 & 2033
- Table 7: Global Special Plasticizer Revenue million Forecast, by Application 2020 & 2033
- Table 8: Global Special Plasticizer Volume K Forecast, by Application 2020 & 2033
- Table 9: Global Special Plasticizer Revenue million Forecast, by Type 2020 & 2033
- Table 10: Global Special Plasticizer Volume K Forecast, by Type 2020 & 2033
- Table 11: Global Special Plasticizer Revenue million Forecast, by Country 2020 & 2033
- Table 12: Global Special Plasticizer Volume K Forecast, by Country 2020 & 2033
- Table 13: United States Special Plasticizer Revenue (million) Forecast, by Application 2020 & 2033
- Table 14: United States Special Plasticizer Volume (K) Forecast, by Application 2020 & 2033
- Table 15: Canada Special Plasticizer Revenue (million) Forecast, by Application 2020 & 2033
- Table 16: Canada Special Plasticizer Volume (K) Forecast, by Application 2020 & 2033
- Table 17: Mexico Special Plasticizer Revenue (million) Forecast, by Application 2020 & 2033
- Table 18: Mexico Special Plasticizer Volume (K) Forecast, by Application 2020 & 2033
- Table 19: Global Special Plasticizer Revenue million Forecast, by Application 2020 & 2033
- Table 20: Global Special Plasticizer Volume K Forecast, by Application 2020 & 2033
- Table 21: Global Special Plasticizer Revenue million Forecast, by Type 2020 & 2033
- Table 22: Global Special Plasticizer Volume K Forecast, by Type 2020 & 2033
- Table 23: Global Special Plasticizer Revenue million Forecast, by Country 2020 & 2033
- Table 24: Global Special Plasticizer Volume K Forecast, by Country 2020 & 2033
- Table 25: Brazil Special Plasticizer Revenue (million) Forecast, by Application 2020 & 2033
- Table 26: Brazil Special Plasticizer Volume (K) Forecast, by Application 2020 & 2033
- Table 27: Argentina Special Plasticizer Revenue (million) Forecast, by Application 2020 & 2033
- Table 28: Argentina Special Plasticizer Volume (K) Forecast, by Application 2020 & 2033
- Table 29: Rest of South America Special Plasticizer Revenue (million) Forecast, by Application 2020 & 2033
- Table 30: Rest of South America Special Plasticizer Volume (K) Forecast, by Application 2020 & 2033
- Table 31: Global Special Plasticizer Revenue million Forecast, by Application 2020 & 2033
- Table 32: Global Special Plasticizer Volume K Forecast, by Application 2020 & 2033
- Table 33: Global Special Plasticizer Revenue million Forecast, by Type 2020 & 2033
- Table 34: Global Special Plasticizer Volume K Forecast, by Type 2020 & 2033
- Table 35: Global Special Plasticizer Revenue million Forecast, by Country 2020 & 2033
- Table 36: Global Special Plasticizer Volume K Forecast, by Country 2020 & 2033
- Table 37: United Kingdom Special Plasticizer Revenue (million) Forecast, by Application 2020 & 2033
- Table 38: United Kingdom Special Plasticizer Volume (K) Forecast, by Application 2020 & 2033
- Table 39: Germany Special Plasticizer Revenue (million) Forecast, by Application 2020 & 2033
- Table 40: Germany Special Plasticizer Volume (K) Forecast, by Application 2020 & 2033
- Table 41: France Special Plasticizer Revenue (million) Forecast, by Application 2020 & 2033
- Table 42: France Special Plasticizer Volume (K) Forecast, by Application 2020 & 2033
- Table 43: Italy Special Plasticizer Revenue (million) Forecast, by Application 2020 & 2033
- Table 44: Italy Special Plasticizer Volume (K) Forecast, by Application 2020 & 2033
- Table 45: Spain Special Plasticizer Revenue (million) Forecast, by Application 2020 & 2033
- Table 46: Spain Special Plasticizer Volume (K) Forecast, by Application 2020 & 2033
- Table 47: Russia Special Plasticizer Revenue (million) Forecast, by Application 2020 & 2033
- Table 48: Russia Special Plasticizer Volume (K) Forecast, by Application 2020 & 2033
- Table 49: Benelux Special Plasticizer Revenue (million) Forecast, by Application 2020 & 2033
- Table 50: Benelux Special Plasticizer Volume (K) Forecast, by Application 2020 & 2033
- Table 51: Nordics Special Plasticizer Revenue (million) Forecast, by Application 2020 & 2033
- Table 52: Nordics Special Plasticizer Volume (K) Forecast, by Application 2020 & 2033
- Table 53: Rest of Europe Special Plasticizer Revenue (million) Forecast, by Application 2020 & 2033
- Table 54: Rest of Europe Special Plasticizer Volume (K) Forecast, by Application 2020 & 2033
- Table 55: Global Special Plasticizer Revenue million Forecast, by Application 2020 & 2033
- Table 56: Global Special Plasticizer Volume K Forecast, by Application 2020 & 2033
- Table 57: Global Special Plasticizer Revenue million Forecast, by Type 2020 & 2033
- Table 58: Global Special Plasticizer Volume K Forecast, by Type 2020 & 2033
- Table 59: Global Special Plasticizer Revenue million Forecast, by Country 2020 & 2033
- Table 60: Global Special Plasticizer Volume K Forecast, by Country 2020 & 2033
- Table 61: Turkey Special Plasticizer Revenue (million) Forecast, by Application 2020 & 2033
- Table 62: Turkey Special Plasticizer Volume (K) Forecast, by Application 2020 & 2033
- Table 63: Israel Special Plasticizer Revenue (million) Forecast, by Application 2020 & 2033
- Table 64: Israel Special Plasticizer Volume (K) Forecast, by Application 2020 & 2033
- Table 65: GCC Special Plasticizer Revenue (million) Forecast, by Application 2020 & 2033
- Table 66: GCC Special Plasticizer Volume (K) Forecast, by Application 2020 & 2033
- Table 67: North Africa Special Plasticizer Revenue (million) Forecast, by Application 2020 & 2033
- Table 68: North Africa Special Plasticizer Volume (K) Forecast, by Application 2020 & 2033
- Table 69: South Africa Special Plasticizer Revenue (million) Forecast, by Application 2020 & 2033
- Table 70: South Africa Special Plasticizer Volume (K) Forecast, by Application 2020 & 2033
- Table 71: Rest of Middle East & Africa Special Plasticizer Revenue (million) Forecast, by Application 2020 & 2033
- Table 72: Rest of Middle East & Africa Special Plasticizer Volume (K) Forecast, by Application 2020 & 2033
- Table 73: Global Special Plasticizer Revenue million Forecast, by Application 2020 & 2033
- Table 74: Global Special Plasticizer Volume K Forecast, by Application 2020 & 2033
- Table 75: Global Special Plasticizer Revenue million Forecast, by Type 2020 & 2033
- Table 76: Global Special Plasticizer Volume K Forecast, by Type 2020 & 2033
- Table 77: Global Special Plasticizer Revenue million Forecast, by Country 2020 & 2033
- Table 78: Global Special Plasticizer Volume K Forecast, by Country 2020 & 2033
- Table 79: China Special Plasticizer Revenue (million) Forecast, by Application 2020 & 2033
- Table 80: China Special Plasticizer Volume (K) Forecast, by Application 2020 & 2033
- Table 81: India Special Plasticizer Revenue (million) Forecast, by Application 2020 & 2033
- Table 82: India Special Plasticizer Volume (K) Forecast, by Application 2020 & 2033
- Table 83: Japan Special Plasticizer Revenue (million) Forecast, by Application 2020 & 2033
- Table 84: Japan Special Plasticizer Volume (K) Forecast, by Application 2020 & 2033
- Table 85: South Korea Special Plasticizer Revenue (million) Forecast, by Application 2020 & 2033
- Table 86: South Korea Special Plasticizer Volume (K) Forecast, by Application 2020 & 2033
- Table 87: ASEAN Special Plasticizer Revenue (million) Forecast, by Application 2020 & 2033
- Table 88: ASEAN Special Plasticizer Volume (K) Forecast, by Application 2020 & 2033
- Table 89: Oceania Special Plasticizer Revenue (million) Forecast, by Application 2020 & 2033
- Table 90: Oceania Special Plasticizer Volume (K) Forecast, by Application 2020 & 2033
- Table 91: Rest of Asia Pacific Special Plasticizer Revenue (million) Forecast, by Application 2020 & 2033
- Table 92: Rest of Asia Pacific Special Plasticizer Volume (K) Forecast, by Application 2020 & 2033
Frequently Asked Questions
1. What is the projected Compound Annual Growth Rate (CAGR) of the Special Plasticizer?
The projected CAGR is approximately 6.2%.
2. Which companies are prominent players in the Special Plasticizer?
Key companies in the market include Emery Oleochemicals, Condensia, Polynt, BASF, Adeka, Arkema, Hallstar, ExxonMobil Chemical, KLJ Group, DIC, Mitsubishi Chemical, Eastman, Lanxess, Nayakem Organics, DOW, Cargil, Zhejiang Jiaao Environmental Protection Department, UPC Technology, Yuanli Chem.
3. What are the main segments of the Special Plasticizer?
The market segments include Application, Type.
4. Can you provide details about the market size?
The market size is estimated to be USD 8199 million as of 2022.
5. What are some drivers contributing to market growth?
N/A
6. What are the notable trends driving market growth?
N/A
7. Are there any restraints impacting market growth?
N/A
8. Can you provide examples of recent developments in the market?
N/A
9. What pricing options are available for accessing the report?
Pricing options include single-user, multi-user, and enterprise licenses priced at USD 3950.00, USD 5925.00, and USD 7900.00 respectively.
10. Is the market size provided in terms of value or volume?
The market size is provided in terms of value, measured in million and volume, measured in K.
11. Are there any specific market keywords associated with the report?
Yes, the market keyword associated with the report is "Special Plasticizer," which aids in identifying and referencing the specific market segment covered.
12. How do I determine which pricing option suits my needs best?
The pricing options vary based on user requirements and access needs. Individual users may opt for single-user licenses, while businesses requiring broader access may choose multi-user or enterprise licenses for cost-effective access to the report.
13. Are there any additional resources or data provided in the Special Plasticizer report?
While the report offers comprehensive insights, it's advisable to review the specific contents or supplementary materials provided to ascertain if additional resources or data are available.
14. How can I stay updated on further developments or reports in the Special Plasticizer?
To stay informed about further developments, trends, and reports in the Special Plasticizer, consider subscribing to industry newsletters, following relevant companies and organizations, or regularly checking reputable industry news sources and publications.
Methodology
Step 1 - Identification of Relevant Samples Size from Population Database


Step 2 - Approaches for Defining Global Market Size (Value, Volume* & Price*)

Note*: In applicable scenarios
Step 3 - Data Sources
Primary Research
- Web Analytics
- Survey Reports
- Research Institute
- Latest Research Reports
- Opinion Leaders
Secondary Research
- Annual Reports
- White Paper
- Latest Press Release
- Industry Association
- Paid Database
- Investor Presentations

Step 4 - Data Triangulation
Involves using different sources of information in order to increase the validity of a study
These sources are likely to be stakeholders in a program - participants, other researchers, program staff, other community members, and so on.
Then we put all data in single framework & apply various statistical tools to find out the dynamic on the market.
During the analysis stage, feedback from the stakeholder groups would be compared to determine areas of agreement as well as areas of divergence