

Key Insights
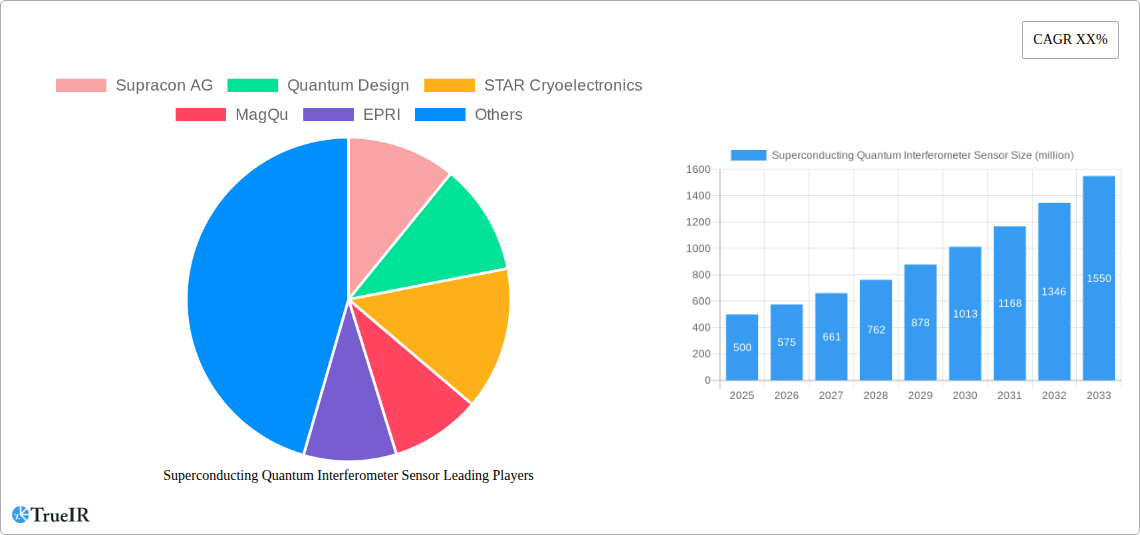
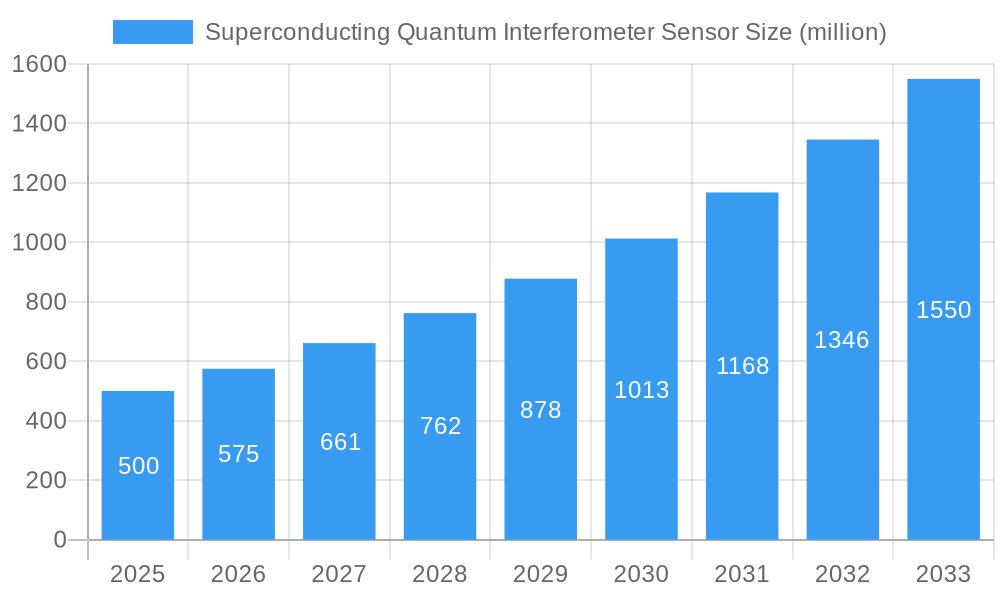
The Superconducting Quantum Interference Device (SQUID) sensor market is poised for substantial expansion, fueled by escalating demand across critical sectors. With a projected market size of 819.2 million by the base year of 2025, and an estimated Compound Annual Growth Rate (CAGR) of 15.6%, this market signifies a significant opportunity. Key growth drivers include the imperative for ultra-sensitive magnetic field detection in medical imaging applications such as magnetoencephalography (MEG), breakthroughs in materials science enhancing SQUID performance, and the burgeoning integration of SQUID technology into quantum computing and nanotechnology research and development. Emerging trends indicate a strong push towards miniaturization, enabling more portable and cost-effective SQUID sensors, alongside increased integration into sophisticated sensing systems.
Superconducting Quantum Interferometer Sensor Market Size (In Million)
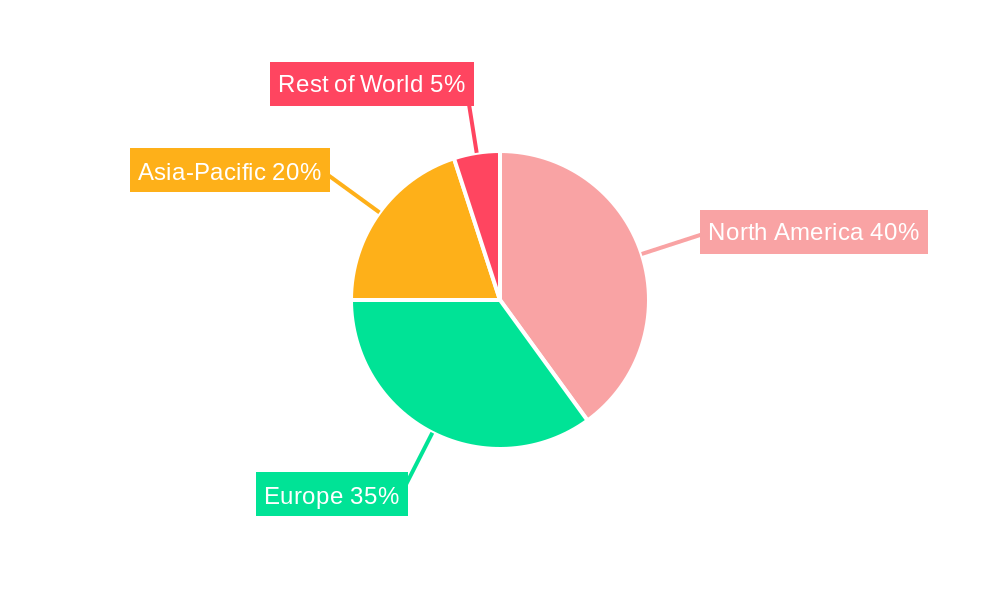
Market segmentation is anticipated to be diverse, with the healthcare sector, driven by advancements in MEG and other diagnostic imaging, alongside scientific research (material characterization, quantum physics), emerging as primary contributors. Potential growth areas also include industrial process monitoring and environmental sensing. Leading innovators such as Supracon AG, Quantum Design, and STAR Cryoelectronics are at the forefront of SQUID sensor technology development. Geographically, North America and Europe are expected to maintain dominant positions, supported by robust R&D investment and established market infrastructure. The Asia-Pacific region is projected to experience considerable growth, driven by increasing technological investments and the expanding demand from emerging economies. The forecast period of 2025-2033 presents a compelling landscape for market advancement as technological innovations address existing limitations and promote widespread adoption across a multitude of industries.
Superconducting Quantum Interferometer Sensor Company Market Share
Superconducting Quantum Interferometer Sensor Market Report: 2019-2033
This comprehensive report provides a detailed analysis of the global Superconducting Quantum Interferometer Sensor (SQUID) market, offering invaluable insights for stakeholders across the industry. With a study period spanning 2019-2033, a base year of 2025, and a forecast period of 2025-2033, this report leverages extensive market research to provide a robust understanding of current market dynamics and future growth projections. The market is valued at $XX million in 2025 and is projected to reach $XX million by 2033, exhibiting a CAGR of XX%.
Superconducting Quantum Interferometer Sensor Market Structure & Competitive Landscape
The global SQUID sensor market exhibits a moderately concentrated structure, with several key players holding significant market share. The Herfindahl-Hirschman Index (HHI) is estimated at XX in 2025, indicating a moderately consolidated market. However, the entry of new players and technological innovations are fostering increased competition.
Key Market Dynamics:
- Innovation Drivers: Advancements in materials science, cryogenic cooling technologies, and fabrication techniques are driving product improvements, miniaturization, and enhanced performance.
- Regulatory Impacts: Government regulations concerning environmental compliance and safety standards influence manufacturing processes and market access.
- Product Substitutes: Alternative technologies, such as atomic force microscopy and other sensitive measurement devices, present some level of competition, although SQUIDs maintain a significant advantage in specific applications.
- End-User Segmentation: Key end-user segments include medical imaging, scientific research, geophysical exploration, and defense & aerospace.
- M&A Trends: The past five years have witnessed XX major mergers and acquisitions (M&A) transactions in the SQUID market, primarily driven by strategic expansions and technology acquisitions. The total value of these transactions is estimated at $XX million.
The market is influenced by several factors, including the increasing demand for high-precision measurements across various sectors, the ongoing technological development of more sensitive and robust SQUID sensors, and the increasing investments in research and development by both private and public organizations. However, the high cost of SQUID sensors, the complexities associated with their operation and maintenance, and the availability of alternative technologies pose challenges to market growth.
Superconducting Quantum Interferometer Sensor Market Trends & Opportunities
The global SQUID sensor market is experiencing robust growth, driven by a multitude of factors. The market size is projected to experience significant expansion, with a projected value of $XX million in 2025 and an anticipated $XX million by 2033. This growth is fueled by technological advancements, increasing demand across diverse applications, and favorable government policies supporting the development and deployment of advanced sensor technologies.
The market is witnessing a rapid increase in the adoption of SQUID sensors across various sectors due to their superior sensitivity and precision compared to traditional measurement techniques. Several key trends are shaping the market landscape. The rising demand for highly sensitive magnetic field detection technologies in medical diagnostics and biomagnetic research, the increasing adoption of SQUID sensors in geophysical exploration for mineral and hydrocarbon discoveries, and the development of miniaturized and cost-effective SQUID sensors are all major factors contributing to growth.
The market is anticipated to exhibit a Compound Annual Growth Rate (CAGR) of XX% during the forecast period (2025-2033). Market penetration rates vary significantly across different regions and applications, with the highest penetration observed in sectors such as medical imaging and scientific research.
Dominant Markets & Segments in Superconducting Quantum Interferometer Sensor
The North American region currently holds the largest market share for SQUID sensors, driven by substantial investments in research and development, a strong presence of key players, and a high demand from various sectors. However, the Asia-Pacific region is expected to witness the fastest growth rate during the forecast period.
Key Growth Drivers:
- Robust R&D Investments: Significant funding for scientific research, especially in medical and materials science, is driving adoption.
- Technological Advancements: Continuous innovation in SQUID technology leads to enhanced performance and cost reduction.
- Favorable Government Policies: Government initiatives and funding programs supporting advanced sensor technology adoption are boosting market growth.
- Strong Presence of Key Players: The concentration of major SQUID sensor manufacturers in this region further enhances market growth.
Regional Dominance Analysis: The dominance of North America stems from factors such as established infrastructure, a well-developed healthcare industry, and substantial research funding. However, rapid economic growth and increasing demand in countries like China and Japan are expected to drive significant growth in the Asia-Pacific region.
Superconducting Quantum Interferometer Sensor Product Analysis
Recent product innovations focus on enhancing SQUID sensitivity, miniaturization, and cost-effectiveness. These advancements include the development of high-temperature superconducting SQUIDs, integrated SQUID systems, and improved fabrication processes that reduce manufacturing costs. These technological leaps allow for a wider range of applications, particularly in portable and in-situ measurement devices. SQUIDs offer unparalleled precision in magnetic field detection, outperforming traditional sensors, thus securing a leading position in numerous sectors.
Key Drivers, Barriers & Challenges in Superconducting Quantum Interferometer Sensor
Key Drivers:
The SQUID sensor market is propelled by the increasing demand for highly sensitive and precise measurement systems across numerous fields, including medical imaging, geophysical exploration, and scientific research. Technological advancements, particularly in high-temperature superconductors and miniaturization techniques, have substantially expanded the applications and accessibility of SQUID sensors. Governmental funding initiatives supporting research and development are further fueling market growth.
Challenges and Restraints:
Significant challenges include the high cost of SQUID sensors, the complexity of their operation and maintenance, and the need for cryogenic cooling systems. Competition from alternative measurement technologies and potential supply chain disruptions related to specialized materials can also impact market growth. Regulatory hurdles and environmental concerns surrounding the use of cryogenic coolants also pose considerable challenges. It's estimated that these factors collectively impede market growth by approximately XX% annually.
Growth Drivers in the Superconducting Quantum Interferometer Sensor Market
The increasing demand for high-precision measurements in diverse sectors such as healthcare, environmental monitoring, and scientific research is driving the growth of the SQUID sensor market. Technological advancements leading to improved sensitivity, miniaturization, and cost-effectiveness are enhancing market appeal. Government funding and initiatives that promote the development and adoption of advanced sensor technologies also significantly contribute to market growth.
Challenges Impacting Superconducting Quantum Interferometer Sensor Growth
High manufacturing costs and the need for sophisticated cryogenic cooling systems remain significant barriers to wider SQUID sensor adoption. Competition from alternative technologies, as well as potential disruptions in the supply chains for specialized materials, pose challenges to market growth. Furthermore, stringent regulations and environmental concerns associated with cryogenic coolants add complexity to the market landscape.
Key Players Shaping the Superconducting Quantum Interferometer Sensor Market
- Supracon AG
- Quantum Design
- STAR Cryoelectronics
- MagQu
- EPRI
- Intel
- Elliot Scientific
- TDK
Significant Superconducting Quantum Interferometer Sensor Industry Milestones
- 2020: Quantum Design released a new generation of SQUID-based magnetometers with improved sensitivity.
- 2021: Supracon AG announced a partnership with a major medical imaging company to integrate SQUIDs into advanced MRI systems.
- 2022: Several research teams reported breakthroughs in high-temperature superconductor SQUID technology, potentially lowering operational costs.
- 2023: MagQu secured significant funding to accelerate the development and commercialization of miniaturized SQUID sensors for portable applications.
- 2024: EPRI released a report highlighting the application of SQUIDs in advanced grid monitoring and renewable energy integration.
Future Outlook for Superconducting Quantum Interferometer Sensor Market
The future outlook for the SQUID sensor market remains positive, driven by ongoing technological advancements, expanding applications across various sectors, and growing government support. The development of high-temperature superconductors, improved fabrication techniques, and miniaturization efforts are expected to significantly reduce costs and enhance market penetration. Strategic partnerships and collaborations among key players will further fuel innovation and market growth. The market holds tremendous potential, particularly in sectors such as healthcare, environmental monitoring, and scientific research.
Superconducting Quantum Interferometer Sensor Segmentation
-
1. Application
- 1.1. Digital Product
- 1.2. Precision Instrument
- 1.3. Others
-
2. Types
- 2.1. Low Temperature Superconductivity
- 2.2. High Temperature Superconductivity
Superconducting Quantum Interferometer Sensor Segmentation By Geography
-
1. North America
- 1.1. United States
- 1.2. Canada
- 1.3. Mexico
-
2. South America
- 2.1. Brazil
- 2.2. Argentina
- 2.3. Rest of South America
-
3. Europe
- 3.1. United Kingdom
- 3.2. Germany
- 3.3. France
- 3.4. Italy
- 3.5. Spain
- 3.6. Russia
- 3.7. Benelux
- 3.8. Nordics
- 3.9. Rest of Europe
-
4. Middle East & Africa
- 4.1. Turkey
- 4.2. Israel
- 4.3. GCC
- 4.4. North Africa
- 4.5. South Africa
- 4.6. Rest of Middle East & Africa
-
5. Asia Pacific
- 5.1. China
- 5.2. India
- 5.3. Japan
- 5.4. South Korea
- 5.5. ASEAN
- 5.6. Oceania
- 5.7. Rest of Asia Pacific
Superconducting Quantum Interferometer Sensor Regional Market Share
Geographic Coverage of Superconducting Quantum Interferometer Sensor
Superconducting Quantum Interferometer Sensor REPORT HIGHLIGHTS
| Aspects | Details |
|---|---|
| Study Period | 2020-2034 |
| Base Year | 2025 |
| Estimated Year | 2026 |
| Forecast Period | 2026-2034 |
| Historical Period | 2020-2025 |
| Growth Rate | CAGR of 15.6% from 2020-2034 |
| Segmentation |
|
Table of Contents
- 1. Introduction
- 1.1. Research Scope
- 1.2. Market Segmentation
- 1.3. Research Objective
- 1.4. Definitions and Assumptions
- 2. Executive Summary
- 2.1. Market Snapshot
- 3. Market Dynamics
- 3.1. Market Drivers
- 3.2. Market Restrains
- 3.3. Market Trends
- 3.4. Market Opportunities
- 4. Market Factor Analysis
- 4.1. Porters Five Forces
- 4.1.1. Bargaining Power of Suppliers
- 4.1.2. Bargaining Power of Buyers
- 4.1.3. Threat of New Entrants
- 4.1.4. Threat of Substitutes
- 4.1.5. Competitive Rivalry
- 4.2. PESTEL analysis
- 4.3. BCG Analysis
- 4.3.1. Stars (High Growth, High Market Share)
- 4.3.2. Cash Cows (Low Growth, High Market Share)
- 4.3.3. Question Mark (High Growth, Low Market Share)
- 4.3.4. Dogs (Low Growth, Low Market Share)
- 4.4. Ansoff Matrix Analysis
- 4.5. Supply Chain Analysis
- 4.6. Regulatory Landscape
- 4.7. Current Market Potential and Opportunity Assessment (TAM–SAM–SOM Framework)
- 4.8. TIR Analyst Note
- 4.1. Porters Five Forces
- 5. Market Analysis, Insights and Forecast 2021-2033
- 5.1. Market Analysis, Insights and Forecast - by Application
- 5.1.1. Digital Product
- 5.1.2. Precision Instrument
- 5.1.3. Others
- 5.2. Market Analysis, Insights and Forecast - by Types
- 5.2.1. Low Temperature Superconductivity
- 5.2.2. High Temperature Superconductivity
- 5.3. Market Analysis, Insights and Forecast - by Region
- 5.3.1. North America
- 5.3.2. South America
- 5.3.3. Europe
- 5.3.4. Middle East & Africa
- 5.3.5. Asia Pacific
- 5.1. Market Analysis, Insights and Forecast - by Application
- 6. Global Superconducting Quantum Interferometer Sensor Analysis, Insights and Forecast, 2021-2033
- 6.1. Market Analysis, Insights and Forecast - by Application
- 6.1.1. Digital Product
- 6.1.2. Precision Instrument
- 6.1.3. Others
- 6.2. Market Analysis, Insights and Forecast - by Types
- 6.2.1. Low Temperature Superconductivity
- 6.2.2. High Temperature Superconductivity
- 6.1. Market Analysis, Insights and Forecast - by Application
- 7. North America Superconducting Quantum Interferometer Sensor Analysis, Insights and Forecast, 2020-2032
- 7.1. Market Analysis, Insights and Forecast - by Application
- 7.1.1. Digital Product
- 7.1.2. Precision Instrument
- 7.1.3. Others
- 7.2. Market Analysis, Insights and Forecast - by Types
- 7.2.1. Low Temperature Superconductivity
- 7.2.2. High Temperature Superconductivity
- 7.1. Market Analysis, Insights and Forecast - by Application
- 8. South America Superconducting Quantum Interferometer Sensor Analysis, Insights and Forecast, 2020-2032
- 8.1. Market Analysis, Insights and Forecast - by Application
- 8.1.1. Digital Product
- 8.1.2. Precision Instrument
- 8.1.3. Others
- 8.2. Market Analysis, Insights and Forecast - by Types
- 8.2.1. Low Temperature Superconductivity
- 8.2.2. High Temperature Superconductivity
- 8.1. Market Analysis, Insights and Forecast - by Application
- 9. Europe Superconducting Quantum Interferometer Sensor Analysis, Insights and Forecast, 2020-2032
- 9.1. Market Analysis, Insights and Forecast - by Application
- 9.1.1. Digital Product
- 9.1.2. Precision Instrument
- 9.1.3. Others
- 9.2. Market Analysis, Insights and Forecast - by Types
- 9.2.1. Low Temperature Superconductivity
- 9.2.2. High Temperature Superconductivity
- 9.1. Market Analysis, Insights and Forecast - by Application
- 10. Middle East & Africa Superconducting Quantum Interferometer Sensor Analysis, Insights and Forecast, 2020-2032
- 10.1. Market Analysis, Insights and Forecast - by Application
- 10.1.1. Digital Product
- 10.1.2. Precision Instrument
- 10.1.3. Others
- 10.2. Market Analysis, Insights and Forecast - by Types
- 10.2.1. Low Temperature Superconductivity
- 10.2.2. High Temperature Superconductivity
- 10.1. Market Analysis, Insights and Forecast - by Application
- 11. Asia Pacific Superconducting Quantum Interferometer Sensor Analysis, Insights and Forecast, 2020-2032
- 11.1. Market Analysis, Insights and Forecast - by Application
- 11.1.1. Digital Product
- 11.1.2. Precision Instrument
- 11.1.3. Others
- 11.2. Market Analysis, Insights and Forecast - by Types
- 11.2.1. Low Temperature Superconductivity
- 11.2.2. High Temperature Superconductivity
- 11.1. Market Analysis, Insights and Forecast - by Application
- 12. Competitive Analysis
- 12.1. Company Profiles
- 12.1.1 Supracon AG
- 12.1.1.1. Company Overview
- 12.1.1.2. Products
- 12.1.1.3. Company Financials
- 12.1.1.4. SWOT Analysis
- 12.1.2 Quantum Design
- 12.1.2.1. Company Overview
- 12.1.2.2. Products
- 12.1.2.3. Company Financials
- 12.1.2.4. SWOT Analysis
- 12.1.3 STAR Cryoelectronics
- 12.1.3.1. Company Overview
- 12.1.3.2. Products
- 12.1.3.3. Company Financials
- 12.1.3.4. SWOT Analysis
- 12.1.4 MagQu
- 12.1.4.1. Company Overview
- 12.1.4.2. Products
- 12.1.4.3. Company Financials
- 12.1.4.4. SWOT Analysis
- 12.1.5 EPRI
- 12.1.5.1. Company Overview
- 12.1.5.2. Products
- 12.1.5.3. Company Financials
- 12.1.5.4. SWOT Analysis
- 12.1.6 Intel
- 12.1.6.1. Company Overview
- 12.1.6.2. Products
- 12.1.6.3. Company Financials
- 12.1.6.4. SWOT Analysis
- 12.1.7 Elliot Scientific
- 12.1.7.1. Company Overview
- 12.1.7.2. Products
- 12.1.7.3. Company Financials
- 12.1.7.4. SWOT Analysis
- 12.1.8 TDK
- 12.1.8.1. Company Overview
- 12.1.8.2. Products
- 12.1.8.3. Company Financials
- 12.1.8.4. SWOT Analysis
- 12.1.1 Supracon AG
- 12.2. Market Entropy
- 12.2.1 Company's Key Areas Served
- 12.2.2 Recent Developments
- 12.3. Company Market Share Analysis 2025
- 12.3.1 Top 5 Companies Market Share Analysis
- 12.3.2 Top 3 Companies Market Share Analysis
- 12.4. List of Potential Customers
- 13. Research Methodology
List of Figures
- Figure 1: Global Superconducting Quantum Interferometer Sensor Revenue Breakdown (million, %) by Region 2025 & 2033
- Figure 2: Global Superconducting Quantum Interferometer Sensor Volume Breakdown (K, %) by Region 2025 & 2033
- Figure 3: North America Superconducting Quantum Interferometer Sensor Revenue (million), by Application 2025 & 2033
- Figure 4: North America Superconducting Quantum Interferometer Sensor Volume (K), by Application 2025 & 2033
- Figure 5: North America Superconducting Quantum Interferometer Sensor Revenue Share (%), by Application 2025 & 2033
- Figure 6: North America Superconducting Quantum Interferometer Sensor Volume Share (%), by Application 2025 & 2033
- Figure 7: North America Superconducting Quantum Interferometer Sensor Revenue (million), by Types 2025 & 2033
- Figure 8: North America Superconducting Quantum Interferometer Sensor Volume (K), by Types 2025 & 2033
- Figure 9: North America Superconducting Quantum Interferometer Sensor Revenue Share (%), by Types 2025 & 2033
- Figure 10: North America Superconducting Quantum Interferometer Sensor Volume Share (%), by Types 2025 & 2033
- Figure 11: North America Superconducting Quantum Interferometer Sensor Revenue (million), by Country 2025 & 2033
- Figure 12: North America Superconducting Quantum Interferometer Sensor Volume (K), by Country 2025 & 2033
- Figure 13: North America Superconducting Quantum Interferometer Sensor Revenue Share (%), by Country 2025 & 2033
- Figure 14: North America Superconducting Quantum Interferometer Sensor Volume Share (%), by Country 2025 & 2033
- Figure 15: South America Superconducting Quantum Interferometer Sensor Revenue (million), by Application 2025 & 2033
- Figure 16: South America Superconducting Quantum Interferometer Sensor Volume (K), by Application 2025 & 2033
- Figure 17: South America Superconducting Quantum Interferometer Sensor Revenue Share (%), by Application 2025 & 2033
- Figure 18: South America Superconducting Quantum Interferometer Sensor Volume Share (%), by Application 2025 & 2033
- Figure 19: South America Superconducting Quantum Interferometer Sensor Revenue (million), by Types 2025 & 2033
- Figure 20: South America Superconducting Quantum Interferometer Sensor Volume (K), by Types 2025 & 2033
- Figure 21: South America Superconducting Quantum Interferometer Sensor Revenue Share (%), by Types 2025 & 2033
- Figure 22: South America Superconducting Quantum Interferometer Sensor Volume Share (%), by Types 2025 & 2033
- Figure 23: South America Superconducting Quantum Interferometer Sensor Revenue (million), by Country 2025 & 2033
- Figure 24: South America Superconducting Quantum Interferometer Sensor Volume (K), by Country 2025 & 2033
- Figure 25: South America Superconducting Quantum Interferometer Sensor Revenue Share (%), by Country 2025 & 2033
- Figure 26: South America Superconducting Quantum Interferometer Sensor Volume Share (%), by Country 2025 & 2033
- Figure 27: Europe Superconducting Quantum Interferometer Sensor Revenue (million), by Application 2025 & 2033
- Figure 28: Europe Superconducting Quantum Interferometer Sensor Volume (K), by Application 2025 & 2033
- Figure 29: Europe Superconducting Quantum Interferometer Sensor Revenue Share (%), by Application 2025 & 2033
- Figure 30: Europe Superconducting Quantum Interferometer Sensor Volume Share (%), by Application 2025 & 2033
- Figure 31: Europe Superconducting Quantum Interferometer Sensor Revenue (million), by Types 2025 & 2033
- Figure 32: Europe Superconducting Quantum Interferometer Sensor Volume (K), by Types 2025 & 2033
- Figure 33: Europe Superconducting Quantum Interferometer Sensor Revenue Share (%), by Types 2025 & 2033
- Figure 34: Europe Superconducting Quantum Interferometer Sensor Volume Share (%), by Types 2025 & 2033
- Figure 35: Europe Superconducting Quantum Interferometer Sensor Revenue (million), by Country 2025 & 2033
- Figure 36: Europe Superconducting Quantum Interferometer Sensor Volume (K), by Country 2025 & 2033
- Figure 37: Europe Superconducting Quantum Interferometer Sensor Revenue Share (%), by Country 2025 & 2033
- Figure 38: Europe Superconducting Quantum Interferometer Sensor Volume Share (%), by Country 2025 & 2033
- Figure 39: Middle East & Africa Superconducting Quantum Interferometer Sensor Revenue (million), by Application 2025 & 2033
- Figure 40: Middle East & Africa Superconducting Quantum Interferometer Sensor Volume (K), by Application 2025 & 2033
- Figure 41: Middle East & Africa Superconducting Quantum Interferometer Sensor Revenue Share (%), by Application 2025 & 2033
- Figure 42: Middle East & Africa Superconducting Quantum Interferometer Sensor Volume Share (%), by Application 2025 & 2033
- Figure 43: Middle East & Africa Superconducting Quantum Interferometer Sensor Revenue (million), by Types 2025 & 2033
- Figure 44: Middle East & Africa Superconducting Quantum Interferometer Sensor Volume (K), by Types 2025 & 2033
- Figure 45: Middle East & Africa Superconducting Quantum Interferometer Sensor Revenue Share (%), by Types 2025 & 2033
- Figure 46: Middle East & Africa Superconducting Quantum Interferometer Sensor Volume Share (%), by Types 2025 & 2033
- Figure 47: Middle East & Africa Superconducting Quantum Interferometer Sensor Revenue (million), by Country 2025 & 2033
- Figure 48: Middle East & Africa Superconducting Quantum Interferometer Sensor Volume (K), by Country 2025 & 2033
- Figure 49: Middle East & Africa Superconducting Quantum Interferometer Sensor Revenue Share (%), by Country 2025 & 2033
- Figure 50: Middle East & Africa Superconducting Quantum Interferometer Sensor Volume Share (%), by Country 2025 & 2033
- Figure 51: Asia Pacific Superconducting Quantum Interferometer Sensor Revenue (million), by Application 2025 & 2033
- Figure 52: Asia Pacific Superconducting Quantum Interferometer Sensor Volume (K), by Application 2025 & 2033
- Figure 53: Asia Pacific Superconducting Quantum Interferometer Sensor Revenue Share (%), by Application 2025 & 2033
- Figure 54: Asia Pacific Superconducting Quantum Interferometer Sensor Volume Share (%), by Application 2025 & 2033
- Figure 55: Asia Pacific Superconducting Quantum Interferometer Sensor Revenue (million), by Types 2025 & 2033
- Figure 56: Asia Pacific Superconducting Quantum Interferometer Sensor Volume (K), by Types 2025 & 2033
- Figure 57: Asia Pacific Superconducting Quantum Interferometer Sensor Revenue Share (%), by Types 2025 & 2033
- Figure 58: Asia Pacific Superconducting Quantum Interferometer Sensor Volume Share (%), by Types 2025 & 2033
- Figure 59: Asia Pacific Superconducting Quantum Interferometer Sensor Revenue (million), by Country 2025 & 2033
- Figure 60: Asia Pacific Superconducting Quantum Interferometer Sensor Volume (K), by Country 2025 & 2033
- Figure 61: Asia Pacific Superconducting Quantum Interferometer Sensor Revenue Share (%), by Country 2025 & 2033
- Figure 62: Asia Pacific Superconducting Quantum Interferometer Sensor Volume Share (%), by Country 2025 & 2033
List of Tables
- Table 1: Global Superconducting Quantum Interferometer Sensor Revenue million Forecast, by Application 2020 & 2033
- Table 2: Global Superconducting Quantum Interferometer Sensor Volume K Forecast, by Application 2020 & 2033
- Table 3: Global Superconducting Quantum Interferometer Sensor Revenue million Forecast, by Types 2020 & 2033
- Table 4: Global Superconducting Quantum Interferometer Sensor Volume K Forecast, by Types 2020 & 2033
- Table 5: Global Superconducting Quantum Interferometer Sensor Revenue million Forecast, by Region 2020 & 2033
- Table 6: Global Superconducting Quantum Interferometer Sensor Volume K Forecast, by Region 2020 & 2033
- Table 7: Global Superconducting Quantum Interferometer Sensor Revenue million Forecast, by Application 2020 & 2033
- Table 8: Global Superconducting Quantum Interferometer Sensor Volume K Forecast, by Application 2020 & 2033
- Table 9: Global Superconducting Quantum Interferometer Sensor Revenue million Forecast, by Types 2020 & 2033
- Table 10: Global Superconducting Quantum Interferometer Sensor Volume K Forecast, by Types 2020 & 2033
- Table 11: Global Superconducting Quantum Interferometer Sensor Revenue million Forecast, by Country 2020 & 2033
- Table 12: Global Superconducting Quantum Interferometer Sensor Volume K Forecast, by Country 2020 & 2033
- Table 13: United States Superconducting Quantum Interferometer Sensor Revenue (million) Forecast, by Application 2020 & 2033
- Table 14: United States Superconducting Quantum Interferometer Sensor Volume (K) Forecast, by Application 2020 & 2033
- Table 15: Canada Superconducting Quantum Interferometer Sensor Revenue (million) Forecast, by Application 2020 & 2033
- Table 16: Canada Superconducting Quantum Interferometer Sensor Volume (K) Forecast, by Application 2020 & 2033
- Table 17: Mexico Superconducting Quantum Interferometer Sensor Revenue (million) Forecast, by Application 2020 & 2033
- Table 18: Mexico Superconducting Quantum Interferometer Sensor Volume (K) Forecast, by Application 2020 & 2033
- Table 19: Global Superconducting Quantum Interferometer Sensor Revenue million Forecast, by Application 2020 & 2033
- Table 20: Global Superconducting Quantum Interferometer Sensor Volume K Forecast, by Application 2020 & 2033
- Table 21: Global Superconducting Quantum Interferometer Sensor Revenue million Forecast, by Types 2020 & 2033
- Table 22: Global Superconducting Quantum Interferometer Sensor Volume K Forecast, by Types 2020 & 2033
- Table 23: Global Superconducting Quantum Interferometer Sensor Revenue million Forecast, by Country 2020 & 2033
- Table 24: Global Superconducting Quantum Interferometer Sensor Volume K Forecast, by Country 2020 & 2033
- Table 25: Brazil Superconducting Quantum Interferometer Sensor Revenue (million) Forecast, by Application 2020 & 2033
- Table 26: Brazil Superconducting Quantum Interferometer Sensor Volume (K) Forecast, by Application 2020 & 2033
- Table 27: Argentina Superconducting Quantum Interferometer Sensor Revenue (million) Forecast, by Application 2020 & 2033
- Table 28: Argentina Superconducting Quantum Interferometer Sensor Volume (K) Forecast, by Application 2020 & 2033
- Table 29: Rest of South America Superconducting Quantum Interferometer Sensor Revenue (million) Forecast, by Application 2020 & 2033
- Table 30: Rest of South America Superconducting Quantum Interferometer Sensor Volume (K) Forecast, by Application 2020 & 2033
- Table 31: Global Superconducting Quantum Interferometer Sensor Revenue million Forecast, by Application 2020 & 2033
- Table 32: Global Superconducting Quantum Interferometer Sensor Volume K Forecast, by Application 2020 & 2033
- Table 33: Global Superconducting Quantum Interferometer Sensor Revenue million Forecast, by Types 2020 & 2033
- Table 34: Global Superconducting Quantum Interferometer Sensor Volume K Forecast, by Types 2020 & 2033
- Table 35: Global Superconducting Quantum Interferometer Sensor Revenue million Forecast, by Country 2020 & 2033
- Table 36: Global Superconducting Quantum Interferometer Sensor Volume K Forecast, by Country 2020 & 2033
- Table 37: United Kingdom Superconducting Quantum Interferometer Sensor Revenue (million) Forecast, by Application 2020 & 2033
- Table 38: United Kingdom Superconducting Quantum Interferometer Sensor Volume (K) Forecast, by Application 2020 & 2033
- Table 39: Germany Superconducting Quantum Interferometer Sensor Revenue (million) Forecast, by Application 2020 & 2033
- Table 40: Germany Superconducting Quantum Interferometer Sensor Volume (K) Forecast, by Application 2020 & 2033
- Table 41: France Superconducting Quantum Interferometer Sensor Revenue (million) Forecast, by Application 2020 & 2033
- Table 42: France Superconducting Quantum Interferometer Sensor Volume (K) Forecast, by Application 2020 & 2033
- Table 43: Italy Superconducting Quantum Interferometer Sensor Revenue (million) Forecast, by Application 2020 & 2033
- Table 44: Italy Superconducting Quantum Interferometer Sensor Volume (K) Forecast, by Application 2020 & 2033
- Table 45: Spain Superconducting Quantum Interferometer Sensor Revenue (million) Forecast, by Application 2020 & 2033
- Table 46: Spain Superconducting Quantum Interferometer Sensor Volume (K) Forecast, by Application 2020 & 2033
- Table 47: Russia Superconducting Quantum Interferometer Sensor Revenue (million) Forecast, by Application 2020 & 2033
- Table 48: Russia Superconducting Quantum Interferometer Sensor Volume (K) Forecast, by Application 2020 & 2033
- Table 49: Benelux Superconducting Quantum Interferometer Sensor Revenue (million) Forecast, by Application 2020 & 2033
- Table 50: Benelux Superconducting Quantum Interferometer Sensor Volume (K) Forecast, by Application 2020 & 2033
- Table 51: Nordics Superconducting Quantum Interferometer Sensor Revenue (million) Forecast, by Application 2020 & 2033
- Table 52: Nordics Superconducting Quantum Interferometer Sensor Volume (K) Forecast, by Application 2020 & 2033
- Table 53: Rest of Europe Superconducting Quantum Interferometer Sensor Revenue (million) Forecast, by Application 2020 & 2033
- Table 54: Rest of Europe Superconducting Quantum Interferometer Sensor Volume (K) Forecast, by Application 2020 & 2033
- Table 55: Global Superconducting Quantum Interferometer Sensor Revenue million Forecast, by Application 2020 & 2033
- Table 56: Global Superconducting Quantum Interferometer Sensor Volume K Forecast, by Application 2020 & 2033
- Table 57: Global Superconducting Quantum Interferometer Sensor Revenue million Forecast, by Types 2020 & 2033
- Table 58: Global Superconducting Quantum Interferometer Sensor Volume K Forecast, by Types 2020 & 2033
- Table 59: Global Superconducting Quantum Interferometer Sensor Revenue million Forecast, by Country 2020 & 2033
- Table 60: Global Superconducting Quantum Interferometer Sensor Volume K Forecast, by Country 2020 & 2033
- Table 61: Turkey Superconducting Quantum Interferometer Sensor Revenue (million) Forecast, by Application 2020 & 2033
- Table 62: Turkey Superconducting Quantum Interferometer Sensor Volume (K) Forecast, by Application 2020 & 2033
- Table 63: Israel Superconducting Quantum Interferometer Sensor Revenue (million) Forecast, by Application 2020 & 2033
- Table 64: Israel Superconducting Quantum Interferometer Sensor Volume (K) Forecast, by Application 2020 & 2033
- Table 65: GCC Superconducting Quantum Interferometer Sensor Revenue (million) Forecast, by Application 2020 & 2033
- Table 66: GCC Superconducting Quantum Interferometer Sensor Volume (K) Forecast, by Application 2020 & 2033
- Table 67: North Africa Superconducting Quantum Interferometer Sensor Revenue (million) Forecast, by Application 2020 & 2033
- Table 68: North Africa Superconducting Quantum Interferometer Sensor Volume (K) Forecast, by Application 2020 & 2033
- Table 69: South Africa Superconducting Quantum Interferometer Sensor Revenue (million) Forecast, by Application 2020 & 2033
- Table 70: South Africa Superconducting Quantum Interferometer Sensor Volume (K) Forecast, by Application 2020 & 2033
- Table 71: Rest of Middle East & Africa Superconducting Quantum Interferometer Sensor Revenue (million) Forecast, by Application 2020 & 2033
- Table 72: Rest of Middle East & Africa Superconducting Quantum Interferometer Sensor Volume (K) Forecast, by Application 2020 & 2033
- Table 73: Global Superconducting Quantum Interferometer Sensor Revenue million Forecast, by Application 2020 & 2033
- Table 74: Global Superconducting Quantum Interferometer Sensor Volume K Forecast, by Application 2020 & 2033
- Table 75: Global Superconducting Quantum Interferometer Sensor Revenue million Forecast, by Types 2020 & 2033
- Table 76: Global Superconducting Quantum Interferometer Sensor Volume K Forecast, by Types 2020 & 2033
- Table 77: Global Superconducting Quantum Interferometer Sensor Revenue million Forecast, by Country 2020 & 2033
- Table 78: Global Superconducting Quantum Interferometer Sensor Volume K Forecast, by Country 2020 & 2033
- Table 79: China Superconducting Quantum Interferometer Sensor Revenue (million) Forecast, by Application 2020 & 2033
- Table 80: China Superconducting Quantum Interferometer Sensor Volume (K) Forecast, by Application 2020 & 2033
- Table 81: India Superconducting Quantum Interferometer Sensor Revenue (million) Forecast, by Application 2020 & 2033
- Table 82: India Superconducting Quantum Interferometer Sensor Volume (K) Forecast, by Application 2020 & 2033
- Table 83: Japan Superconducting Quantum Interferometer Sensor Revenue (million) Forecast, by Application 2020 & 2033
- Table 84: Japan Superconducting Quantum Interferometer Sensor Volume (K) Forecast, by Application 2020 & 2033
- Table 85: South Korea Superconducting Quantum Interferometer Sensor Revenue (million) Forecast, by Application 2020 & 2033
- Table 86: South Korea Superconducting Quantum Interferometer Sensor Volume (K) Forecast, by Application 2020 & 2033
- Table 87: ASEAN Superconducting Quantum Interferometer Sensor Revenue (million) Forecast, by Application 2020 & 2033
- Table 88: ASEAN Superconducting Quantum Interferometer Sensor Volume (K) Forecast, by Application 2020 & 2033
- Table 89: Oceania Superconducting Quantum Interferometer Sensor Revenue (million) Forecast, by Application 2020 & 2033
- Table 90: Oceania Superconducting Quantum Interferometer Sensor Volume (K) Forecast, by Application 2020 & 2033
- Table 91: Rest of Asia Pacific Superconducting Quantum Interferometer Sensor Revenue (million) Forecast, by Application 2020 & 2033
- Table 92: Rest of Asia Pacific Superconducting Quantum Interferometer Sensor Volume (K) Forecast, by Application 2020 & 2033
Frequently Asked Questions
1. What is the projected Compound Annual Growth Rate (CAGR) of the Superconducting Quantum Interferometer Sensor?
The projected CAGR is approximately 15.6%.
2. Which companies are prominent players in the Superconducting Quantum Interferometer Sensor?
Key companies in the market include Supracon AG, Quantum Design, STAR Cryoelectronics, MagQu, EPRI, Intel, Elliot Scientific, TDK.
3. What are the main segments of the Superconducting Quantum Interferometer Sensor?
The market segments include Application, Types.
4. Can you provide details about the market size?
The market size is estimated to be USD 819.2 million as of 2022.
5. What are some drivers contributing to market growth?
N/A
6. What are the notable trends driving market growth?
N/A
7. Are there any restraints impacting market growth?
N/A
8. Can you provide examples of recent developments in the market?
N/A
9. What pricing options are available for accessing the report?
Pricing options include single-user, multi-user, and enterprise licenses priced at USD 3350.00, USD 5025.00, and USD 6700.00 respectively.
10. Is the market size provided in terms of value or volume?
The market size is provided in terms of value, measured in million and volume, measured in K.
11. Are there any specific market keywords associated with the report?
Yes, the market keyword associated with the report is "Superconducting Quantum Interferometer Sensor," which aids in identifying and referencing the specific market segment covered.
12. How do I determine which pricing option suits my needs best?
The pricing options vary based on user requirements and access needs. Individual users may opt for single-user licenses, while businesses requiring broader access may choose multi-user or enterprise licenses for cost-effective access to the report.
13. Are there any additional resources or data provided in the Superconducting Quantum Interferometer Sensor report?
While the report offers comprehensive insights, it's advisable to review the specific contents or supplementary materials provided to ascertain if additional resources or data are available.
14. How can I stay updated on further developments or reports in the Superconducting Quantum Interferometer Sensor?
To stay informed about further developments, trends, and reports in the Superconducting Quantum Interferometer Sensor, consider subscribing to industry newsletters, following relevant companies and organizations, or regularly checking reputable industry news sources and publications.
Methodology
Step 1 - Identification of Relevant Samples Size from Population Database


Step 2 - Approaches for Defining Global Market Size (Value, Volume* & Price*)

Note*: In applicable scenarios
Step 3 - Data Sources
Primary Research
- Web Analytics
- Survey Reports
- Research Institute
- Latest Research Reports
- Opinion Leaders
Secondary Research
- Annual Reports
- White Paper
- Latest Press Release
- Industry Association
- Paid Database
- Investor Presentations

Step 4 - Data Triangulation
Involves using different sources of information in order to increase the validity of a study
These sources are likely to be stakeholders in a program - participants, other researchers, program staff, other community members, and so on.
Then we put all data in single framework & apply various statistical tools to find out the dynamic on the market.
During the analysis stage, feedback from the stakeholder groups would be compared to determine areas of agreement as well as areas of divergence