

Key Insights
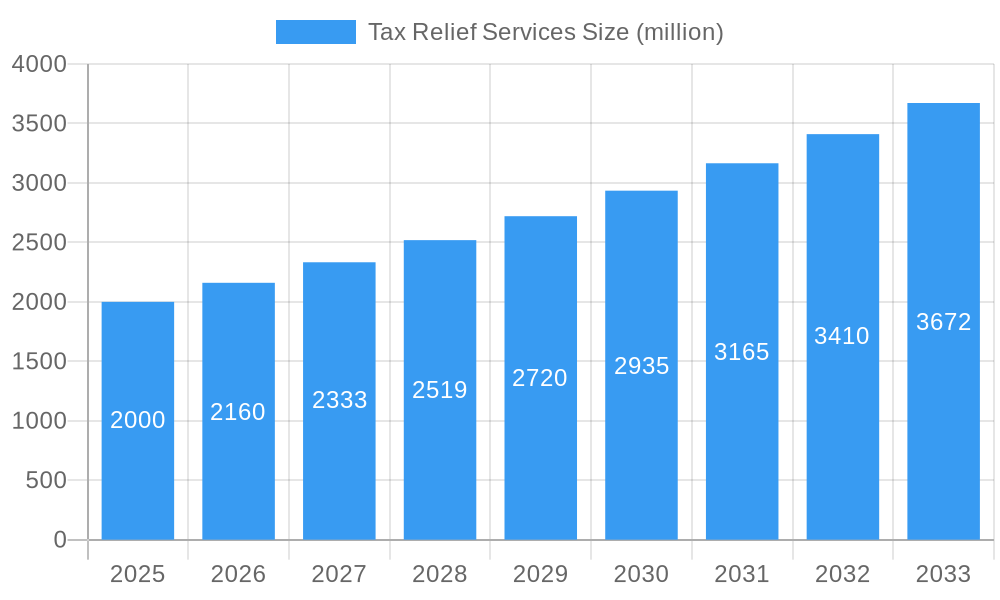
The tax relief services market is experiencing robust growth, driven by increasing complexities in tax regulations, a rise in individual and business tax debt, and a growing awareness of available relief options. The market, estimated at $2 billion in 2025, is projected to expand at a Compound Annual Growth Rate (CAGR) of 8% from 2025 to 2033, reaching an estimated value of $4 billion by 2033. This growth is fueled by several key factors. First, the ever-evolving tax code presents challenges for both individuals and businesses, creating a higher demand for specialized expertise in navigating tax laws and resolving tax issues. Second, economic fluctuations and unexpected financial hardships often lead to increased tax debt, further driving demand for professional tax relief services. Finally, improved marketing and increased public awareness of available tax relief programs are making these services more accessible to a wider range of individuals and businesses.
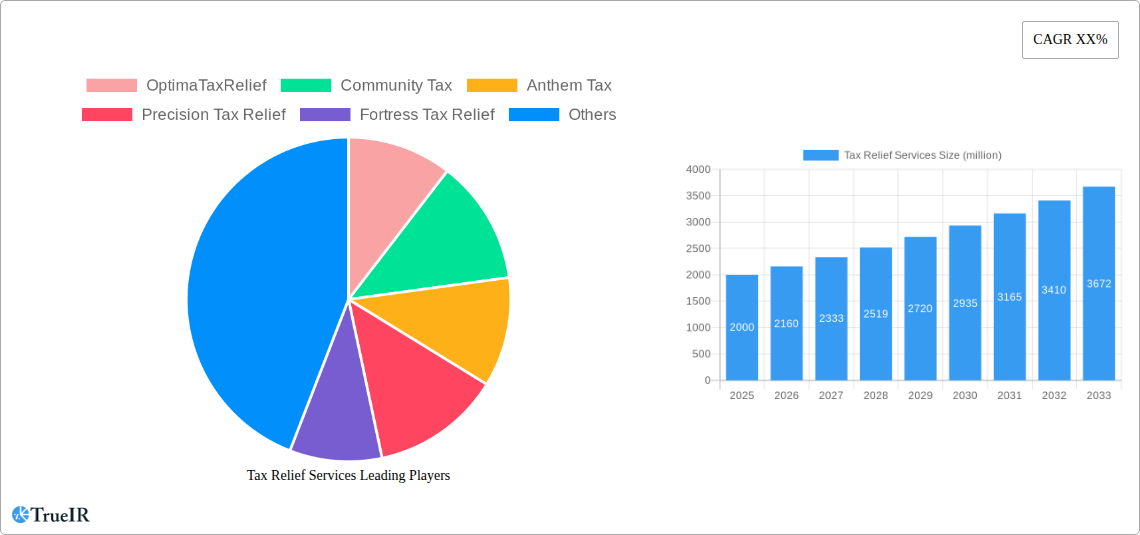
Tax Relief Services Market Size (In Billion)
The market is segmented by service type (e.g., IRS audit representation, offer-in-compromise assistance, installment agreements, penalty abatement), client type (individuals, small businesses, large corporations), and geographic region. Key players like OptimaTaxRelief, Community Tax, and others are competing based on service offerings, pricing strategies, and geographic reach. However, market consolidation and the emergence of tech-enabled solutions are potential future trends. While the growth is promising, potential restraints include increasing regulatory scrutiny, the potential for fraudulent activities within the industry, and economic downturns that might reduce clients' ability to afford these services. Understanding these factors is crucial for both market participants and investors looking to navigate this dynamic sector.
Tax Relief Services Company Market Share
This in-depth report provides a comprehensive analysis of the Tax Relief Services market, projecting a multi-million dollar valuation by 2033. The study covers the period 2019-2033, with a base year of 2025 and a forecast period of 2025-2033. We analyze market structure, competitive dynamics, growth drivers, challenges, and future outlook, offering valuable insights for businesses, investors, and policymakers. This report leverages extensive research and data analysis to provide actionable intelligence on this rapidly evolving sector. The total market value in 2025 is estimated at $xx million and is projected to reach $xx million by 2033, exhibiting a CAGR of xx%.
Tax Relief Services Market Structure & Competitive Landscape
The Tax Relief Services market exhibits a moderately concentrated structure, with a few large players and numerous smaller firms vying for market share. The Herfindahl-Hirschman Index (HHI) for 2025 is estimated to be xx, indicating a moderately competitive landscape. Innovation is a key driver, with firms constantly developing new technologies and services to improve efficiency and client experience. Regulatory changes, such as those impacting tax laws and data privacy, significantly impact the market. The primary product substitutes include DIY tax software and traditional accounting services.
Market segmentation is based primarily on client type (individuals vs. businesses) and service offered (e.g., tax audit representation, IRS negotiation, back tax resolution). Mergers and acquisitions (M&A) activity has been significant in recent years, with xx major deals recorded between 2019 and 2024, leading to increased market consolidation. These deals primarily aim to expand service offerings, geographical reach, and enhance technological capabilities.
- Market Concentration: HHI of xx in 2025
- Innovation Drivers: Development of AI-powered tax software, expansion of online services
- Regulatory Impacts: Changes in tax laws, data privacy regulations
- Product Substitutes: DIY tax software, traditional accounting services
- End-User Segmentation: Individuals, Small Businesses, Large Corporations
- M&A Trends: xx major deals between 2019 and 2024
Tax Relief Services Market Trends & Opportunities
The Tax Relief Services market is experiencing robust growth, driven by increasing tax complexity, rising disposable incomes, and heightened awareness of tax relief options. The market size is projected to grow from $xx million in 2025 to $xx million by 2033, demonstrating significant market potential. This expansion is fueled by several key factors including the adoption of advanced technologies like AI and machine learning for automation and improved accuracy, the rising demand for specialized tax relief services among businesses and individuals, and the expansion of online platforms that improve accessibility and convenience. The competitive landscape is dynamic, with established players continuously expanding their service offerings and new entrants leveraging innovative business models. This growth, however, is not without its challenges, as the market faces regulatory hurdles and intense competition, particularly among larger firms.
Dominant Markets & Segments in Tax Relief Services
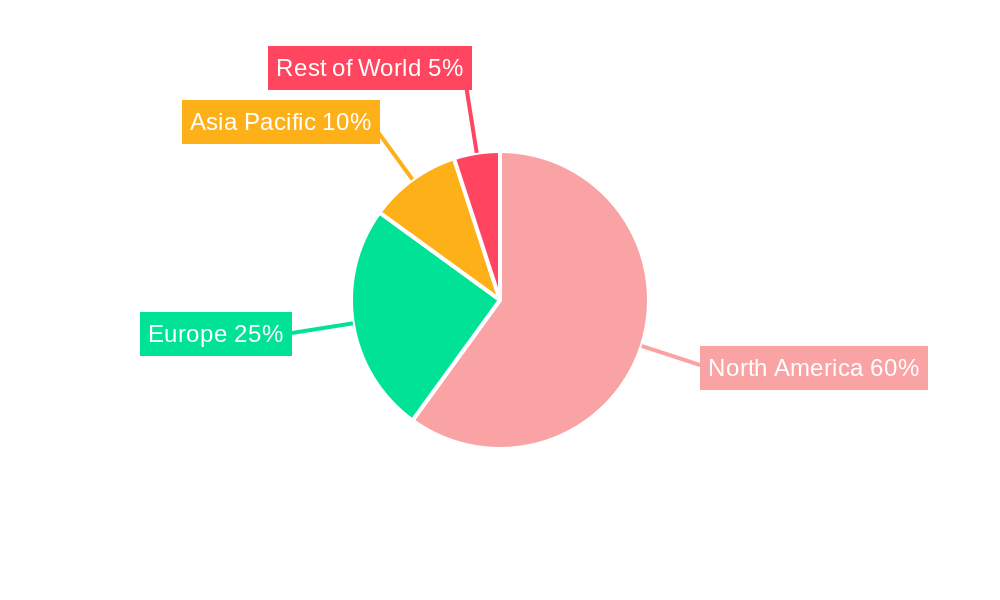
The United States currently represents the largest market for tax relief services, driven by its complex tax code and high individual and business tax burdens. Other key markets include Canada and the United Kingdom, reflecting similar trends. Within the US, California, Texas, and New York are leading regional markets due to large populations and significant numbers of businesses.
- Key Growth Drivers (US):
- Complex tax regulations
- High tax burdens
- Increasing awareness of tax relief services
- Growing number of small businesses
- Market Dominance Analysis: The US market's dominance stems from the complex US tax system, which leads to increased demand for professional tax relief services. This situation fosters a highly competitive landscape within the US, with several national and regional companies battling for market share. The growth of digital solutions and automation is further intensifying competition while facilitating expansion to underserved areas.
Tax Relief Services Product Analysis
Tax relief services encompass a range of offerings, including audit representation, IRS negotiation, offer in compromise assistance, and back tax resolution. Recent product innovations focus on leveraging technology for increased efficiency and client accessibility – for instance, online portals for document submission, AI-powered tax analysis tools, and streamlined communication systems. These advancements enhance the speed and accuracy of service delivery, providing a competitive advantage. The market fit for these products is strong due to increasing demand for convenient, cost-effective, and technologically advanced tax solutions.
Key Drivers, Barriers & Challenges in Tax Relief Services
Key Drivers: Increased tax complexity, growing awareness of available tax relief options, the rise of sophisticated tax software, and government initiatives promoting tax compliance are primary drivers for market growth.
Challenges & Restraints: Stringent regulatory frameworks, evolving tax laws, intense competition among firms, and maintaining client confidentiality amidst increasing cybersecurity threats significantly hinder market growth. The impact of these challenges is estimated to reduce the market CAGR by approximately xx% over the forecast period.
Growth Drivers in the Tax Relief Services Market
The key drivers for growth in the tax relief services market include the escalating complexity of tax laws, increasing tax burdens, and the growing popularity of digital solutions that facilitate easier access to tax assistance. These factors, coupled with rising awareness about tax relief programs, stimulate demand for professional help.
Challenges Impacting Tax Relief Services Growth
Significant challenges hindering growth include strict regulatory requirements, evolving tax codes that necessitate constant adaptation by service providers, escalating competition, and the persistent threat of cybersecurity breaches that endanger client data. These factors collectively restrict market expansion and profitability.
Key Players Shaping the Tax Relief Services Market
- OptimaTaxRelief
- Community Tax
- Anthem Tax
- Precision Tax Relief
- Fortress Tax Relief
- Tax Hardship Center
- Tax Rise
- Larson Tax Relief
- Tax Defense Network
- Liberty Tax
- Alleviate Tax
- DTCC
- ALG Tax Solutions
- Enterprise Consultants Group
- Approved Accounting
- Tax Group Center
- Creative Tax Reliefs
- Blueprint Financial Consulting
Significant Tax Relief Services Industry Milestones
- 2020, Q4: Increased adoption of cloud-based tax software by major players.
- 2021, Q2: Launch of AI-powered tax audit preparation tools by several firms.
- 2022, Q1: Significant M&A activity leading to consolidation in the market.
- 2023, Q3: Government initiatives to promote transparency and compliance in the tax relief sector.
Future Outlook for Tax Relief Services Market
The Tax Relief Services market is poised for continued growth, driven by persistent tax complexity, increasing technological advancements, and the rising demand for professional tax assistance. Strategic opportunities exist for firms to leverage innovative technologies, expand service offerings, and focus on niche markets. The market's future potential is significant, particularly in emerging markets and among underserved populations.
Tax Relief Services Segmentation
-
1. Application
- 1.1. Personal
- 1.2. Family
-
2. Types
- 2.1. Income Tax Relief Services
- 2.2. Property Tax Relief Services
- 2.3. Others
Tax Relief Services Segmentation By Geography
-
1. North America
- 1.1. United States
- 1.2. Canada
- 1.3. Mexico
-
2. South America
- 2.1. Brazil
- 2.2. Argentina
- 2.3. Rest of South America
-
3. Europe
- 3.1. United Kingdom
- 3.2. Germany
- 3.3. France
- 3.4. Italy
- 3.5. Spain
- 3.6. Russia
- 3.7. Benelux
- 3.8. Nordics
- 3.9. Rest of Europe
-
4. Middle East & Africa
- 4.1. Turkey
- 4.2. Israel
- 4.3. GCC
- 4.4. North Africa
- 4.5. South Africa
- 4.6. Rest of Middle East & Africa
-
5. Asia Pacific
- 5.1. China
- 5.2. India
- 5.3. Japan
- 5.4. South Korea
- 5.5. ASEAN
- 5.6. Oceania
- 5.7. Rest of Asia Pacific
Tax Relief Services Regional Market Share
Geographic Coverage of Tax Relief Services
Tax Relief Services REPORT HIGHLIGHTS
| Aspects | Details |
|---|---|
| Study Period | 2020-2034 |
| Base Year | 2025 |
| Estimated Year | 2026 |
| Forecast Period | 2026-2034 |
| Historical Period | 2020-2025 |
| Growth Rate | CAGR of 4.67% from 2020-2034 |
| Segmentation |
|
Table of Contents
- 1. Introduction
- 1.1. Research Scope
- 1.2. Market Segmentation
- 1.3. Research Objective
- 1.4. Definitions and Assumptions
- 2. Executive Summary
- 2.1. Market Snapshot
- 3. Market Dynamics
- 3.1. Market Drivers
- 3.2. Market Restrains
- 3.3. Market Trends
- 3.4. Market Opportunities
- 4. Market Factor Analysis
- 4.1. Porters Five Forces
- 4.1.1. Bargaining Power of Suppliers
- 4.1.2. Bargaining Power of Buyers
- 4.1.3. Threat of New Entrants
- 4.1.4. Threat of Substitutes
- 4.1.5. Competitive Rivalry
- 4.2. PESTEL analysis
- 4.3. BCG Analysis
- 4.3.1. Stars (High Growth, High Market Share)
- 4.3.2. Cash Cows (Low Growth, High Market Share)
- 4.3.3. Question Mark (High Growth, Low Market Share)
- 4.3.4. Dogs (Low Growth, Low Market Share)
- 4.4. Ansoff Matrix Analysis
- 4.5. Supply Chain Analysis
- 4.6. Regulatory Landscape
- 4.7. Current Market Potential and Opportunity Assessment (TAM–SAM–SOM Framework)
- 4.8. TIR Analyst Note
- 4.1. Porters Five Forces
- 5. Market Analysis, Insights and Forecast 2021-2033
- 5.1. Market Analysis, Insights and Forecast - by Application
- 5.1.1. Personal
- 5.1.2. Family
- 5.2. Market Analysis, Insights and Forecast - by Types
- 5.2.1. Income Tax Relief Services
- 5.2.2. Property Tax Relief Services
- 5.2.3. Others
- 5.3. Market Analysis, Insights and Forecast - by Region
- 5.3.1. North America
- 5.3.2. South America
- 5.3.3. Europe
- 5.3.4. Middle East & Africa
- 5.3.5. Asia Pacific
- 5.1. Market Analysis, Insights and Forecast - by Application
- 6. Global Tax Relief Services Analysis, Insights and Forecast, 2021-2033
- 6.1. Market Analysis, Insights and Forecast - by Application
- 6.1.1. Personal
- 6.1.2. Family
- 6.2. Market Analysis, Insights and Forecast - by Types
- 6.2.1. Income Tax Relief Services
- 6.2.2. Property Tax Relief Services
- 6.2.3. Others
- 6.1. Market Analysis, Insights and Forecast - by Application
- 7. North America Tax Relief Services Analysis, Insights and Forecast, 2020-2032
- 7.1. Market Analysis, Insights and Forecast - by Application
- 7.1.1. Personal
- 7.1.2. Family
- 7.2. Market Analysis, Insights and Forecast - by Types
- 7.2.1. Income Tax Relief Services
- 7.2.2. Property Tax Relief Services
- 7.2.3. Others
- 7.1. Market Analysis, Insights and Forecast - by Application
- 8. South America Tax Relief Services Analysis, Insights and Forecast, 2020-2032
- 8.1. Market Analysis, Insights and Forecast - by Application
- 8.1.1. Personal
- 8.1.2. Family
- 8.2. Market Analysis, Insights and Forecast - by Types
- 8.2.1. Income Tax Relief Services
- 8.2.2. Property Tax Relief Services
- 8.2.3. Others
- 8.1. Market Analysis, Insights and Forecast - by Application
- 9. Europe Tax Relief Services Analysis, Insights and Forecast, 2020-2032
- 9.1. Market Analysis, Insights and Forecast - by Application
- 9.1.1. Personal
- 9.1.2. Family
- 9.2. Market Analysis, Insights and Forecast - by Types
- 9.2.1. Income Tax Relief Services
- 9.2.2. Property Tax Relief Services
- 9.2.3. Others
- 9.1. Market Analysis, Insights and Forecast - by Application
- 10. Middle East & Africa Tax Relief Services Analysis, Insights and Forecast, 2020-2032
- 10.1. Market Analysis, Insights and Forecast - by Application
- 10.1.1. Personal
- 10.1.2. Family
- 10.2. Market Analysis, Insights and Forecast - by Types
- 10.2.1. Income Tax Relief Services
- 10.2.2. Property Tax Relief Services
- 10.2.3. Others
- 10.1. Market Analysis, Insights and Forecast - by Application
- 11. Asia Pacific Tax Relief Services Analysis, Insights and Forecast, 2020-2032
- 11.1. Market Analysis, Insights and Forecast - by Application
- 11.1.1. Personal
- 11.1.2. Family
- 11.2. Market Analysis, Insights and Forecast - by Types
- 11.2.1. Income Tax Relief Services
- 11.2.2. Property Tax Relief Services
- 11.2.3. Others
- 11.1. Market Analysis, Insights and Forecast - by Application
- 12. Competitive Analysis
- 12.1. Company Profiles
- 12.1.1 OptimaTaxRelief
- 12.1.1.1. Company Overview
- 12.1.1.2. Products
- 12.1.1.3. Company Financials
- 12.1.1.4. SWOT Analysis
- 12.1.2 Community Tax
- 12.1.2.1. Company Overview
- 12.1.2.2. Products
- 12.1.2.3. Company Financials
- 12.1.2.4. SWOT Analysis
- 12.1.3 Anthem Tax
- 12.1.3.1. Company Overview
- 12.1.3.2. Products
- 12.1.3.3. Company Financials
- 12.1.3.4. SWOT Analysis
- 12.1.4 Precision Tax Relief
- 12.1.4.1. Company Overview
- 12.1.4.2. Products
- 12.1.4.3. Company Financials
- 12.1.4.4. SWOT Analysis
- 12.1.5 Fortress Tax Relief
- 12.1.5.1. Company Overview
- 12.1.5.2. Products
- 12.1.5.3. Company Financials
- 12.1.5.4. SWOT Analysis
- 12.1.6 Tax Hardship Center
- 12.1.6.1. Company Overview
- 12.1.6.2. Products
- 12.1.6.3. Company Financials
- 12.1.6.4. SWOT Analysis
- 12.1.7 Tax Rise
- 12.1.7.1. Company Overview
- 12.1.7.2. Products
- 12.1.7.3. Company Financials
- 12.1.7.4. SWOT Analysis
- 12.1.8 Larson Tax Relief
- 12.1.8.1. Company Overview
- 12.1.8.2. Products
- 12.1.8.3. Company Financials
- 12.1.8.4. SWOT Analysis
- 12.1.9 Tax Defense Network
- 12.1.9.1. Company Overview
- 12.1.9.2. Products
- 12.1.9.3. Company Financials
- 12.1.9.4. SWOT Analysis
- 12.1.10 Liberty Tax
- 12.1.10.1. Company Overview
- 12.1.10.2. Products
- 12.1.10.3. Company Financials
- 12.1.10.4. SWOT Analysis
- 12.1.11 Alleviate Tax
- 12.1.11.1. Company Overview
- 12.1.11.2. Products
- 12.1.11.3. Company Financials
- 12.1.11.4. SWOT Analysis
- 12.1.12 DTCC
- 12.1.12.1. Company Overview
- 12.1.12.2. Products
- 12.1.12.3. Company Financials
- 12.1.12.4. SWOT Analysis
- 12.1.13 ALG Tax Solutions
- 12.1.13.1. Company Overview
- 12.1.13.2. Products
- 12.1.13.3. Company Financials
- 12.1.13.4. SWOT Analysis
- 12.1.14 Enterprise Consultants Group
- 12.1.14.1. Company Overview
- 12.1.14.2. Products
- 12.1.14.3. Company Financials
- 12.1.14.4. SWOT Analysis
- 12.1.15 Approved Accounting
- 12.1.15.1. Company Overview
- 12.1.15.2. Products
- 12.1.15.3. Company Financials
- 12.1.15.4. SWOT Analysis
- 12.1.16 Tax Group Center
- 12.1.16.1. Company Overview
- 12.1.16.2. Products
- 12.1.16.3. Company Financials
- 12.1.16.4. SWOT Analysis
- 12.1.17 Creative Tax Reliefs
- 12.1.17.1. Company Overview
- 12.1.17.2. Products
- 12.1.17.3. Company Financials
- 12.1.17.4. SWOT Analysis
- 12.1.18 Blueprint Financial Consulting
- 12.1.18.1. Company Overview
- 12.1.18.2. Products
- 12.1.18.3. Company Financials
- 12.1.18.4. SWOT Analysis
- 12.1.1 OptimaTaxRelief
- 12.2. Market Entropy
- 12.2.1 Company's Key Areas Served
- 12.2.2 Recent Developments
- 12.3. Company Market Share Analysis 2025
- 12.3.1 Top 5 Companies Market Share Analysis
- 12.3.2 Top 3 Companies Market Share Analysis
- 12.4. List of Potential Customers
- 13. Research Methodology
List of Figures
- Figure 1: Global Tax Relief Services Revenue Breakdown (undefined, %) by Region 2025 & 2033
- Figure 2: North America Tax Relief Services Revenue (undefined), by Application 2025 & 2033
- Figure 3: North America Tax Relief Services Revenue Share (%), by Application 2025 & 2033
- Figure 4: North America Tax Relief Services Revenue (undefined), by Types 2025 & 2033
- Figure 5: North America Tax Relief Services Revenue Share (%), by Types 2025 & 2033
- Figure 6: North America Tax Relief Services Revenue (undefined), by Country 2025 & 2033
- Figure 7: North America Tax Relief Services Revenue Share (%), by Country 2025 & 2033
- Figure 8: South America Tax Relief Services Revenue (undefined), by Application 2025 & 2033
- Figure 9: South America Tax Relief Services Revenue Share (%), by Application 2025 & 2033
- Figure 10: South America Tax Relief Services Revenue (undefined), by Types 2025 & 2033
- Figure 11: South America Tax Relief Services Revenue Share (%), by Types 2025 & 2033
- Figure 12: South America Tax Relief Services Revenue (undefined), by Country 2025 & 2033
- Figure 13: South America Tax Relief Services Revenue Share (%), by Country 2025 & 2033
- Figure 14: Europe Tax Relief Services Revenue (undefined), by Application 2025 & 2033
- Figure 15: Europe Tax Relief Services Revenue Share (%), by Application 2025 & 2033
- Figure 16: Europe Tax Relief Services Revenue (undefined), by Types 2025 & 2033
- Figure 17: Europe Tax Relief Services Revenue Share (%), by Types 2025 & 2033
- Figure 18: Europe Tax Relief Services Revenue (undefined), by Country 2025 & 2033
- Figure 19: Europe Tax Relief Services Revenue Share (%), by Country 2025 & 2033
- Figure 20: Middle East & Africa Tax Relief Services Revenue (undefined), by Application 2025 & 2033
- Figure 21: Middle East & Africa Tax Relief Services Revenue Share (%), by Application 2025 & 2033
- Figure 22: Middle East & Africa Tax Relief Services Revenue (undefined), by Types 2025 & 2033
- Figure 23: Middle East & Africa Tax Relief Services Revenue Share (%), by Types 2025 & 2033
- Figure 24: Middle East & Africa Tax Relief Services Revenue (undefined), by Country 2025 & 2033
- Figure 25: Middle East & Africa Tax Relief Services Revenue Share (%), by Country 2025 & 2033
- Figure 26: Asia Pacific Tax Relief Services Revenue (undefined), by Application 2025 & 2033
- Figure 27: Asia Pacific Tax Relief Services Revenue Share (%), by Application 2025 & 2033
- Figure 28: Asia Pacific Tax Relief Services Revenue (undefined), by Types 2025 & 2033
- Figure 29: Asia Pacific Tax Relief Services Revenue Share (%), by Types 2025 & 2033
- Figure 30: Asia Pacific Tax Relief Services Revenue (undefined), by Country 2025 & 2033
- Figure 31: Asia Pacific Tax Relief Services Revenue Share (%), by Country 2025 & 2033
List of Tables
- Table 1: Global Tax Relief Services Revenue undefined Forecast, by Application 2020 & 2033
- Table 2: Global Tax Relief Services Revenue undefined Forecast, by Types 2020 & 2033
- Table 3: Global Tax Relief Services Revenue undefined Forecast, by Region 2020 & 2033
- Table 4: Global Tax Relief Services Revenue undefined Forecast, by Application 2020 & 2033
- Table 5: Global Tax Relief Services Revenue undefined Forecast, by Types 2020 & 2033
- Table 6: Global Tax Relief Services Revenue undefined Forecast, by Country 2020 & 2033
- Table 7: United States Tax Relief Services Revenue (undefined) Forecast, by Application 2020 & 2033
- Table 8: Canada Tax Relief Services Revenue (undefined) Forecast, by Application 2020 & 2033
- Table 9: Mexico Tax Relief Services Revenue (undefined) Forecast, by Application 2020 & 2033
- Table 10: Global Tax Relief Services Revenue undefined Forecast, by Application 2020 & 2033
- Table 11: Global Tax Relief Services Revenue undefined Forecast, by Types 2020 & 2033
- Table 12: Global Tax Relief Services Revenue undefined Forecast, by Country 2020 & 2033
- Table 13: Brazil Tax Relief Services Revenue (undefined) Forecast, by Application 2020 & 2033
- Table 14: Argentina Tax Relief Services Revenue (undefined) Forecast, by Application 2020 & 2033
- Table 15: Rest of South America Tax Relief Services Revenue (undefined) Forecast, by Application 2020 & 2033
- Table 16: Global Tax Relief Services Revenue undefined Forecast, by Application 2020 & 2033
- Table 17: Global Tax Relief Services Revenue undefined Forecast, by Types 2020 & 2033
- Table 18: Global Tax Relief Services Revenue undefined Forecast, by Country 2020 & 2033
- Table 19: United Kingdom Tax Relief Services Revenue (undefined) Forecast, by Application 2020 & 2033
- Table 20: Germany Tax Relief Services Revenue (undefined) Forecast, by Application 2020 & 2033
- Table 21: France Tax Relief Services Revenue (undefined) Forecast, by Application 2020 & 2033
- Table 22: Italy Tax Relief Services Revenue (undefined) Forecast, by Application 2020 & 2033
- Table 23: Spain Tax Relief Services Revenue (undefined) Forecast, by Application 2020 & 2033
- Table 24: Russia Tax Relief Services Revenue (undefined) Forecast, by Application 2020 & 2033
- Table 25: Benelux Tax Relief Services Revenue (undefined) Forecast, by Application 2020 & 2033
- Table 26: Nordics Tax Relief Services Revenue (undefined) Forecast, by Application 2020 & 2033
- Table 27: Rest of Europe Tax Relief Services Revenue (undefined) Forecast, by Application 2020 & 2033
- Table 28: Global Tax Relief Services Revenue undefined Forecast, by Application 2020 & 2033
- Table 29: Global Tax Relief Services Revenue undefined Forecast, by Types 2020 & 2033
- Table 30: Global Tax Relief Services Revenue undefined Forecast, by Country 2020 & 2033
- Table 31: Turkey Tax Relief Services Revenue (undefined) Forecast, by Application 2020 & 2033
- Table 32: Israel Tax Relief Services Revenue (undefined) Forecast, by Application 2020 & 2033
- Table 33: GCC Tax Relief Services Revenue (undefined) Forecast, by Application 2020 & 2033
- Table 34: North Africa Tax Relief Services Revenue (undefined) Forecast, by Application 2020 & 2033
- Table 35: South Africa Tax Relief Services Revenue (undefined) Forecast, by Application 2020 & 2033
- Table 36: Rest of Middle East & Africa Tax Relief Services Revenue (undefined) Forecast, by Application 2020 & 2033
- Table 37: Global Tax Relief Services Revenue undefined Forecast, by Application 2020 & 2033
- Table 38: Global Tax Relief Services Revenue undefined Forecast, by Types 2020 & 2033
- Table 39: Global Tax Relief Services Revenue undefined Forecast, by Country 2020 & 2033
- Table 40: China Tax Relief Services Revenue (undefined) Forecast, by Application 2020 & 2033
- Table 41: India Tax Relief Services Revenue (undefined) Forecast, by Application 2020 & 2033
- Table 42: Japan Tax Relief Services Revenue (undefined) Forecast, by Application 2020 & 2033
- Table 43: South Korea Tax Relief Services Revenue (undefined) Forecast, by Application 2020 & 2033
- Table 44: ASEAN Tax Relief Services Revenue (undefined) Forecast, by Application 2020 & 2033
- Table 45: Oceania Tax Relief Services Revenue (undefined) Forecast, by Application 2020 & 2033
- Table 46: Rest of Asia Pacific Tax Relief Services Revenue (undefined) Forecast, by Application 2020 & 2033
Frequently Asked Questions
1. What is the projected Compound Annual Growth Rate (CAGR) of the Tax Relief Services?
The projected CAGR is approximately 4.67%.
2. Which companies are prominent players in the Tax Relief Services?
Key companies in the market include OptimaTaxRelief, Community Tax, Anthem Tax, Precision Tax Relief, Fortress Tax Relief, Tax Hardship Center, Tax Rise, Larson Tax Relief, Tax Defense Network, Liberty Tax, Alleviate Tax, DTCC, ALG Tax Solutions, Enterprise Consultants Group, Approved Accounting, Tax Group Center, Creative Tax Reliefs, Blueprint Financial Consulting.
3. What are the main segments of the Tax Relief Services?
The market segments include Application, Types.
4. Can you provide details about the market size?
The market size is estimated to be USD XXX N/A as of 2022.
5. What are some drivers contributing to market growth?
N/A
6. What are the notable trends driving market growth?
N/A
7. Are there any restraints impacting market growth?
N/A
8. Can you provide examples of recent developments in the market?
N/A
9. What pricing options are available for accessing the report?
Pricing options include single-user, multi-user, and enterprise licenses priced at USD 4900.00, USD 7350.00, and USD 9800.00 respectively.
10. Is the market size provided in terms of value or volume?
The market size is provided in terms of value, measured in N/A.
11. Are there any specific market keywords associated with the report?
Yes, the market keyword associated with the report is "Tax Relief Services," which aids in identifying and referencing the specific market segment covered.
12. How do I determine which pricing option suits my needs best?
The pricing options vary based on user requirements and access needs. Individual users may opt for single-user licenses, while businesses requiring broader access may choose multi-user or enterprise licenses for cost-effective access to the report.
13. Are there any additional resources or data provided in the Tax Relief Services report?
While the report offers comprehensive insights, it's advisable to review the specific contents or supplementary materials provided to ascertain if additional resources or data are available.
14. How can I stay updated on further developments or reports in the Tax Relief Services?
To stay informed about further developments, trends, and reports in the Tax Relief Services, consider subscribing to industry newsletters, following relevant companies and organizations, or regularly checking reputable industry news sources and publications.
Methodology
Step 1 - Identification of Relevant Samples Size from Population Database


Step 2 - Approaches for Defining Global Market Size (Value, Volume* & Price*)

Note*: In applicable scenarios
Step 3 - Data Sources
Primary Research
- Web Analytics
- Survey Reports
- Research Institute
- Latest Research Reports
- Opinion Leaders
Secondary Research
- Annual Reports
- White Paper
- Latest Press Release
- Industry Association
- Paid Database
- Investor Presentations

Step 4 - Data Triangulation
Involves using different sources of information in order to increase the validity of a study
These sources are likely to be stakeholders in a program - participants, other researchers, program staff, other community members, and so on.
Then we put all data in single framework & apply various statistical tools to find out the dynamic on the market.
During the analysis stage, feedback from the stakeholder groups would be compared to determine areas of agreement as well as areas of divergence