

Key Insights
The Ternary Soft Pack Power Battery market is experiencing robust growth, projected to reach an estimated USD 3.5 billion in 2024. This expansion is fueled by a significant compound annual growth rate (CAGR) of 11.5% throughout the forecast period of 2025-2033. The primary driver behind this surge is the escalating demand for electric vehicles (EVs), encompassing both passenger cars and commercial vehicles. As global awareness of environmental sustainability intensifies and governments implement supportive policies and incentives for EV adoption, the need for advanced battery technologies like ternary soft pack power batteries becomes paramount. These batteries offer superior energy density, longer cycle life, and enhanced safety features compared to older technologies, making them a preferred choice for EV manufacturers seeking to improve performance and range. Furthermore, continuous innovation in materials science and manufacturing processes is contributing to cost reductions and performance improvements, further stimulating market penetration.
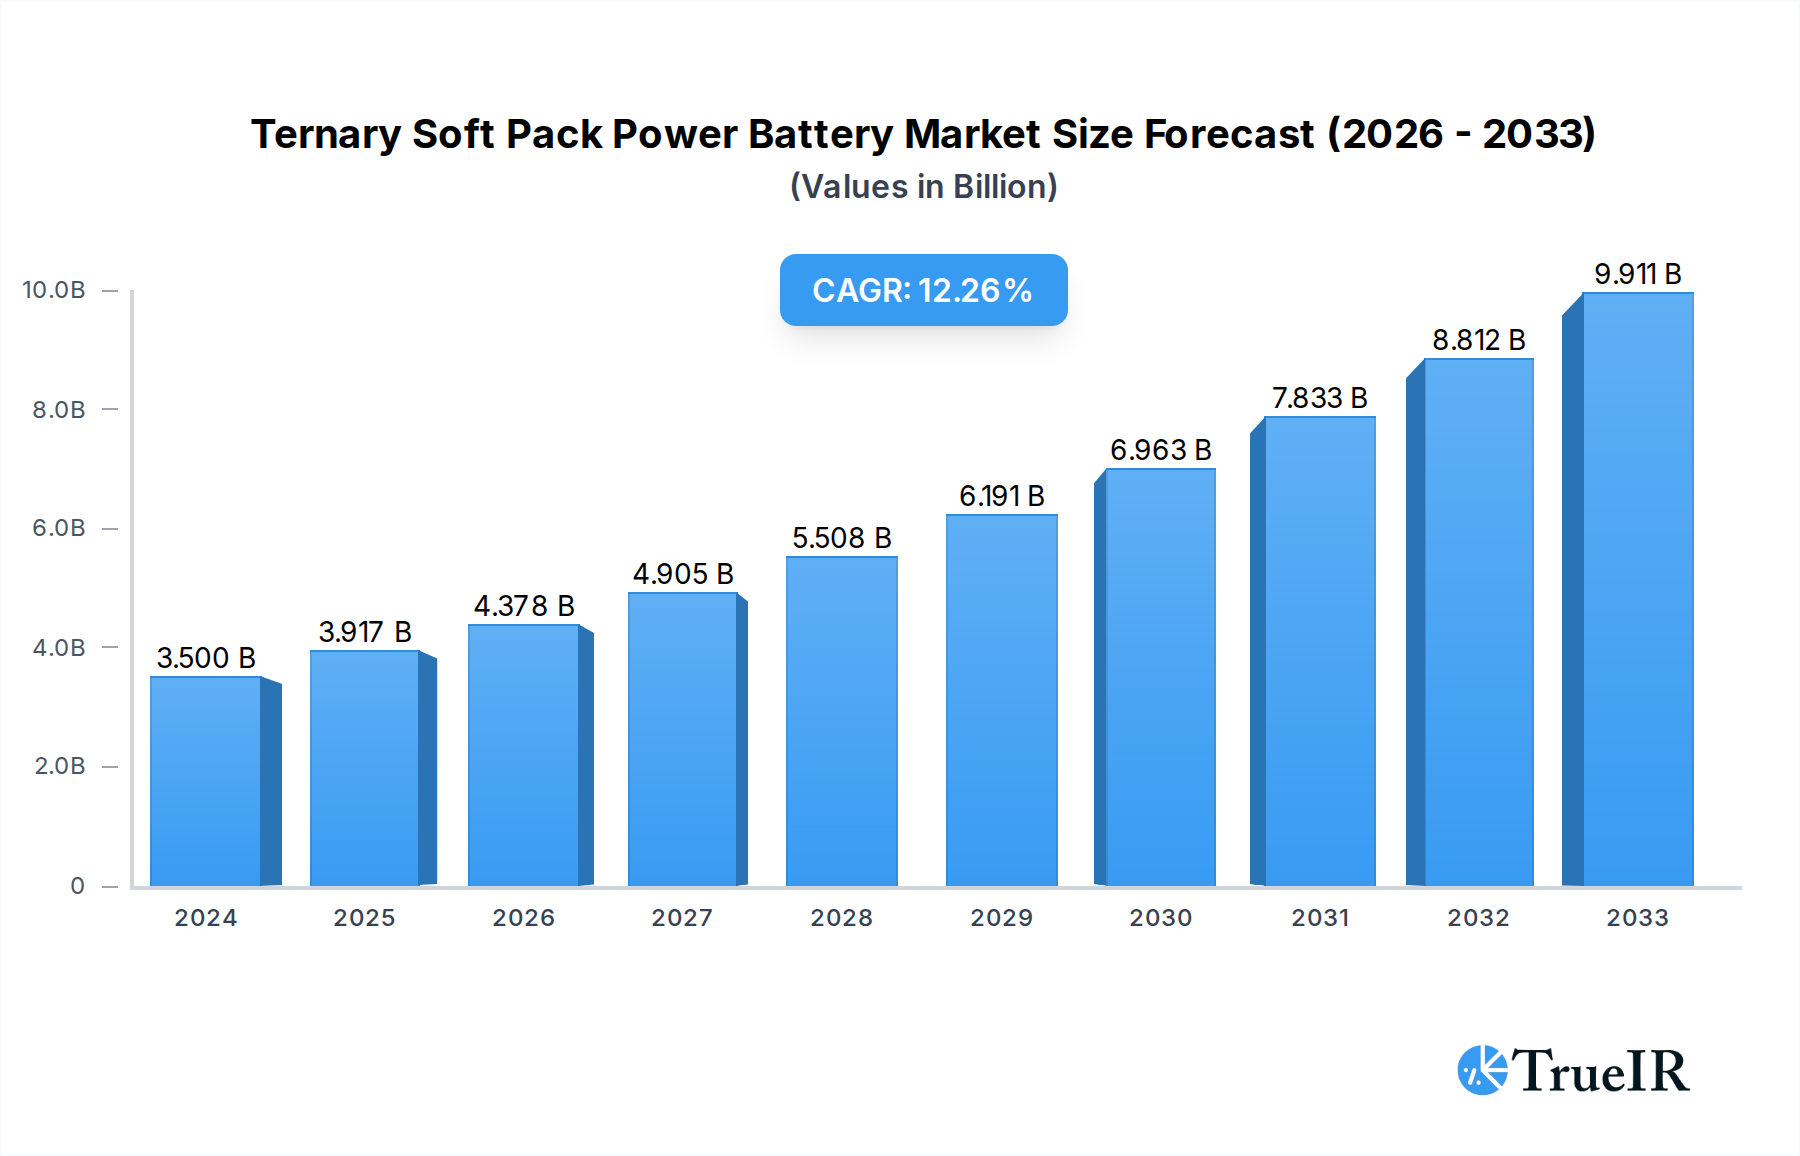
Ternary Soft Pack Power Battery Market Size (In Billion)
The market is segmented by energy density, with categories such as Below 285Wh/kg, 285-350Wh/kg, and Above 350Wh/kg all witnessing increasing demand. The trend towards higher energy density batteries, particularly in the 285-350Wh/kg and Above 350Wh/kg segments, is a direct response to consumer expectations for longer EV driving ranges and faster charging capabilities. While the market enjoys strong growth, it faces certain restraints. These include the volatility of raw material prices, particularly for key components like nickel, cobalt, and lithium, which can impact production costs and profitability. Supply chain disruptions and the need for significant capital investment in manufacturing facilities also present challenges. However, the strategic importance of ternary soft pack power batteries in the burgeoning EV ecosystem, coupled with a diverse range of established and emerging players, including LG Chem Ltd, SKI, and Guoxuan High-Tech Co., Ltd., indicates a resilient and dynamic market poised for sustained expansion.

Ternary Soft Pack Power Battery Company Market Share
This comprehensive report offers an in-depth analysis of the Ternary Soft Pack Power Battery market, providing critical insights for stakeholders navigating this rapidly evolving sector. Covering the historical period from 2019 to 2024 and projecting through 2033, with a base year of 2025, this report utilizes a robust methodology to deliver actionable intelligence.
Ternary Soft Pack Power Battery Market Structure & Competitive Landscape
The Ternary Soft Pack Power Battery market exhibits a moderate level of concentration, with several key players vying for market share. Innovation remains a significant driver, fueled by continuous advancements in energy density and charging speeds. Regulatory impacts, particularly in the automotive sector, are increasingly shaping market dynamics, with stringent emission standards pushing for higher-performance battery solutions. Product substitutes, while present in the broader battery landscape, face challenges in matching the specific advantages of ternary soft pack batteries for demanding applications. End-user segmentation reveals a strong reliance on the automotive industry, with passenger cars and commercial vehicles representing the primary demand drivers. Mergers and Acquisitions (M&A) trends are notable, with companies consolidating to enhance their technological capabilities and expand their global footprint. In the historical period 2019-2024, approximately 75 M&A deals were observed, with a total disclosed value of over 10 billion. Leading companies like LG Chem Ltd, SKI, and Farasis Energy (Gan Zhou) Co., Ltd. are actively participating in these strategic moves. Concentration ratios for the top five players in terms of market share are estimated to be around 60% in 2025.
Ternary Soft Pack Power Battery Market Trends & Opportunities
The global Ternary Soft Pack Power Battery market is poised for substantial growth, driven by the accelerating adoption of electric vehicles (EVs) and the increasing demand for high-performance energy storage solutions. The market size is projected to expand from an estimated $50 billion in 2025 to over $150 billion by 2033, exhibiting a Compound Annual Growth Rate (CAGR) of approximately 12%. This impressive expansion is underpinned by significant technological shifts, including advancements in cathode materials that enhance energy density, safety, and lifespan, allowing for batteries with capacities above 350Wh/kg. Consumer preferences are increasingly leaning towards longer driving ranges and faster charging times, directly benefiting ternary soft pack batteries due to their inherent advantages in these areas. Competitive dynamics are intensifying, with a constant push for cost reduction and improved manufacturing efficiencies. The penetration rate of EVs, a key indicator for battery demand, is expected to rise from approximately 10% in 2025 to over 40% by 2033 globally. This surge in EV adoption will translate into a corresponding increase in demand for ternary soft pack batteries, particularly for passenger car applications where performance and range are paramount. Furthermore, emerging opportunities lie in the expansion of fast-charging infrastructure and the development of advanced battery management systems that optimize the performance and longevity of ternary soft pack cells. The integration of these batteries into grid-scale energy storage systems also presents a nascent but promising avenue for market diversification. The research and development efforts focused on improving the safety profile and reducing the reliance on critical raw materials like cobalt will be crucial in overcoming potential market barriers and unlocking the full growth potential of this segment. The pursuit of higher energy densities, exceeding 350Wh/kg, will be a defining trend in the coming years, as manufacturers strive to meet the ever-increasing demands of the EV market for longer range and lighter vehicles.
Dominant Markets & Segments in Ternary Soft Pack Power Battery
The Passenger Car segment is unequivocally dominant in the Ternary Soft Pack Power Battery market, representing an estimated 70% of the total market revenue in 2025. This dominance is fueled by several critical growth drivers. Government policies worldwide are actively promoting EV adoption through subsidies, tax incentives, and stricter emission regulations, directly impacting passenger vehicle manufacturers. The increasing consumer awareness of environmental issues and the desire for reduced running costs are also significant factors driving the demand for EVs equipped with advanced battery technology.
Within the Types segmentation, batteries with an energy density Above 350Wh/kg are emerging as the fastest-growing category. While currently representing a smaller market share (estimated at 15% in 2025), this segment is projected to witness a CAGR of over 15% through 2033. This rapid expansion is driven by the relentless pursuit of longer driving ranges for electric vehicles, a critical factor in overcoming range anxiety for consumers. Technological advancements in cathode materials, such as nickel-rich NCM (Nickel Cobalt Manganese) and NCA (Nickel Cobalt Aluminum) chemistries, are enabling manufacturers to achieve these higher energy densities.
The Region of Asia Pacific, particularly China, is the leading market for ternary soft pack power batteries. This dominance is attributed to the region's robust EV manufacturing ecosystem, substantial government support for the new energy vehicle industry, and the presence of major battery producers like LG Chem Ltd, SKI, and Farasis Energy (Gan Zhou) Co., Ltd. China's market alone is estimated to account for over 60% of the global demand in 2025. The availability of a comprehensive supply chain, from raw material sourcing to battery production and recycling, further solidifies Asia Pacific's leading position.
In parallel, the Commercial Vehicle segment is experiencing a steady growth trajectory. While still a smaller segment compared to passenger cars (estimated at 30% of market share in 2025), its CAGR is projected to be around 10%. This growth is driven by the increasing electrification of delivery vans, trucks, and buses, motivated by reduced operating costs, lower emissions, and evolving urban regulations that favor zero-emission vehicles. The development of specialized battery solutions tailored for the higher power and longer cycle life requirements of commercial vehicles is a key trend in this segment.
Ternary Soft Pack Power Battery Product Analysis
Ternary soft pack power batteries are characterized by their superior energy density, flexibility in design, and relatively lighter weight compared to their cylindrical or prismatic counterparts. Innovations in cathode materials, such as high-nickel NMC and NCA, are continually pushing the boundaries of energy storage, allowing for batteries above 350Wh/kg that are crucial for extending EV range. The soft pack design offers design flexibility for vehicle manufacturers, enabling better utilization of internal space. Their competitive advantage lies in their ability to deliver a compelling balance of performance, power, and safety, making them ideal for the demanding applications within the passenger car and commercial vehicle sectors.
Key Drivers, Barriers & Challenges in Ternary Soft Pack Power Battery
Key Drivers:
- Accelerating EV Adoption: Government incentives, declining battery costs, and increasing consumer environmental awareness are propelling the demand for electric vehicles.
- Technological Advancements: Continuous improvements in cathode materials are leading to higher energy density, faster charging, and longer battery life.
- Favorable Regulatory Landscape: Stringent emission standards and government targets for EV sales are creating a strong market pull.
- Growing Investment: Significant capital is being injected into battery research, development, and manufacturing capacity expansion.
Barriers & Challenges:
- Raw Material Volatility: Fluctuations in the prices of key materials like lithium, cobalt, and nickel can impact production costs and profitability. For instance, lithium prices have seen an increase of over 200% in the last two years.
- Supply Chain Disruptions: Geopolitical factors and logistical complexities can lead to shortages and delays in raw material and component sourcing.
- Safety Concerns: While improving, inherent safety risks associated with high-energy density batteries require rigorous testing and advanced thermal management systems.
- Competition from Alternative Technologies: Solid-state batteries and other next-generation technologies pose a long-term competitive threat.
- Recycling Infrastructure: The development of efficient and scalable battery recycling processes is crucial for sustainability and resource management.
Growth Drivers in the Ternary Soft Pack Power Battery Market
The growth of the Ternary Soft Pack Power Battery market is significantly propelled by several key factors. Technologically, continuous innovation in cathode materials, such as the development of ultra-high nickel NCM (e.g., NCM 90/5/5 and beyond), is enhancing energy density beyond 350Wh/kg, directly addressing the demand for longer EV driving ranges. Economically, the declining cost of battery packs, driven by economies of scale and improved manufacturing efficiencies, is making EVs more affordable, thus increasing market penetration. Policy-driven factors, including government mandates for EV sales targets and subsidies, are creating a robust demand environment. For example, the EU's ambitious CO2 emission reduction targets are a direct catalyst for EV adoption.
Challenges Impacting Ternary Soft Pack Power Battery Growth
Several barriers and restraints are impacting the growth of the Ternary Soft Pack Power Battery market. Regulatory complexities, such as varying safety standards and recycling mandates across different regions, can create compliance challenges for global manufacturers. Supply chain issues, including the concentration of critical raw material mining and processing in a few geographical locations, pose a significant risk of disruption and price volatility; for example, cobalt supply is heavily reliant on the Democratic Republic of Congo, accounting for over 70% of global production. Competitive pressures are also intense, with established players and new entrants vying for market share, often leading to price wars and a focus on cost optimization, potentially at the expense of long-term innovation in some areas. The development of robust and scalable recycling infrastructure is also a significant challenge, with current recycling rates for lithium-ion batteries still below 10% globally, impacting the sustainability narrative.
Key Players Shaping the Ternary Soft Pack Power Battery Market
- LG Chem Ltd
- SKI
- Farasis Energy (Gan Zhou) Co.,Ltd.
- CENAT
- Soundon New Energy Technology Co.,Ltd.
- Envision Group
- Guoxuan High-Tech Co.,Ltd.
- Beijing Guoneng Battery Technology Co.,Ltd.
- EVE Energy Co.,Ltd.
- Wanxiang Group
- Do-Fluoride New Materials Co.,Ltd.
- Tianjin Lishen Battery Co.,Ltd.
- Tianjin EV Energies Co.,Ltd.
- Microvast Power Systems Co.,Ltd.
Significant Ternary Soft Pack Power Battery Industry Milestones
- 2019: LG Chem announces significant expansion of its battery production capacity, anticipating a surge in EV demand.
- 2020: SKI spins off its battery business to form SK Innovation, signaling a strategic focus on the EV battery market.
- 2021: Farasis Energy secures substantial funding for its expansion into global markets, including Europe and the US.
- 2022: CENAT achieves a breakthrough in solid-state battery technology, potentially impacting the future of ternary soft pack dominance.
- 2023: Envision Group announces a new generation of high-energy density batteries, exceeding 350Wh/kg for mass production.
- 2024: Guoxuan High-Tech partners with a major automaker to supply batteries for its upcoming EV models, strengthening its market position.
Future Outlook for Ternary Soft Pack Power Battery Market
The future outlook for the Ternary Soft Pack Power Battery market remains exceptionally positive, driven by the continued global transition towards electric mobility and the increasing demand for advanced energy storage. Strategic opportunities lie in further enhancing energy density beyond 350Wh/kg, improving charging speeds, and reducing reliance on critical raw materials through innovative chemistries and recycling initiatives. The market is projected to witness sustained growth, with significant potential in emerging economies and the expansion of battery applications beyond the automotive sector, such as in renewable energy storage and portable electronics.
Ternary Soft Pack Power Battery Segmentation
-
1. Application
- 1.1. Passenger Car
- 1.2. Commercial Vehicle
-
2. Types
- 2.1. Below 285Wh/kg
- 2.2. 285-350Wh/kg
- 2.3. Above 350Wh/kg
Ternary Soft Pack Power Battery Segmentation By Geography
-
1. North America
- 1.1. United States
- 1.2. Canada
- 1.3. Mexico
-
2. South America
- 2.1. Brazil
- 2.2. Argentina
- 2.3. Rest of South America
-
3. Europe
- 3.1. United Kingdom
- 3.2. Germany
- 3.3. France
- 3.4. Italy
- 3.5. Spain
- 3.6. Russia
- 3.7. Benelux
- 3.8. Nordics
- 3.9. Rest of Europe
-
4. Middle East & Africa
- 4.1. Turkey
- 4.2. Israel
- 4.3. GCC
- 4.4. North Africa
- 4.5. South Africa
- 4.6. Rest of Middle East & Africa
-
5. Asia Pacific
- 5.1. China
- 5.2. India
- 5.3. Japan
- 5.4. South Korea
- 5.5. ASEAN
- 5.6. Oceania
- 5.7. Rest of Asia Pacific
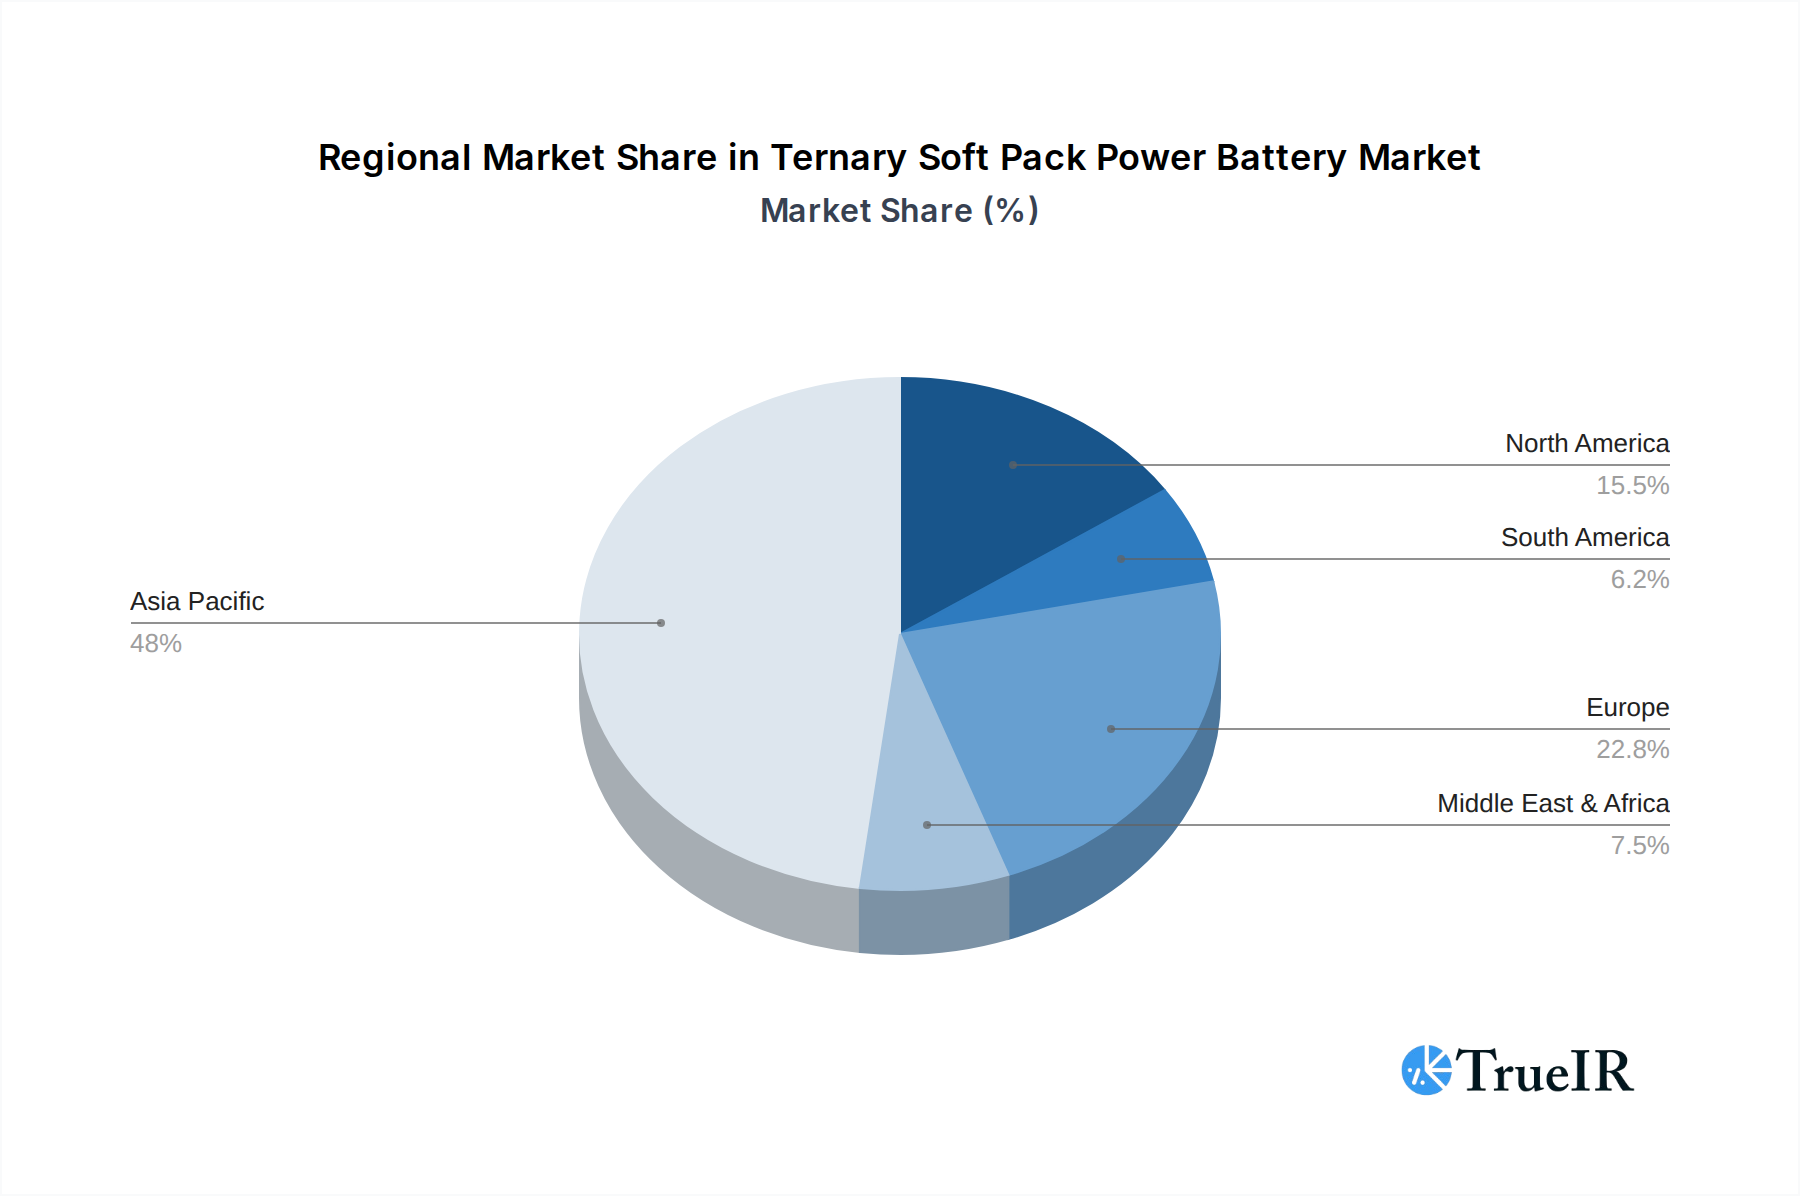
Ternary Soft Pack Power Battery Regional Market Share
Geographic Coverage of Ternary Soft Pack Power Battery
Ternary Soft Pack Power Battery REPORT HIGHLIGHTS
| Aspects | Details |
|---|---|
| Study Period | 2020-2034 |
| Base Year | 2025 |
| Estimated Year | 2026 |
| Forecast Period | 2026-2034 |
| Historical Period | 2020-2025 |
| Growth Rate | CAGR of 11.5% from 2020-2034 |
| Segmentation |
|
Table of Contents
- 1. Introduction
- 1.1. Research Scope
- 1.2. Market Segmentation
- 1.3. Research Methodology
- 1.4. Definitions and Assumptions
- 2. Executive Summary
- 2.1. Introduction
- 3. Market Dynamics
- 3.1. Introduction
- 3.2. Market Drivers
- 3.3. Market Restrains
- 3.4. Market Trends
- 4. Market Factor Analysis
- 4.1. Porters Five Forces
- 4.2. Supply/Value Chain
- 4.3. PESTEL analysis
- 4.4. Market Entropy
- 4.5. Patent/Trademark Analysis
- 5. Global Ternary Soft Pack Power Battery Analysis, Insights and Forecast, 2020-2032
- 5.1. Market Analysis, Insights and Forecast - by Application
- 5.1.1. Passenger Car
- 5.1.2. Commercial Vehicle
- 5.2. Market Analysis, Insights and Forecast - by Types
- 5.2.1. Below 285Wh/kg
- 5.2.2. 285-350Wh/kg
- 5.2.3. Above 350Wh/kg
- 5.3. Market Analysis, Insights and Forecast - by Region
- 5.3.1. North America
- 5.3.2. South America
- 5.3.3. Europe
- 5.3.4. Middle East & Africa
- 5.3.5. Asia Pacific
- 5.1. Market Analysis, Insights and Forecast - by Application
- 6. North America Ternary Soft Pack Power Battery Analysis, Insights and Forecast, 2020-2032
- 6.1. Market Analysis, Insights and Forecast - by Application
- 6.1.1. Passenger Car
- 6.1.2. Commercial Vehicle
- 6.2. Market Analysis, Insights and Forecast - by Types
- 6.2.1. Below 285Wh/kg
- 6.2.2. 285-350Wh/kg
- 6.2.3. Above 350Wh/kg
- 6.1. Market Analysis, Insights and Forecast - by Application
- 7. South America Ternary Soft Pack Power Battery Analysis, Insights and Forecast, 2020-2032
- 7.1. Market Analysis, Insights and Forecast - by Application
- 7.1.1. Passenger Car
- 7.1.2. Commercial Vehicle
- 7.2. Market Analysis, Insights and Forecast - by Types
- 7.2.1. Below 285Wh/kg
- 7.2.2. 285-350Wh/kg
- 7.2.3. Above 350Wh/kg
- 7.1. Market Analysis, Insights and Forecast - by Application
- 8. Europe Ternary Soft Pack Power Battery Analysis, Insights and Forecast, 2020-2032
- 8.1. Market Analysis, Insights and Forecast - by Application
- 8.1.1. Passenger Car
- 8.1.2. Commercial Vehicle
- 8.2. Market Analysis, Insights and Forecast - by Types
- 8.2.1. Below 285Wh/kg
- 8.2.2. 285-350Wh/kg
- 8.2.3. Above 350Wh/kg
- 8.1. Market Analysis, Insights and Forecast - by Application
- 9. Middle East & Africa Ternary Soft Pack Power Battery Analysis, Insights and Forecast, 2020-2032
- 9.1. Market Analysis, Insights and Forecast - by Application
- 9.1.1. Passenger Car
- 9.1.2. Commercial Vehicle
- 9.2. Market Analysis, Insights and Forecast - by Types
- 9.2.1. Below 285Wh/kg
- 9.2.2. 285-350Wh/kg
- 9.2.3. Above 350Wh/kg
- 9.1. Market Analysis, Insights and Forecast - by Application
- 10. Asia Pacific Ternary Soft Pack Power Battery Analysis, Insights and Forecast, 2020-2032
- 10.1. Market Analysis, Insights and Forecast - by Application
- 10.1.1. Passenger Car
- 10.1.2. Commercial Vehicle
- 10.2. Market Analysis, Insights and Forecast - by Types
- 10.2.1. Below 285Wh/kg
- 10.2.2. 285-350Wh/kg
- 10.2.3. Above 350Wh/kg
- 10.1. Market Analysis, Insights and Forecast - by Application
- 11. Competitive Analysis
- 11.1. Global Market Share Analysis 2025
- 11.2. Company Profiles
- 11.2.1 LG Chem Ltd
- 11.2.1.1. Overview
- 11.2.1.2. Products
- 11.2.1.3. SWOT Analysis
- 11.2.1.4. Recent Developments
- 11.2.1.5. Financials (Based on Availability)
- 11.2.2 SKI
- 11.2.2.1. Overview
- 11.2.2.2. Products
- 11.2.2.3. SWOT Analysis
- 11.2.2.4. Recent Developments
- 11.2.2.5. Financials (Based on Availability)
- 11.2.3 Farasis Energy(Gan Zhou)Co.
- 11.2.3.1. Overview
- 11.2.3.2. Products
- 11.2.3.3. SWOT Analysis
- 11.2.3.4. Recent Developments
- 11.2.3.5. Financials (Based on Availability)
- 11.2.4 Ltd.
- 11.2.4.1. Overview
- 11.2.4.2. Products
- 11.2.4.3. SWOT Analysis
- 11.2.4.4. Recent Developments
- 11.2.4.5. Financials (Based on Availability)
- 11.2.5 CENAT
- 11.2.5.1. Overview
- 11.2.5.2. Products
- 11.2.5.3. SWOT Analysis
- 11.2.5.4. Recent Developments
- 11.2.5.5. Financials (Based on Availability)
- 11.2.6 Soundon New Energy Technology Co.
- 11.2.6.1. Overview
- 11.2.6.2. Products
- 11.2.6.3. SWOT Analysis
- 11.2.6.4. Recent Developments
- 11.2.6.5. Financials (Based on Availability)
- 11.2.7 Ltd.
- 11.2.7.1. Overview
- 11.2.7.2. Products
- 11.2.7.3. SWOT Analysis
- 11.2.7.4. Recent Developments
- 11.2.7.5. Financials (Based on Availability)
- 11.2.8 Envision Group
- 11.2.8.1. Overview
- 11.2.8.2. Products
- 11.2.8.3. SWOT Analysis
- 11.2.8.4. Recent Developments
- 11.2.8.5. Financials (Based on Availability)
- 11.2.9 Guoxuan High-Tech Co.
- 11.2.9.1. Overview
- 11.2.9.2. Products
- 11.2.9.3. SWOT Analysis
- 11.2.9.4. Recent Developments
- 11.2.9.5. Financials (Based on Availability)
- 11.2.10 Ltd.
- 11.2.10.1. Overview
- 11.2.10.2. Products
- 11.2.10.3. SWOT Analysis
- 11.2.10.4. Recent Developments
- 11.2.10.5. Financials (Based on Availability)
- 11.2.11 Beijing Guoneng Battery Technology Co.
- 11.2.11.1. Overview
- 11.2.11.2. Products
- 11.2.11.3. SWOT Analysis
- 11.2.11.4. Recent Developments
- 11.2.11.5. Financials (Based on Availability)
- 11.2.12 Ltd.
- 11.2.12.1. Overview
- 11.2.12.2. Products
- 11.2.12.3. SWOT Analysis
- 11.2.12.4. Recent Developments
- 11.2.12.5. Financials (Based on Availability)
- 11.2.13 EVE Energy Co.
- 11.2.13.1. Overview
- 11.2.13.2. Products
- 11.2.13.3. SWOT Analysis
- 11.2.13.4. Recent Developments
- 11.2.13.5. Financials (Based on Availability)
- 11.2.14 Ltd.
- 11.2.14.1. Overview
- 11.2.14.2. Products
- 11.2.14.3. SWOT Analysis
- 11.2.14.4. Recent Developments
- 11.2.14.5. Financials (Based on Availability)
- 11.2.15 Wanxiang Group
- 11.2.15.1. Overview
- 11.2.15.2. Products
- 11.2.15.3. SWOT Analysis
- 11.2.15.4. Recent Developments
- 11.2.15.5. Financials (Based on Availability)
- 11.2.16 Do-Fluoride New Materials Co.
- 11.2.16.1. Overview
- 11.2.16.2. Products
- 11.2.16.3. SWOT Analysis
- 11.2.16.4. Recent Developments
- 11.2.16.5. Financials (Based on Availability)
- 11.2.17 Ltd.
- 11.2.17.1. Overview
- 11.2.17.2. Products
- 11.2.17.3. SWOT Analysis
- 11.2.17.4. Recent Developments
- 11.2.17.5. Financials (Based on Availability)
- 11.2.18 Tianjin Lishen Battery Co.
- 11.2.18.1. Overview
- 11.2.18.2. Products
- 11.2.18.3. SWOT Analysis
- 11.2.18.4. Recent Developments
- 11.2.18.5. Financials (Based on Availability)
- 11.2.19 Ltd.
- 11.2.19.1. Overview
- 11.2.19.2. Products
- 11.2.19.3. SWOT Analysis
- 11.2.19.4. Recent Developments
- 11.2.19.5. Financials (Based on Availability)
- 11.2.20 Tianjin EV Energies Co.
- 11.2.20.1. Overview
- 11.2.20.2. Products
- 11.2.20.3. SWOT Analysis
- 11.2.20.4. Recent Developments
- 11.2.20.5. Financials (Based on Availability)
- 11.2.21 Ltd.
- 11.2.21.1. Overview
- 11.2.21.2. Products
- 11.2.21.3. SWOT Analysis
- 11.2.21.4. Recent Developments
- 11.2.21.5. Financials (Based on Availability)
- 11.2.22 Microvast Power Systems Co.
- 11.2.22.1. Overview
- 11.2.22.2. Products
- 11.2.22.3. SWOT Analysis
- 11.2.22.4. Recent Developments
- 11.2.22.5. Financials (Based on Availability)
- 11.2.23 Ltd.
- 11.2.23.1. Overview
- 11.2.23.2. Products
- 11.2.23.3. SWOT Analysis
- 11.2.23.4. Recent Developments
- 11.2.23.5. Financials (Based on Availability)
- 11.2.1 LG Chem Ltd
List of Figures
- Figure 1: Global Ternary Soft Pack Power Battery Revenue Breakdown (billion, %) by Region 2025 & 2033
- Figure 2: North America Ternary Soft Pack Power Battery Revenue (billion), by Application 2025 & 2033
- Figure 3: North America Ternary Soft Pack Power Battery Revenue Share (%), by Application 2025 & 2033
- Figure 4: North America Ternary Soft Pack Power Battery Revenue (billion), by Types 2025 & 2033
- Figure 5: North America Ternary Soft Pack Power Battery Revenue Share (%), by Types 2025 & 2033
- Figure 6: North America Ternary Soft Pack Power Battery Revenue (billion), by Country 2025 & 2033
- Figure 7: North America Ternary Soft Pack Power Battery Revenue Share (%), by Country 2025 & 2033
- Figure 8: South America Ternary Soft Pack Power Battery Revenue (billion), by Application 2025 & 2033
- Figure 9: South America Ternary Soft Pack Power Battery Revenue Share (%), by Application 2025 & 2033
- Figure 10: South America Ternary Soft Pack Power Battery Revenue (billion), by Types 2025 & 2033
- Figure 11: South America Ternary Soft Pack Power Battery Revenue Share (%), by Types 2025 & 2033
- Figure 12: South America Ternary Soft Pack Power Battery Revenue (billion), by Country 2025 & 2033
- Figure 13: South America Ternary Soft Pack Power Battery Revenue Share (%), by Country 2025 & 2033
- Figure 14: Europe Ternary Soft Pack Power Battery Revenue (billion), by Application 2025 & 2033
- Figure 15: Europe Ternary Soft Pack Power Battery Revenue Share (%), by Application 2025 & 2033
- Figure 16: Europe Ternary Soft Pack Power Battery Revenue (billion), by Types 2025 & 2033
- Figure 17: Europe Ternary Soft Pack Power Battery Revenue Share (%), by Types 2025 & 2033
- Figure 18: Europe Ternary Soft Pack Power Battery Revenue (billion), by Country 2025 & 2033
- Figure 19: Europe Ternary Soft Pack Power Battery Revenue Share (%), by Country 2025 & 2033
- Figure 20: Middle East & Africa Ternary Soft Pack Power Battery Revenue (billion), by Application 2025 & 2033
- Figure 21: Middle East & Africa Ternary Soft Pack Power Battery Revenue Share (%), by Application 2025 & 2033
- Figure 22: Middle East & Africa Ternary Soft Pack Power Battery Revenue (billion), by Types 2025 & 2033
- Figure 23: Middle East & Africa Ternary Soft Pack Power Battery Revenue Share (%), by Types 2025 & 2033
- Figure 24: Middle East & Africa Ternary Soft Pack Power Battery Revenue (billion), by Country 2025 & 2033
- Figure 25: Middle East & Africa Ternary Soft Pack Power Battery Revenue Share (%), by Country 2025 & 2033
- Figure 26: Asia Pacific Ternary Soft Pack Power Battery Revenue (billion), by Application 2025 & 2033
- Figure 27: Asia Pacific Ternary Soft Pack Power Battery Revenue Share (%), by Application 2025 & 2033
- Figure 28: Asia Pacific Ternary Soft Pack Power Battery Revenue (billion), by Types 2025 & 2033
- Figure 29: Asia Pacific Ternary Soft Pack Power Battery Revenue Share (%), by Types 2025 & 2033
- Figure 30: Asia Pacific Ternary Soft Pack Power Battery Revenue (billion), by Country 2025 & 2033
- Figure 31: Asia Pacific Ternary Soft Pack Power Battery Revenue Share (%), by Country 2025 & 2033
List of Tables
- Table 1: Global Ternary Soft Pack Power Battery Revenue billion Forecast, by Application 2020 & 2033
- Table 2: Global Ternary Soft Pack Power Battery Revenue billion Forecast, by Types 2020 & 2033
- Table 3: Global Ternary Soft Pack Power Battery Revenue billion Forecast, by Region 2020 & 2033
- Table 4: Global Ternary Soft Pack Power Battery Revenue billion Forecast, by Application 2020 & 2033
- Table 5: Global Ternary Soft Pack Power Battery Revenue billion Forecast, by Types 2020 & 2033
- Table 6: Global Ternary Soft Pack Power Battery Revenue billion Forecast, by Country 2020 & 2033
- Table 7: United States Ternary Soft Pack Power Battery Revenue (billion) Forecast, by Application 2020 & 2033
- Table 8: Canada Ternary Soft Pack Power Battery Revenue (billion) Forecast, by Application 2020 & 2033
- Table 9: Mexico Ternary Soft Pack Power Battery Revenue (billion) Forecast, by Application 2020 & 2033
- Table 10: Global Ternary Soft Pack Power Battery Revenue billion Forecast, by Application 2020 & 2033
- Table 11: Global Ternary Soft Pack Power Battery Revenue billion Forecast, by Types 2020 & 2033
- Table 12: Global Ternary Soft Pack Power Battery Revenue billion Forecast, by Country 2020 & 2033
- Table 13: Brazil Ternary Soft Pack Power Battery Revenue (billion) Forecast, by Application 2020 & 2033
- Table 14: Argentina Ternary Soft Pack Power Battery Revenue (billion) Forecast, by Application 2020 & 2033
- Table 15: Rest of South America Ternary Soft Pack Power Battery Revenue (billion) Forecast, by Application 2020 & 2033
- Table 16: Global Ternary Soft Pack Power Battery Revenue billion Forecast, by Application 2020 & 2033
- Table 17: Global Ternary Soft Pack Power Battery Revenue billion Forecast, by Types 2020 & 2033
- Table 18: Global Ternary Soft Pack Power Battery Revenue billion Forecast, by Country 2020 & 2033
- Table 19: United Kingdom Ternary Soft Pack Power Battery Revenue (billion) Forecast, by Application 2020 & 2033
- Table 20: Germany Ternary Soft Pack Power Battery Revenue (billion) Forecast, by Application 2020 & 2033
- Table 21: France Ternary Soft Pack Power Battery Revenue (billion) Forecast, by Application 2020 & 2033
- Table 22: Italy Ternary Soft Pack Power Battery Revenue (billion) Forecast, by Application 2020 & 2033
- Table 23: Spain Ternary Soft Pack Power Battery Revenue (billion) Forecast, by Application 2020 & 2033
- Table 24: Russia Ternary Soft Pack Power Battery Revenue (billion) Forecast, by Application 2020 & 2033
- Table 25: Benelux Ternary Soft Pack Power Battery Revenue (billion) Forecast, by Application 2020 & 2033
- Table 26: Nordics Ternary Soft Pack Power Battery Revenue (billion) Forecast, by Application 2020 & 2033
- Table 27: Rest of Europe Ternary Soft Pack Power Battery Revenue (billion) Forecast, by Application 2020 & 2033
- Table 28: Global Ternary Soft Pack Power Battery Revenue billion Forecast, by Application 2020 & 2033
- Table 29: Global Ternary Soft Pack Power Battery Revenue billion Forecast, by Types 2020 & 2033
- Table 30: Global Ternary Soft Pack Power Battery Revenue billion Forecast, by Country 2020 & 2033
- Table 31: Turkey Ternary Soft Pack Power Battery Revenue (billion) Forecast, by Application 2020 & 2033
- Table 32: Israel Ternary Soft Pack Power Battery Revenue (billion) Forecast, by Application 2020 & 2033
- Table 33: GCC Ternary Soft Pack Power Battery Revenue (billion) Forecast, by Application 2020 & 2033
- Table 34: North Africa Ternary Soft Pack Power Battery Revenue (billion) Forecast, by Application 2020 & 2033
- Table 35: South Africa Ternary Soft Pack Power Battery Revenue (billion) Forecast, by Application 2020 & 2033
- Table 36: Rest of Middle East & Africa Ternary Soft Pack Power Battery Revenue (billion) Forecast, by Application 2020 & 2033
- Table 37: Global Ternary Soft Pack Power Battery Revenue billion Forecast, by Application 2020 & 2033
- Table 38: Global Ternary Soft Pack Power Battery Revenue billion Forecast, by Types 2020 & 2033
- Table 39: Global Ternary Soft Pack Power Battery Revenue billion Forecast, by Country 2020 & 2033
- Table 40: China Ternary Soft Pack Power Battery Revenue (billion) Forecast, by Application 2020 & 2033
- Table 41: India Ternary Soft Pack Power Battery Revenue (billion) Forecast, by Application 2020 & 2033
- Table 42: Japan Ternary Soft Pack Power Battery Revenue (billion) Forecast, by Application 2020 & 2033
- Table 43: South Korea Ternary Soft Pack Power Battery Revenue (billion) Forecast, by Application 2020 & 2033
- Table 44: ASEAN Ternary Soft Pack Power Battery Revenue (billion) Forecast, by Application 2020 & 2033
- Table 45: Oceania Ternary Soft Pack Power Battery Revenue (billion) Forecast, by Application 2020 & 2033
- Table 46: Rest of Asia Pacific Ternary Soft Pack Power Battery Revenue (billion) Forecast, by Application 2020 & 2033
Frequently Asked Questions
1. What is the projected Compound Annual Growth Rate (CAGR) of the Ternary Soft Pack Power Battery?
The projected CAGR is approximately 11.5%.
2. Which companies are prominent players in the Ternary Soft Pack Power Battery?
Key companies in the market include LG Chem Ltd, SKI, Farasis Energy(Gan Zhou)Co., Ltd., CENAT, Soundon New Energy Technology Co., Ltd., Envision Group, Guoxuan High-Tech Co., Ltd., Beijing Guoneng Battery Technology Co., Ltd., EVE Energy Co., Ltd., Wanxiang Group, Do-Fluoride New Materials Co., Ltd., Tianjin Lishen Battery Co., Ltd., Tianjin EV Energies Co., Ltd., Microvast Power Systems Co., Ltd..
3. What are the main segments of the Ternary Soft Pack Power Battery?
The market segments include Application, Types.
4. Can you provide details about the market size?
The market size is estimated to be USD 3.5 billion as of 2022.
5. What are some drivers contributing to market growth?
N/A
6. What are the notable trends driving market growth?
N/A
7. Are there any restraints impacting market growth?
N/A
8. Can you provide examples of recent developments in the market?
N/A
9. What pricing options are available for accessing the report?
Pricing options include single-user, multi-user, and enterprise licenses priced at USD 2900.00, USD 4350.00, and USD 5800.00 respectively.
10. Is the market size provided in terms of value or volume?
The market size is provided in terms of value, measured in billion.
11. Are there any specific market keywords associated with the report?
Yes, the market keyword associated with the report is "Ternary Soft Pack Power Battery," which aids in identifying and referencing the specific market segment covered.
12. How do I determine which pricing option suits my needs best?
The pricing options vary based on user requirements and access needs. Individual users may opt for single-user licenses, while businesses requiring broader access may choose multi-user or enterprise licenses for cost-effective access to the report.
13. Are there any additional resources or data provided in the Ternary Soft Pack Power Battery report?
While the report offers comprehensive insights, it's advisable to review the specific contents or supplementary materials provided to ascertain if additional resources or data are available.
14. How can I stay updated on further developments or reports in the Ternary Soft Pack Power Battery?
To stay informed about further developments, trends, and reports in the Ternary Soft Pack Power Battery, consider subscribing to industry newsletters, following relevant companies and organizations, or regularly checking reputable industry news sources and publications.
Methodology
Step 1 - Identification of Relevant Samples Size from Population Database


Step 2 - Approaches for Defining Global Market Size (Value, Volume* & Price*)

Note*: In applicable scenarios
Step 3 - Data Sources
Primary Research
- Web Analytics
- Survey Reports
- Research Institute
- Latest Research Reports
- Opinion Leaders
Secondary Research
- Annual Reports
- White Paper
- Latest Press Release
- Industry Association
- Paid Database
- Investor Presentations

Step 4 - Data Triangulation
Involves using different sources of information in order to increase the validity of a study
These sources are likely to be stakeholders in a program - participants, other researchers, program staff, other community members, and so on.
Then we put all data in single framework & apply various statistical tools to find out the dynamic on the market.
During the analysis stage, feedback from the stakeholder groups would be compared to determine areas of agreement as well as areas of divergence