


Key Insights
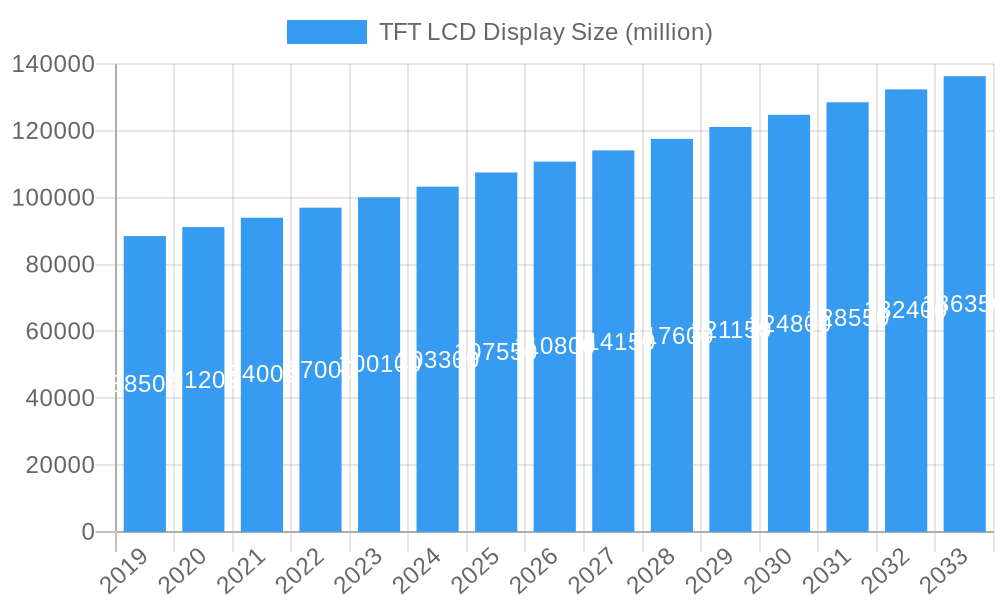
The global TFT LCD display market is poised for robust growth, projected to reach an estimated $107,550 million by 2025, expanding at a healthy Compound Annual Growth Rate (CAGR) of 3.1% through 2033. This expansion is fueled by the relentless demand for advanced display technologies across a multitude of applications. Consumer electronics, including smartphones, tablets, and televisions, continue to be the primary volume drivers, benefiting from ongoing innovation in screen resolution, refresh rates, and energy efficiency. The automotive sector is a significant growth catalyst, with TFT LCDs becoming indispensable for infotainment systems, digital dashboards, and advanced driver-assistance systems (ADAS) that enhance user experience and safety. Furthermore, the aerospace & defense and medical industries are increasingly integrating these sophisticated displays for their reliability, clarity, and ability to present complex data effectively. The diversity of display types available, from the widely adopted In-Plane Switching (IPS) for superior color accuracy and viewing angles to Multi-Domain Vertical Alignment (MVA) and Advanced Fringe Field Switching (AFFS) for enhanced contrast and brightness, ensures that the market can cater to the specific requirements of each application segment. Leading players such as AU Optronics, Innolux, LG Display, and Samsung Display are continuously investing in research and development to push the boundaries of TFT LCD technology, focusing on enhanced performance, reduced power consumption, and more sustainable manufacturing processes.
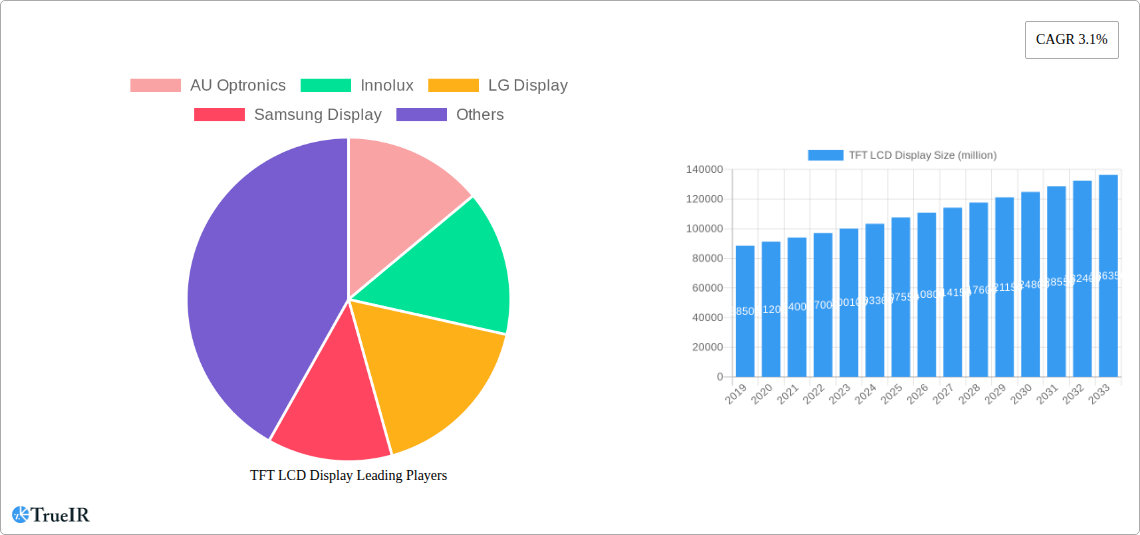
TFT LCD Display Market Size (In Billion)

The market's trajectory will be shaped by a confluence of evolving trends and strategic initiatives. Advancements in display materials and manufacturing techniques are expected to lead to thinner, lighter, and more energy-efficient TFT LCD panels, further solidifying their position against emerging display technologies. The increasing adoption of flexible and transparent TFT LCDs will unlock new design possibilities and use cases, particularly in smart signage, wearable devices, and novel automotive interiors. While the market exhibits strong growth, certain challenges remain. The intense price competition, especially in the consumer electronics segment, necessitates continuous cost optimization and innovation from manufacturers. Supply chain disruptions, geopolitical factors, and the rising cost of raw materials can also impact production and pricing. However, the inherent cost-effectiveness and established manufacturing infrastructure of TFT LCD technology provide a strong competitive advantage. The Asia Pacific region, led by China and South Korea, is expected to maintain its dominance in both production and consumption, owing to a robust manufacturing ecosystem and a burgeoning demand for electronic devices. North America and Europe are also significant markets, driven by high disposable incomes and the adoption of advanced technologies in automotive and medical applications.
TFT LCD Display Company Market Share
This comprehensive report delves into the dynamic TFT LCD display market, analyzing its structure, competitive landscape, prevailing trends, and future trajectory. The study spans from 2019 to 2033, with 2025 serving as the base and estimated year, and a detailed forecast period from 2025 to 2033.
TFT LCD Display Market Structure & Competitive Landscape
The TFT LCD display market is characterized by a moderate to high concentration, with key players like Samsung Display, LG Display, AU Optronics, and Innolux dominating a significant share. Innovation drivers are primarily focused on enhancing display performance metrics such as resolution, refresh rates, color accuracy, and power efficiency, driven by the insatiable demand for more immersive and visually appealing electronic devices. Regulatory impacts, though less pronounced than in some other tech sectors, are emerging around e-waste management and material sourcing, influencing manufacturing processes and product lifecycles. Product substitutes, while present, such as OLED and emerging microLED technologies, are yet to fully displace TFT LCDs across all price points and applications due to cost-effectiveness and established manufacturing infrastructure. End-user segmentation reveals a robust demand across Consumer Electronics, Automotive, Medical, and burgeoning applications in Aerospace & Defense. Mergers and Acquisitions (M&A) trends are relatively moderate, with companies often focusing on strategic partnerships and joint ventures to share R&D costs and gain access to specialized technologies rather than outright acquisitions. The concentration ratio for the top four players is estimated to be around 65%, indicating a consolidated yet competitive environment. M&A volumes have averaged approximately 5-10 significant deals annually over the historical period (2019-2024).
TFT LCD Display Market Trends & Opportunities
The global TFT LCD display market is poised for sustained growth, projected to witness a Compound Annual Growth Rate (CAGR) of approximately 4.5% over the forecast period (2025–2033). The market size, estimated at over 100 million units in 2025, is driven by an ever-increasing demand for advanced display technologies across a multitude of applications. Technological shifts are at the forefront of this expansion, with continuous advancements in pixel density, brightness, contrast ratios, and the integration of features like higher refresh rates for smoother visuals in gaming and video content. The adoption of mini-LED and quantum dot technologies within LCD backlights is further enhancing color gamut and contrast, bridging the gap with emissive display technologies. Consumer preferences are increasingly leaning towards larger screen sizes, higher resolutions (4K and 8K), and energy-efficient displays, particularly in the smartphone, tablet, and television segments. The automotive sector is witnessing a significant surge in demand for integrated display solutions for infotainment systems, digital cockpits, and heads-up displays, driving innovation in ruggedized and high-performance TFT LCDs. The medical industry's need for precise and clear imaging displays in diagnostic equipment and patient monitoring devices also represents a substantial opportunity. Competitive dynamics are intense, with manufacturers constantly striving for cost leadership through economies of scale and process optimization, while also differentiating through specialized product offerings and technological prowess. The market penetration of advanced TFT LCDs in emerging economies is expected to accelerate, fueled by increasing disposable incomes and the widespread adoption of consumer electronics. Opportunities also lie in the development of flexible and transparent TFT LCDs for novel applications in smart signage, wearable technology, and augmented reality devices. The ongoing evolution of display manufacturing processes, including improved encapsulation techniques and advanced driver ICs, will continue to shape the competitive landscape and unlock new market segments.
Dominant Markets & Segments in TFT LCD Display
The Consumer Electronics segment stands as the undisputed dominant market within the TFT LCD display industry, accounting for an estimated 55% of the total market revenue in 2025. Within this segment, smartphones, televisions, laptops, and tablets are the primary growth drivers. The sheer volume of production and the continuous demand for upgrades in these product categories make it the bedrock of the TFT LCD market.
- Key Growth Drivers in Consumer Electronics:
- Increasing Disposable Incomes: Rising global incomes in emerging economies are fueling the demand for consumer electronics, leading to higher adoption rates of devices featuring TFT LCD displays.
- Technological Advancements: The relentless pursuit of better visual experiences, including higher resolutions (4K and 8K), faster refresh rates, and improved color accuracy, keeps consumers upgrading their devices, thereby boosting demand for advanced TFT LCD panels.
- Short Product Replacement Cycles: The relatively short lifespan of many consumer electronics products, driven by new feature releases and evolving design trends, ensures a consistent demand for replacement and new purchases.
- Online Retail Growth: The proliferation of e-commerce platforms has made consumer electronics more accessible globally, contributing to wider market reach and sales volumes.
The Automotive segment is a rapidly growing and strategically important market, projected to exhibit a CAGR of over 6% from 2025 to 2033. The integration of multiple, larger, and more sophisticated displays for infotainment, instrument clusters, and heads-up displays is transforming vehicle interiors and driving demand for specialized TFT LCDs.
- Key Growth Drivers in Automotive:
- Electrification of Vehicles: The shift towards electric vehicles (EVs) often involves more advanced digital interfaces and larger central displays, enhancing the appeal and functionality of the EV experience.
- Autonomous Driving Features: As autonomous driving technologies mature, the need for sophisticated sensor integration and advanced visual feedback through displays becomes paramount for both drivers and passengers.
- In-Car Entertainment and Connectivity: Consumers expect a seamless and immersive in-car entertainment and connectivity experience, driving the adoption of larger and higher-quality displays.
- Safety Regulations and Features: Increasingly stringent automotive safety regulations are mandating advanced driver-assistance systems (ADAS) that rely heavily on visual information presented through displays.
Among the Types of TFT LCD technology, In-Plane Switching (IPS) displays are expected to maintain their dominance, driven by their superior viewing angles and color reproduction capabilities. IPS panels account for an estimated 40% of the total TFT LCD market in 2025.
- Key Growth Drivers for IPS:
- Superior Color Accuracy and Viewing Angles: IPS displays offer wider viewing angles and more accurate color representation compared to TN panels, making them ideal for applications where visual fidelity is crucial, such as professional monitors, high-end televisions, and smartphones.
- Growing Demand in Premium Consumer Electronics: As consumers prioritize visual quality, IPS technology becomes a preferred choice for premium smartphones, tablets, and laptops.
- Applications Requiring Consistent Color: In medical imaging and graphic design, where precise color consistency is critical, IPS displays are the preferred choice.
The Medical segment, while smaller in volume, represents a high-value market with steady growth due to the critical nature of diagnostic and monitoring equipment. The demand for high-resolution, reliable, and color-accurate displays in medical devices like MRI machines, CT scanners, ultrasound devices, and patient monitors is a significant contributor to market stability and growth.
- Key Growth Drivers in Medical:
- Aging Global Population: The increasing elderly population worldwide leads to a greater demand for healthcare services and medical devices, driving the need for advanced display technologies.
- Advancements in Medical Imaging: Continuous innovation in medical imaging techniques requires displays with higher resolution and better contrast ratios for improved diagnostic accuracy.
- Healthcare Infrastructure Development: Investments in improving healthcare infrastructure in developing nations are leading to increased adoption of modern medical equipment.
Geographically, Asia Pacific is the leading region, driven by its robust manufacturing base, significant consumer electronics production, and a large and growing consumer market. Countries like China, South Korea, and Taiwan are central to both the production and consumption of TFT LCD displays.
TFT LCD Display Product Analysis
Product innovations in TFT LCD displays are primarily focused on enhancing visual performance and energy efficiency. Advancements in mini-LED and quantum dot backlight technologies are significantly improving contrast ratios and color gamut, offering near-OLED quality at competitive price points. High refresh rates, exceeding 120Hz, are becoming standard in gaming monitors and high-end televisions, providing smoother motion and reduced blur. Increased pixel densities, leading to sharper images in 4K and 8K resolutions, cater to the growing demand for immersive viewing experiences. Competitive advantages are being established through superior color accuracy, wider viewing angles (especially with IPS variants), faster response times, and enhanced durability for industrial and automotive applications. The integration of touch capabilities and thinner bezel designs further enhances the aesthetic appeal and functionality of TFT LCD products.
Key Drivers, Barriers & Challenges in TFT LCD Display
The TFT LCD display market is propelled by several key drivers, including the ever-increasing demand for visual content across various devices, the continuous innovation in display technology leading to enhanced performance, and the widespread adoption of consumer electronics globally. The growing automotive sector's need for sophisticated in-car displays and the expansion of smart devices also contribute significantly. Policy-driven incentives for display manufacturing in certain regions can also act as growth catalysts.
However, the market faces significant barriers and challenges. Intense price competition among manufacturers can compress profit margins. The high capital expenditure required for setting up and maintaining advanced display fabrication facilities poses a substantial entry barrier. Supply chain vulnerabilities, as evidenced by recent global disruptions, can impact production timelines and costs. Furthermore, the emergence of competing display technologies like OLED and microLED, while not yet fully displacing LCDs in all segments, presents a long-term competitive threat, particularly in premium markets. Regulatory hurdles related to e-waste management and the sourcing of rare earth materials can also add complexity.
Growth Drivers in the TFT LCD Display Market
Key growth drivers for the TFT LCD display market are deeply rooted in technological advancements, economic factors, and evolving consumer behavior. The relentless pursuit of higher resolutions (4K, 8K), faster refresh rates, and superior color reproduction by manufacturers is a primary catalyst, directly responding to consumer demand for more engaging visual experiences. Economically, the increasing disposable incomes in emerging markets are translating into higher demand for consumer electronics, from smartphones and laptops to televisions, all of which rely on TFT LCD technology. Policy support in key manufacturing regions, such as government subsidies and tax incentives for the semiconductor and display industries, further bolsters production capacity and competitiveness. The burgeoning automotive sector, with its increasing reliance on digital cockpits and advanced infotainment systems, represents a significant and growing demand driver.
Challenges Impacting TFT LCD Display Growth
Despite robust growth drivers, the TFT LCD display market faces several challenges that can impede its expansion. Intense price competition among global manufacturers, driven by overcapacity in certain segments, can lead to margin erosion and a focus on cost reduction over innovation. The significant capital investment required for advanced manufacturing facilities creates high operational fixed costs and a vulnerability to market downturns. Supply chain disruptions, ranging from raw material shortages to logistics bottlenecks, can severely impact production schedules and profitability, as witnessed in recent global events. Furthermore, the continuous evolution and increasing adoption of alternative display technologies like OLED, microLED, and advanced quantum dot displays, particularly in high-end applications, pose a significant long-term competitive threat, necessitating ongoing R&D investment to maintain market share. Regulatory complexities surrounding environmental standards and material sourcing can also add operational and compliance costs.
Key Players Shaping the TFT LCD Display Market
- AU Optronics
- Innolux
- LG Display
- Samsung Display
Significant TFT LCD Display Industry Milestones
- 2019: Widespread adoption of 4K resolution in mid-range to high-end televisions and monitors, increasing consumer expectations for visual clarity.
- 2020: Accelerated adoption of larger displays in laptops and tablets driven by remote work and online learning trends.
- 2021: Increased focus on advanced backlight technologies like mini-LED and quantum dots to improve LCD performance, blurring the lines with OLED.
- 2022: Significant supply chain disruptions impacting raw material availability and production timelines globally, leading to price fluctuations.
- 2023: Growing integration of higher refresh rates (120Hz+) in mainstream smartphones and gaming monitors, enhancing user experience.
- 2024: Continued advancements in energy efficiency of TFT LCD panels, driven by consumer and regulatory demand for sustainable electronics.
- 2025 (Estimated): Expansion of TFT LCD applications in the automotive sector, with an increasing number of integrated displays for advanced driver-assistance systems (ADAS) and infotainment.
Future Outlook for TFT LCD Display Market
The future outlook for the TFT LCD display market remains positive, driven by sustained demand across its core application segments and ongoing technological evolution. While facing competition from emerging display technologies, TFT LCDs are expected to retain their dominance in many cost-sensitive and volume-driven markets due to their established manufacturing infrastructure and cost-effectiveness. Opportunities lie in the continued refinement of backlight technologies to further enhance contrast and color, the development of more energy-efficient panels, and the expansion of applications in the automotive and medical sectors. The market will likely see a bifurcation, with high-end applications increasingly exploring alternative technologies, while mainstream and budget-conscious segments will continue to rely on the maturity and affordability of TFT LCDs. Strategic investments in advanced manufacturing processes and differentiated product offerings will be crucial for players to secure their market position in the coming years.
TFT LCD Display Segmentation
-
1. Application
- 1.1. Consumer Electronics
- 1.2. Automotive
- 1.3. Aerospace & Defense
- 1.4. Medical
- 1.5. Others
-
2. Types
- 2.1. Twisted Nematic (TN)
- 2.2. In-Plane Switching (IPS)
- 2.3. Advanced Fringe Field Switching (AFFS)
- 2.4. Multi-Domain Vertical Alignment (MVA)
- 2.5. Patterned Vertical Alignment (PVA)
- 2.6. Advanced Super View (ASV)
- 2.7. Plane Line Switching (PLS)
- 2.8. Others
TFT LCD Display Segmentation By Geography
-
1. North America
- 1.1. United States
- 1.2. Canada
- 1.3. Mexico
-
2. South America
- 2.1. Brazil
- 2.2. Argentina
- 2.3. Rest of South America
-
3. Europe
- 3.1. United Kingdom
- 3.2. Germany
- 3.3. France
- 3.4. Italy
- 3.5. Spain
- 3.6. Russia
- 3.7. Benelux
- 3.8. Nordics
- 3.9. Rest of Europe
-
4. Middle East & Africa
- 4.1. Turkey
- 4.2. Israel
- 4.3. GCC
- 4.4. North Africa
- 4.5. South Africa
- 4.6. Rest of Middle East & Africa
-
5. Asia Pacific
- 5.1. China
- 5.2. India
- 5.3. Japan
- 5.4. South Korea
- 5.5. ASEAN
- 5.6. Oceania
- 5.7. Rest of Asia Pacific
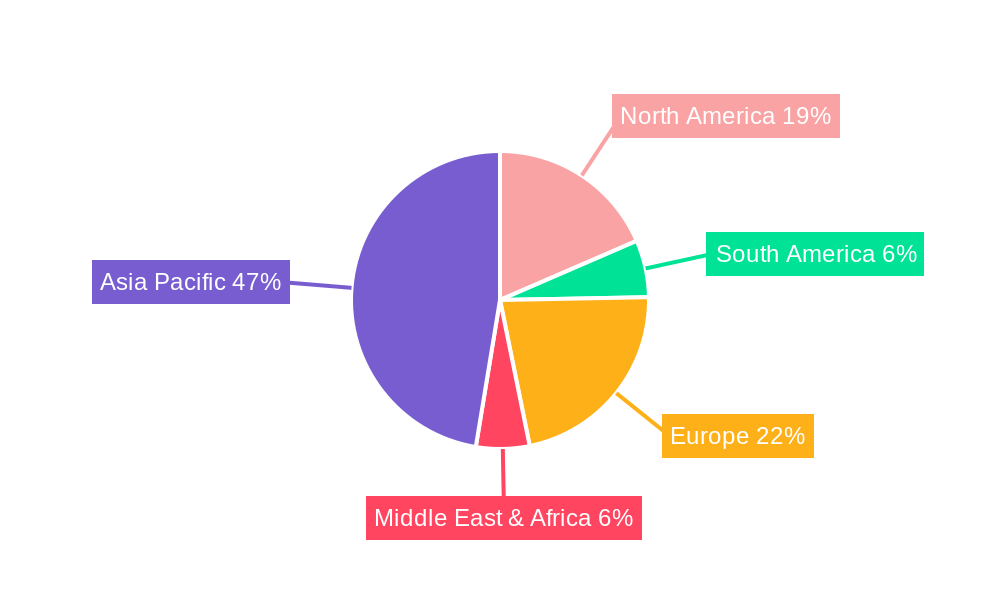
TFT LCD Display Regional Market Share
Geographic Coverage of TFT LCD Display
TFT LCD Display REPORT HIGHLIGHTS
| Aspects | Details |
|---|---|
| Study Period | 2020-2034 |
| Base Year | 2025 |
| Estimated Year | 2026 |
| Forecast Period | 2026-2034 |
| Historical Period | 2020-2025 |
| Growth Rate | CAGR of 3.8% from 2020-2034 |
| Segmentation |
|
Table of Contents
- 1. Introduction
- 1.1. Research Scope
- 1.2. Market Segmentation
- 1.3. Research Objective
- 1.4. Definitions and Assumptions
- 2. Executive Summary
- 2.1. Market Snapshot
- 3. Market Dynamics
- 3.1. Market Drivers
- 3.2. Market Restrains
- 3.3. Market Trends
- 3.4. Market Opportunities
- 4. Market Factor Analysis
- 4.1. Porters Five Forces
- 4.1.1. Bargaining Power of Suppliers
- 4.1.2. Bargaining Power of Buyers
- 4.1.3. Threat of New Entrants
- 4.1.4. Threat of Substitutes
- 4.1.5. Competitive Rivalry
- 4.2. PESTEL analysis
- 4.3. BCG Analysis
- 4.3.1. Stars (High Growth, High Market Share)
- 4.3.2. Cash Cows (Low Growth, High Market Share)
- 4.3.3. Question Mark (High Growth, Low Market Share)
- 4.3.4. Dogs (Low Growth, Low Market Share)
- 4.4. Ansoff Matrix Analysis
- 4.5. Supply Chain Analysis
- 4.6. Regulatory Landscape
- 4.7. Current Market Potential and Opportunity Assessment (TAM–SAM–SOM Framework)
- 4.8. TIR Analyst Note
- 4.1. Porters Five Forces
- 5. Market Analysis, Insights and Forecast 2021-2033
- 5.1. Market Analysis, Insights and Forecast - by Application
- 5.1.1. Consumer Electronics
- 5.1.2. Automotive
- 5.1.3. Aerospace & Defense
- 5.1.4. Medical
- 5.1.5. Others
- 5.2. Market Analysis, Insights and Forecast - by Types
- 5.2.1. Twisted Nematic (TN)
- 5.2.2. In-Plane Switching (IPS)
- 5.2.3. Advanced Fringe Field Switching (AFFS)
- 5.2.4. Multi-Domain Vertical Alignment (MVA)
- 5.2.5. Patterned Vertical Alignment (PVA)
- 5.2.6. Advanced Super View (ASV)
- 5.2.7. Plane Line Switching (PLS)
- 5.2.8. Others
- 5.3. Market Analysis, Insights and Forecast - by Region
- 5.3.1. North America
- 5.3.2. South America
- 5.3.3. Europe
- 5.3.4. Middle East & Africa
- 5.3.5. Asia Pacific
- 5.1. Market Analysis, Insights and Forecast - by Application
- 6. Global TFT LCD Display Analysis, Insights and Forecast, 2021-2033
- 6.1. Market Analysis, Insights and Forecast - by Application
- 6.1.1. Consumer Electronics
- 6.1.2. Automotive
- 6.1.3. Aerospace & Defense
- 6.1.4. Medical
- 6.1.5. Others
- 6.2. Market Analysis, Insights and Forecast - by Types
- 6.2.1. Twisted Nematic (TN)
- 6.2.2. In-Plane Switching (IPS)
- 6.2.3. Advanced Fringe Field Switching (AFFS)
- 6.2.4. Multi-Domain Vertical Alignment (MVA)
- 6.2.5. Patterned Vertical Alignment (PVA)
- 6.2.6. Advanced Super View (ASV)
- 6.2.7. Plane Line Switching (PLS)
- 6.2.8. Others
- 6.1. Market Analysis, Insights and Forecast - by Application
- 7. North America TFT LCD Display Analysis, Insights and Forecast, 2020-2032
- 7.1. Market Analysis, Insights and Forecast - by Application
- 7.1.1. Consumer Electronics
- 7.1.2. Automotive
- 7.1.3. Aerospace & Defense
- 7.1.4. Medical
- 7.1.5. Others
- 7.2. Market Analysis, Insights and Forecast - by Types
- 7.2.1. Twisted Nematic (TN)
- 7.2.2. In-Plane Switching (IPS)
- 7.2.3. Advanced Fringe Field Switching (AFFS)
- 7.2.4. Multi-Domain Vertical Alignment (MVA)
- 7.2.5. Patterned Vertical Alignment (PVA)
- 7.2.6. Advanced Super View (ASV)
- 7.2.7. Plane Line Switching (PLS)
- 7.2.8. Others
- 7.1. Market Analysis, Insights and Forecast - by Application
- 8. South America TFT LCD Display Analysis, Insights and Forecast, 2020-2032
- 8.1. Market Analysis, Insights and Forecast - by Application
- 8.1.1. Consumer Electronics
- 8.1.2. Automotive
- 8.1.3. Aerospace & Defense
- 8.1.4. Medical
- 8.1.5. Others
- 8.2. Market Analysis, Insights and Forecast - by Types
- 8.2.1. Twisted Nematic (TN)
- 8.2.2. In-Plane Switching (IPS)
- 8.2.3. Advanced Fringe Field Switching (AFFS)
- 8.2.4. Multi-Domain Vertical Alignment (MVA)
- 8.2.5. Patterned Vertical Alignment (PVA)
- 8.2.6. Advanced Super View (ASV)
- 8.2.7. Plane Line Switching (PLS)
- 8.2.8. Others
- 8.1. Market Analysis, Insights and Forecast - by Application
- 9. Europe TFT LCD Display Analysis, Insights and Forecast, 2020-2032
- 9.1. Market Analysis, Insights and Forecast - by Application
- 9.1.1. Consumer Electronics
- 9.1.2. Automotive
- 9.1.3. Aerospace & Defense
- 9.1.4. Medical
- 9.1.5. Others
- 9.2. Market Analysis, Insights and Forecast - by Types
- 9.2.1. Twisted Nematic (TN)
- 9.2.2. In-Plane Switching (IPS)
- 9.2.3. Advanced Fringe Field Switching (AFFS)
- 9.2.4. Multi-Domain Vertical Alignment (MVA)
- 9.2.5. Patterned Vertical Alignment (PVA)
- 9.2.6. Advanced Super View (ASV)
- 9.2.7. Plane Line Switching (PLS)
- 9.2.8. Others
- 9.1. Market Analysis, Insights and Forecast - by Application
- 10. Middle East & Africa TFT LCD Display Analysis, Insights and Forecast, 2020-2032
- 10.1. Market Analysis, Insights and Forecast - by Application
- 10.1.1. Consumer Electronics
- 10.1.2. Automotive
- 10.1.3. Aerospace & Defense
- 10.1.4. Medical
- 10.1.5. Others
- 10.2. Market Analysis, Insights and Forecast - by Types
- 10.2.1. Twisted Nematic (TN)
- 10.2.2. In-Plane Switching (IPS)
- 10.2.3. Advanced Fringe Field Switching (AFFS)
- 10.2.4. Multi-Domain Vertical Alignment (MVA)
- 10.2.5. Patterned Vertical Alignment (PVA)
- 10.2.6. Advanced Super View (ASV)
- 10.2.7. Plane Line Switching (PLS)
- 10.2.8. Others
- 10.1. Market Analysis, Insights and Forecast - by Application
- 11. Asia Pacific TFT LCD Display Analysis, Insights and Forecast, 2020-2032
- 11.1. Market Analysis, Insights and Forecast - by Application
- 11.1.1. Consumer Electronics
- 11.1.2. Automotive
- 11.1.3. Aerospace & Defense
- 11.1.4. Medical
- 11.1.5. Others
- 11.2. Market Analysis, Insights and Forecast - by Types
- 11.2.1. Twisted Nematic (TN)
- 11.2.2. In-Plane Switching (IPS)
- 11.2.3. Advanced Fringe Field Switching (AFFS)
- 11.2.4. Multi-Domain Vertical Alignment (MVA)
- 11.2.5. Patterned Vertical Alignment (PVA)
- 11.2.6. Advanced Super View (ASV)
- 11.2.7. Plane Line Switching (PLS)
- 11.2.8. Others
- 11.1. Market Analysis, Insights and Forecast - by Application
- 12. Competitive Analysis
- 12.1. Company Profiles
- 12.1.1 AU Optronics
- 12.1.1.1. Company Overview
- 12.1.1.2. Products
- 12.1.1.3. Company Financials
- 12.1.1.4. SWOT Analysis
- 12.1.2 Innolux
- 12.1.2.1. Company Overview
- 12.1.2.2. Products
- 12.1.2.3. Company Financials
- 12.1.2.4. SWOT Analysis
- 12.1.3 LG Display
- 12.1.3.1. Company Overview
- 12.1.3.2. Products
- 12.1.3.3. Company Financials
- 12.1.3.4. SWOT Analysis
- 12.1.4 Samsung Display
- 12.1.4.1. Company Overview
- 12.1.4.2. Products
- 12.1.4.3. Company Financials
- 12.1.4.4. SWOT Analysis
- 12.1.1 AU Optronics
- 12.2. Market Entropy
- 12.2.1 Company's Key Areas Served
- 12.2.2 Recent Developments
- 12.3. Company Market Share Analysis 2025
- 12.3.1 Top 5 Companies Market Share Analysis
- 12.3.2 Top 3 Companies Market Share Analysis
- 12.4. List of Potential Customers
- 13. Research Methodology
List of Figures
- Figure 1: Global TFT LCD Display Revenue Breakdown (billion, %) by Region 2025 & 2033
- Figure 2: North America TFT LCD Display Revenue (billion), by Application 2025 & 2033
- Figure 3: North America TFT LCD Display Revenue Share (%), by Application 2025 & 2033
- Figure 4: North America TFT LCD Display Revenue (billion), by Types 2025 & 2033
- Figure 5: North America TFT LCD Display Revenue Share (%), by Types 2025 & 2033
- Figure 6: North America TFT LCD Display Revenue (billion), by Country 2025 & 2033
- Figure 7: North America TFT LCD Display Revenue Share (%), by Country 2025 & 2033
- Figure 8: South America TFT LCD Display Revenue (billion), by Application 2025 & 2033
- Figure 9: South America TFT LCD Display Revenue Share (%), by Application 2025 & 2033
- Figure 10: South America TFT LCD Display Revenue (billion), by Types 2025 & 2033
- Figure 11: South America TFT LCD Display Revenue Share (%), by Types 2025 & 2033
- Figure 12: South America TFT LCD Display Revenue (billion), by Country 2025 & 2033
- Figure 13: South America TFT LCD Display Revenue Share (%), by Country 2025 & 2033
- Figure 14: Europe TFT LCD Display Revenue (billion), by Application 2025 & 2033
- Figure 15: Europe TFT LCD Display Revenue Share (%), by Application 2025 & 2033
- Figure 16: Europe TFT LCD Display Revenue (billion), by Types 2025 & 2033
- Figure 17: Europe TFT LCD Display Revenue Share (%), by Types 2025 & 2033
- Figure 18: Europe TFT LCD Display Revenue (billion), by Country 2025 & 2033
- Figure 19: Europe TFT LCD Display Revenue Share (%), by Country 2025 & 2033
- Figure 20: Middle East & Africa TFT LCD Display Revenue (billion), by Application 2025 & 2033
- Figure 21: Middle East & Africa TFT LCD Display Revenue Share (%), by Application 2025 & 2033
- Figure 22: Middle East & Africa TFT LCD Display Revenue (billion), by Types 2025 & 2033
- Figure 23: Middle East & Africa TFT LCD Display Revenue Share (%), by Types 2025 & 2033
- Figure 24: Middle East & Africa TFT LCD Display Revenue (billion), by Country 2025 & 2033
- Figure 25: Middle East & Africa TFT LCD Display Revenue Share (%), by Country 2025 & 2033
- Figure 26: Asia Pacific TFT LCD Display Revenue (billion), by Application 2025 & 2033
- Figure 27: Asia Pacific TFT LCD Display Revenue Share (%), by Application 2025 & 2033
- Figure 28: Asia Pacific TFT LCD Display Revenue (billion), by Types 2025 & 2033
- Figure 29: Asia Pacific TFT LCD Display Revenue Share (%), by Types 2025 & 2033
- Figure 30: Asia Pacific TFT LCD Display Revenue (billion), by Country 2025 & 2033
- Figure 31: Asia Pacific TFT LCD Display Revenue Share (%), by Country 2025 & 2033
List of Tables
- Table 1: Global TFT LCD Display Revenue billion Forecast, by Application 2020 & 2033
- Table 2: Global TFT LCD Display Revenue billion Forecast, by Types 2020 & 2033
- Table 3: Global TFT LCD Display Revenue billion Forecast, by Region 2020 & 2033
- Table 4: Global TFT LCD Display Revenue billion Forecast, by Application 2020 & 2033
- Table 5: Global TFT LCD Display Revenue billion Forecast, by Types 2020 & 2033
- Table 6: Global TFT LCD Display Revenue billion Forecast, by Country 2020 & 2033
- Table 7: United States TFT LCD Display Revenue (billion) Forecast, by Application 2020 & 2033
- Table 8: Canada TFT LCD Display Revenue (billion) Forecast, by Application 2020 & 2033
- Table 9: Mexico TFT LCD Display Revenue (billion) Forecast, by Application 2020 & 2033
- Table 10: Global TFT LCD Display Revenue billion Forecast, by Application 2020 & 2033
- Table 11: Global TFT LCD Display Revenue billion Forecast, by Types 2020 & 2033
- Table 12: Global TFT LCD Display Revenue billion Forecast, by Country 2020 & 2033
- Table 13: Brazil TFT LCD Display Revenue (billion) Forecast, by Application 2020 & 2033
- Table 14: Argentina TFT LCD Display Revenue (billion) Forecast, by Application 2020 & 2033
- Table 15: Rest of South America TFT LCD Display Revenue (billion) Forecast, by Application 2020 & 2033
- Table 16: Global TFT LCD Display Revenue billion Forecast, by Application 2020 & 2033
- Table 17: Global TFT LCD Display Revenue billion Forecast, by Types 2020 & 2033
- Table 18: Global TFT LCD Display Revenue billion Forecast, by Country 2020 & 2033
- Table 19: United Kingdom TFT LCD Display Revenue (billion) Forecast, by Application 2020 & 2033
- Table 20: Germany TFT LCD Display Revenue (billion) Forecast, by Application 2020 & 2033
- Table 21: France TFT LCD Display Revenue (billion) Forecast, by Application 2020 & 2033
- Table 22: Italy TFT LCD Display Revenue (billion) Forecast, by Application 2020 & 2033
- Table 23: Spain TFT LCD Display Revenue (billion) Forecast, by Application 2020 & 2033
- Table 24: Russia TFT LCD Display Revenue (billion) Forecast, by Application 2020 & 2033
- Table 25: Benelux TFT LCD Display Revenue (billion) Forecast, by Application 2020 & 2033
- Table 26: Nordics TFT LCD Display Revenue (billion) Forecast, by Application 2020 & 2033
- Table 27: Rest of Europe TFT LCD Display Revenue (billion) Forecast, by Application 2020 & 2033
- Table 28: Global TFT LCD Display Revenue billion Forecast, by Application 2020 & 2033
- Table 29: Global TFT LCD Display Revenue billion Forecast, by Types 2020 & 2033
- Table 30: Global TFT LCD Display Revenue billion Forecast, by Country 2020 & 2033
- Table 31: Turkey TFT LCD Display Revenue (billion) Forecast, by Application 2020 & 2033
- Table 32: Israel TFT LCD Display Revenue (billion) Forecast, by Application 2020 & 2033
- Table 33: GCC TFT LCD Display Revenue (billion) Forecast, by Application 2020 & 2033
- Table 34: North Africa TFT LCD Display Revenue (billion) Forecast, by Application 2020 & 2033
- Table 35: South Africa TFT LCD Display Revenue (billion) Forecast, by Application 2020 & 2033
- Table 36: Rest of Middle East & Africa TFT LCD Display Revenue (billion) Forecast, by Application 2020 & 2033
- Table 37: Global TFT LCD Display Revenue billion Forecast, by Application 2020 & 2033
- Table 38: Global TFT LCD Display Revenue billion Forecast, by Types 2020 & 2033
- Table 39: Global TFT LCD Display Revenue billion Forecast, by Country 2020 & 2033
- Table 40: China TFT LCD Display Revenue (billion) Forecast, by Application 2020 & 2033
- Table 41: India TFT LCD Display Revenue (billion) Forecast, by Application 2020 & 2033
- Table 42: Japan TFT LCD Display Revenue (billion) Forecast, by Application 2020 & 2033
- Table 43: South Korea TFT LCD Display Revenue (billion) Forecast, by Application 2020 & 2033
- Table 44: ASEAN TFT LCD Display Revenue (billion) Forecast, by Application 2020 & 2033
- Table 45: Oceania TFT LCD Display Revenue (billion) Forecast, by Application 2020 & 2033
- Table 46: Rest of Asia Pacific TFT LCD Display Revenue (billion) Forecast, by Application 2020 & 2033
Frequently Asked Questions
1. What is the projected Compound Annual Growth Rate (CAGR) of the TFT LCD Display?
The projected CAGR is approximately 3.8%.
2. Which companies are prominent players in the TFT LCD Display?
Key companies in the market include AU Optronics, Innolux, LG Display, Samsung Display.
3. What are the main segments of the TFT LCD Display?
The market segments include Application, Types.
4. Can you provide details about the market size?
The market size is estimated to be USD 265 billion as of 2022.
5. What are some drivers contributing to market growth?
N/A
6. What are the notable trends driving market growth?
N/A
7. Are there any restraints impacting market growth?
N/A
8. Can you provide examples of recent developments in the market?
N/A
9. What pricing options are available for accessing the report?
Pricing options include single-user, multi-user, and enterprise licenses priced at USD 4900.00, USD 7350.00, and USD 9800.00 respectively.
10. Is the market size provided in terms of value or volume?
The market size is provided in terms of value, measured in billion.
11. Are there any specific market keywords associated with the report?
Yes, the market keyword associated with the report is "TFT LCD Display," which aids in identifying and referencing the specific market segment covered.
12. How do I determine which pricing option suits my needs best?
The pricing options vary based on user requirements and access needs. Individual users may opt for single-user licenses, while businesses requiring broader access may choose multi-user or enterprise licenses for cost-effective access to the report.
13. Are there any additional resources or data provided in the TFT LCD Display report?
While the report offers comprehensive insights, it's advisable to review the specific contents or supplementary materials provided to ascertain if additional resources or data are available.
14. How can I stay updated on further developments or reports in the TFT LCD Display?
To stay informed about further developments, trends, and reports in the TFT LCD Display, consider subscribing to industry newsletters, following relevant companies and organizations, or regularly checking reputable industry news sources and publications.
Methodology
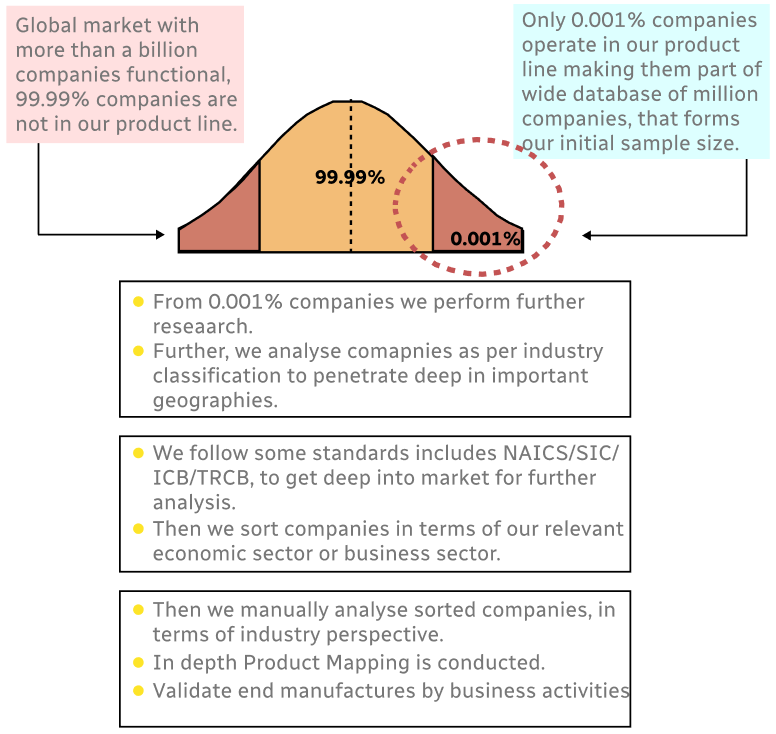
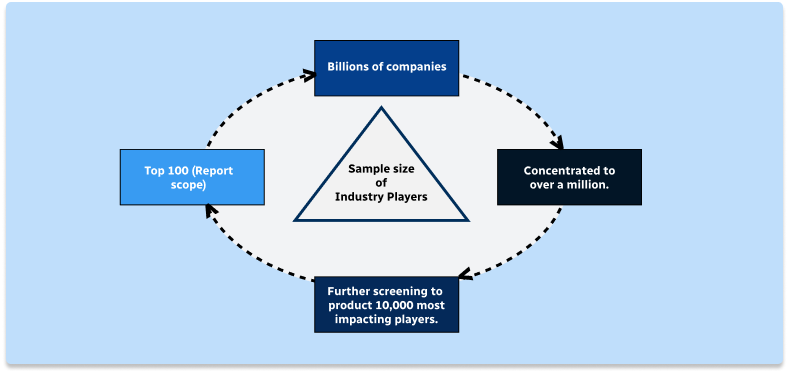
Step 1 - Identification of Relevant Samples Size from Population Database
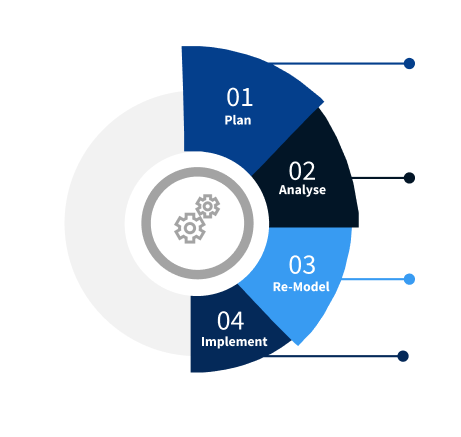
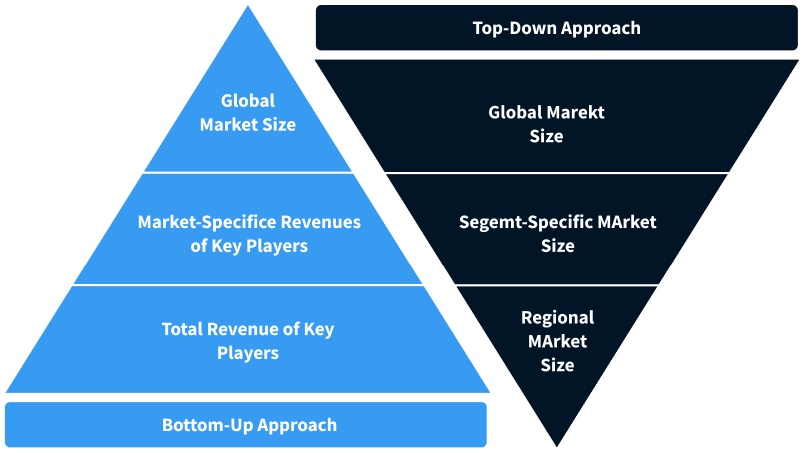
Step 2 - Approaches for Defining Global Market Size (Value, Volume* & Price*)
Note*: In applicable scenarios
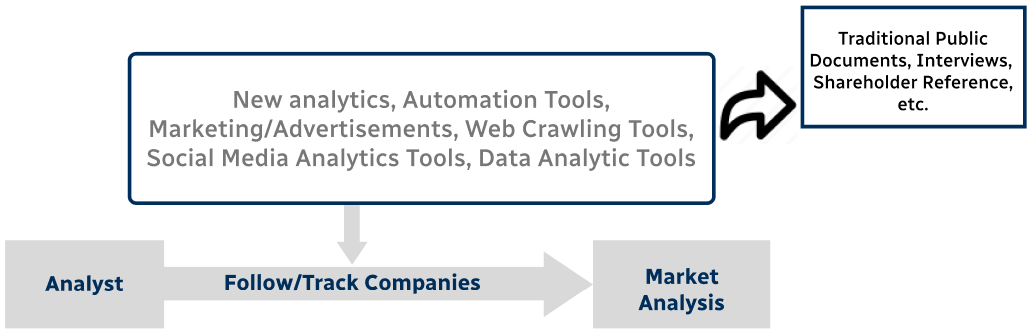
Step 3 - Data Sources
Primary Research
- Web Analytics
- Survey Reports
- Research Institute
- Latest Research Reports
- Opinion Leaders
Secondary Research
- Annual Reports
- White Paper
- Latest Press Release
- Industry Association
- Paid Database
- Investor Presentations
Step 4 - Data Triangulation
Involves using different sources of information in order to increase the validity of a study
These sources are likely to be stakeholders in a program - participants, other researchers, program staff, other community members, and so on.
Then we put all data in single framework & apply various statistical tools to find out the dynamic on the market.
During the analysis stage, feedback from the stakeholder groups would be compared to determine areas of agreement as well as areas of divergence