

Key Insights
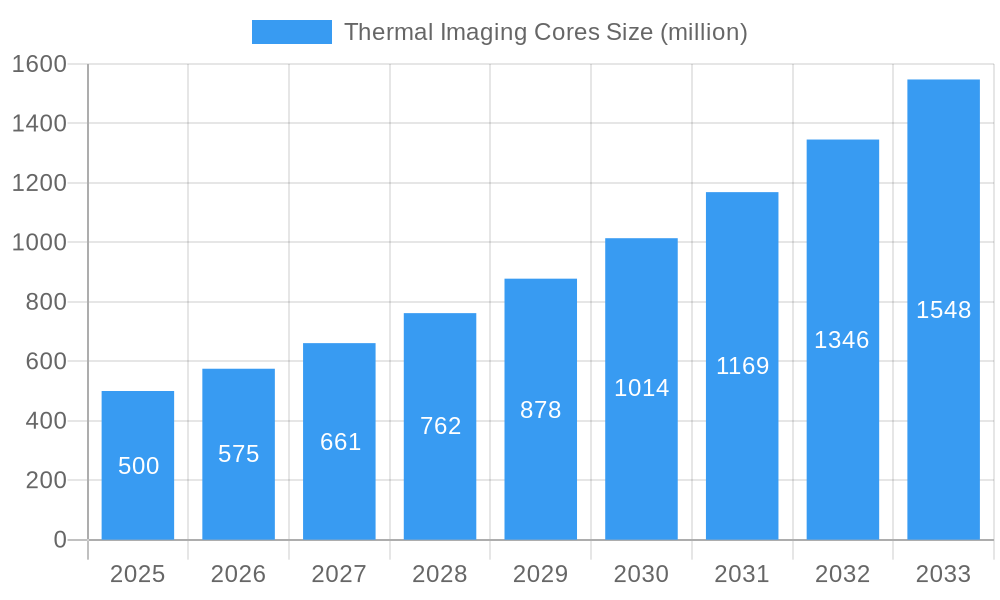
The global thermal imaging cores market is experiencing robust growth, driven by increasing demand across diverse sectors. The market, estimated at $500 million in 2025, is projected to exhibit a Compound Annual Growth Rate (CAGR) of 15% from 2025 to 2033, reaching approximately $1.5 billion by the end of the forecast period. This expansion is fueled by several key factors, including advancements in sensor technology leading to higher resolution and improved thermal sensitivity at reduced costs. The rising adoption of thermal imaging in automotive safety systems (ADAS), particularly night vision and pedestrian detection, is a major driver. Furthermore, the increasing use of thermal imaging in security and surveillance applications, industrial inspection (predictive maintenance), and medical diagnostics contributes significantly to market growth. Companies like Opgal, BAE Systems, and others are continuously innovating to meet the growing demand for smaller, lighter, and more energy-efficient thermal imaging cores.
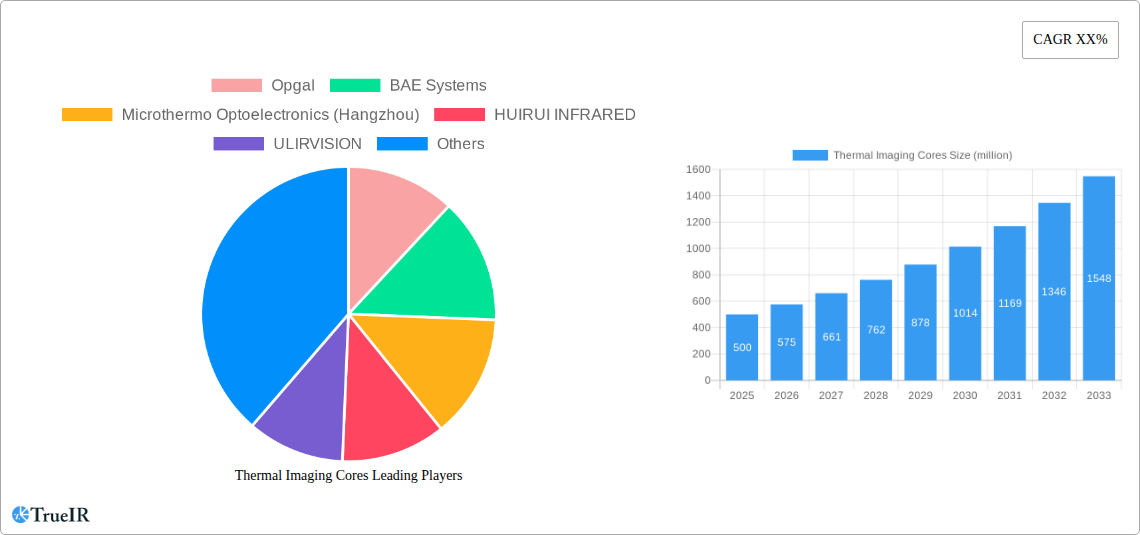
Thermal Imaging Cores Market Size (In Million)
However, certain restraints hinder market expansion. The high initial investment required for thermal imaging systems can be a barrier to entry for some applications. Additionally, the availability of skilled professionals to install and maintain these sophisticated systems can pose a challenge, especially in developing regions. Despite these limitations, the ongoing technological advancements and the expanding applications across various sectors are expected to outweigh these challenges, ultimately driving substantial market growth in the coming years. The market is segmented by resolution, application, and region, with North America and Europe currently dominating the market share, but regions like Asia-Pacific are expected to witness significant growth due to increasing infrastructure development and rising adoption across various industries.
Thermal Imaging Cores Company Market Share
Dynamic Thermal Imaging Cores Market Report: 2019-2033
This comprehensive report provides an in-depth analysis of the global Thermal Imaging Cores market, offering invaluable insights for stakeholders across the value chain. With a study period spanning 2019-2033, a base year of 2025, and an estimated year of 2025, this report projects market trends through 2033. The report leverages extensive market research, encompassing historical data (2019-2024) and detailed forecasts (2025-2033), to deliver a precise and actionable market overview. This report is designed to enhance decision-making processes by providing a clear understanding of market dynamics, competitive landscapes, and future growth potential within the multi-million dollar thermal imaging cores industry.
Thermal Imaging Cores Market Structure & Competitive Landscape
The global thermal imaging cores market, valued at approximately $XX million in 2025, exhibits a moderately concentrated structure. The Herfindahl-Hirschman Index (HHI) is estimated at xx, indicating a competitive landscape with several significant players and some niche competitors. Key drivers of innovation include advancements in microbolometer technology, increasing demand for higher resolution and sensitivity, and the miniaturization of thermal imaging systems. Regulatory impacts, primarily focused on safety and export controls, vary by region but generally pose moderate challenges. Product substitutes, such as high-sensitivity CCD cameras for specific applications, exist but are not widespread due to limitations in thermal sensitivity. The market is segmented by application (automotive, defense, industrial, medical, etc.), with the automotive sector exhibiting the fastest growth. M&A activity in the past five years has been moderate, with approximately xx million dollars in total deal value, mainly involving smaller companies being acquired by larger players to expand product portfolios and gain access to new technologies.
- Market Concentration: Moderately concentrated, with an estimated HHI of xx.
- Innovation Drivers: Advancements in microbolometer technology, demand for higher resolution and sensitivity, miniaturization.
- Regulatory Impacts: Vary by region; generally moderate challenges regarding safety and export controls.
- Product Substitutes: Limited, primarily high-sensitivity CCD cameras with lower thermal sensitivity.
- End-User Segmentation: Automotive, defense, industrial, medical, etc., with automotive showing the fastest growth.
- M&A Trends: Moderate activity over the past five years, totaling approximately $XX million.
Thermal Imaging Cores Market Trends & Opportunities
The thermal imaging cores market is projected to experience substantial growth, with a Compound Annual Growth Rate (CAGR) of xx% during the forecast period (2025-2033), reaching an estimated value of $XX million by 2033. This growth is driven by several factors: increasing demand from diverse end-use sectors, technological advancements resulting in improved image quality and reduced costs, and expanding applications in emerging markets. Consumer preferences are shifting towards higher-resolution, more energy-efficient, and cost-effective thermal imaging systems. Competitive dynamics are characterized by intense competition among established players, alongside the emergence of new entrants with innovative technologies. Market penetration rates vary across segments and regions, with significant potential for growth in developing economies. Technological shifts, such as the adoption of uncooled microbolometers and advanced signal processing algorithms, are further propelling market expansion.
Dominant Markets & Segments in Thermal Imaging Cores
The North American market currently holds a dominant position in the global thermal imaging cores market, accounting for approximately xx% of the total revenue in 2025. This dominance is attributed to several factors:
- Robust technological infrastructure: A strong base for R&D and manufacturing capabilities.
- High adoption rates in various sectors: Strong demand from automotive, defense, and industrial sectors.
- Favorable government policies: Supportive regulatory environment and investment in technological advancements.
- Strong consumer demand: High disposable income and preference for technologically advanced products.
The automotive segment is projected to experience the most significant growth within the forecast period, fueled by increasing adoption of advanced driver-assistance systems (ADAS) and autonomous vehicles. The integration of thermal imaging into these systems for enhanced safety and performance is a major driver of this market segment's growth.
Thermal Imaging Cores Product Analysis
Recent innovations in thermal imaging cores include advancements in uncooled microbolometer technology, resulting in smaller, lighter, and more cost-effective thermal imaging systems. These advancements have expanded the applications of thermal imaging across various industries, improving system performance and image quality. Competitive advantages often stem from superior image resolution, thermal sensitivity, lower power consumption, and smaller form factor. The successful integration of these core technologies into diverse applications, such as automotive night vision, security surveillance, and industrial process monitoring, drives the market growth significantly.
Key Drivers, Barriers & Challenges in Thermal Imaging Cores
Key Drivers:
- Technological advancements in microbolometer technology, leading to improved performance and reduced costs.
- Increasing demand from diverse sectors, including automotive, defense, and medical.
- Government initiatives and investments supporting the development and adoption of thermal imaging technologies.
Challenges:
- Supply Chain Disruptions: Geopolitical instability and component shortages can impact production and increase costs. This has resulted in estimated delays of xx% in some projects in 2024.
- Regulatory Hurdles: Stringent safety and export regulations in certain countries can hinder market expansion.
- Competitive Pressure: The presence of numerous players leads to intense competition, potentially impacting pricing and profit margins.
Growth Drivers in the Thermal Imaging Cores Market
The market is primarily propelled by technological advancements, including the development of higher-resolution, more sensitive, and energy-efficient microbolometers. Growing demand across diverse sectors, particularly automotive, for enhanced safety features and autonomous driving capabilities is driving considerable growth. Government investments and supportive regulations in key regions further stimulate market expansion.
Challenges Impacting Thermal Imaging Cores Growth
Supply chain disruptions, especially concerning raw materials and specialized components, create significant hurdles. Stringent regulatory requirements and certification processes can delay product launches and increase compliance costs. Intense competition from established and emerging players leads to price pressure and limits profit margins.
Key Players Shaping the Thermal Imaging Cores Market
- Opgal
- BAE Systems
- Microthermo Optoelectronics (Hangzhou)
- HUIRUI INFRARED
- ULIRVISION
- Acal BFi
- iTherml Technology
- MH Technology
Significant Thermal Imaging Cores Industry Milestones
- 2022 Q3: Opgal launches a new generation of high-resolution thermal imaging cores with improved sensitivity.
- 2023 Q1: BAE Systems announces a strategic partnership to develop advanced microbolometer technology for defense applications.
- 2024 Q2: Significant increase in the adoption rate of thermal imaging cores by major automotive manufacturers.
Future Outlook for Thermal Imaging Cores Market
The thermal imaging cores market is poised for sustained growth, driven by ongoing technological advancements and increasing demand across a broad range of applications. The integration of thermal imaging into smart devices, autonomous vehicles, and security systems will create significant opportunities. Strategic partnerships and collaborations among industry players will further accelerate market expansion, leading to a potential market value of $XX million by 2033.
Thermal Imaging Cores Segmentation
-
1. Application
- 1.1. Commercial
- 1.2. Civil
- 1.3. Military
-
2. Types
- 2.1. Uncooled Thermal Cores
- 2.2. Cooled Thermal Cores
Thermal Imaging Cores Segmentation By Geography
-
1. North America
- 1.1. United States
- 1.2. Canada
- 1.3. Mexico
-
2. South America
- 2.1. Brazil
- 2.2. Argentina
- 2.3. Rest of South America
-
3. Europe
- 3.1. United Kingdom
- 3.2. Germany
- 3.3. France
- 3.4. Italy
- 3.5. Spain
- 3.6. Russia
- 3.7. Benelux
- 3.8. Nordics
- 3.9. Rest of Europe
-
4. Middle East & Africa
- 4.1. Turkey
- 4.2. Israel
- 4.3. GCC
- 4.4. North Africa
- 4.5. South Africa
- 4.6. Rest of Middle East & Africa
-
5. Asia Pacific
- 5.1. China
- 5.2. India
- 5.3. Japan
- 5.4. South Korea
- 5.5. ASEAN
- 5.6. Oceania
- 5.7. Rest of Asia Pacific

Thermal Imaging Cores Regional Market Share
Geographic Coverage of Thermal Imaging Cores
Thermal Imaging Cores REPORT HIGHLIGHTS
| Aspects | Details |
|---|---|
| Study Period | 2020-2034 |
| Base Year | 2025 |
| Estimated Year | 2026 |
| Forecast Period | 2026-2034 |
| Historical Period | 2020-2025 |
| Growth Rate | CAGR of XX% from 2020-2034 |
| Segmentation |
|
Table of Contents
- 1. Introduction
- 1.1. Research Scope
- 1.2. Market Segmentation
- 1.3. Research Objective
- 1.4. Definitions and Assumptions
- 2. Executive Summary
- 2.1. Market Snapshot
- 3. Market Dynamics
- 3.1. Market Drivers
- 3.2. Market Restrains
- 3.3. Market Trends
- 3.4. Market Opportunities
- 4. Market Factor Analysis
- 4.1. Porters Five Forces
- 4.1.1. Bargaining Power of Suppliers
- 4.1.2. Bargaining Power of Buyers
- 4.1.3. Threat of New Entrants
- 4.1.4. Threat of Substitutes
- 4.1.5. Competitive Rivalry
- 4.2. PESTEL analysis
- 4.3. BCG Analysis
- 4.3.1. Stars (High Growth, High Market Share)
- 4.3.2. Cash Cows (Low Growth, High Market Share)
- 4.3.3. Question Mark (High Growth, Low Market Share)
- 4.3.4. Dogs (Low Growth, Low Market Share)
- 4.4. Ansoff Matrix Analysis
- 4.5. Supply Chain Analysis
- 4.6. Regulatory Landscape
- 4.7. Current Market Potential and Opportunity Assessment (TAM–SAM–SOM Framework)
- 4.8. TIR Analyst Note
- 4.1. Porters Five Forces
- 5. Market Analysis, Insights and Forecast 2021-2033
- 5.1. Market Analysis, Insights and Forecast - by Application
- 5.1.1. Commercial
- 5.1.2. Civil
- 5.1.3. Military
- 5.2. Market Analysis, Insights and Forecast - by Types
- 5.2.1. Uncooled Thermal Cores
- 5.2.2. Cooled Thermal Cores
- 5.3. Market Analysis, Insights and Forecast - by Region
- 5.3.1. North America
- 5.3.2. South America
- 5.3.3. Europe
- 5.3.4. Middle East & Africa
- 5.3.5. Asia Pacific
- 5.1. Market Analysis, Insights and Forecast - by Application
- 6. Global Thermal Imaging Cores Analysis, Insights and Forecast, 2021-2033
- 6.1. Market Analysis, Insights and Forecast - by Application
- 6.1.1. Commercial
- 6.1.2. Civil
- 6.1.3. Military
- 6.2. Market Analysis, Insights and Forecast - by Types
- 6.2.1. Uncooled Thermal Cores
- 6.2.2. Cooled Thermal Cores
- 6.1. Market Analysis, Insights and Forecast - by Application
- 7. North America Thermal Imaging Cores Analysis, Insights and Forecast, 2020-2032
- 7.1. Market Analysis, Insights and Forecast - by Application
- 7.1.1. Commercial
- 7.1.2. Civil
- 7.1.3. Military
- 7.2. Market Analysis, Insights and Forecast - by Types
- 7.2.1. Uncooled Thermal Cores
- 7.2.2. Cooled Thermal Cores
- 7.1. Market Analysis, Insights and Forecast - by Application
- 8. South America Thermal Imaging Cores Analysis, Insights and Forecast, 2020-2032
- 8.1. Market Analysis, Insights and Forecast - by Application
- 8.1.1. Commercial
- 8.1.2. Civil
- 8.1.3. Military
- 8.2. Market Analysis, Insights and Forecast - by Types
- 8.2.1. Uncooled Thermal Cores
- 8.2.2. Cooled Thermal Cores
- 8.1. Market Analysis, Insights and Forecast - by Application
- 9. Europe Thermal Imaging Cores Analysis, Insights and Forecast, 2020-2032
- 9.1. Market Analysis, Insights and Forecast - by Application
- 9.1.1. Commercial
- 9.1.2. Civil
- 9.1.3. Military
- 9.2. Market Analysis, Insights and Forecast - by Types
- 9.2.1. Uncooled Thermal Cores
- 9.2.2. Cooled Thermal Cores
- 9.1. Market Analysis, Insights and Forecast - by Application
- 10. Middle East & Africa Thermal Imaging Cores Analysis, Insights and Forecast, 2020-2032
- 10.1. Market Analysis, Insights and Forecast - by Application
- 10.1.1. Commercial
- 10.1.2. Civil
- 10.1.3. Military
- 10.2. Market Analysis, Insights and Forecast - by Types
- 10.2.1. Uncooled Thermal Cores
- 10.2.2. Cooled Thermal Cores
- 10.1. Market Analysis, Insights and Forecast - by Application
- 11. Asia Pacific Thermal Imaging Cores Analysis, Insights and Forecast, 2020-2032
- 11.1. Market Analysis, Insights and Forecast - by Application
- 11.1.1. Commercial
- 11.1.2. Civil
- 11.1.3. Military
- 11.2. Market Analysis, Insights and Forecast - by Types
- 11.2.1. Uncooled Thermal Cores
- 11.2.2. Cooled Thermal Cores
- 11.1. Market Analysis, Insights and Forecast - by Application
- 12. Competitive Analysis
- 12.1. Company Profiles
- 12.1.1 Opgal
- 12.1.1.1. Company Overview
- 12.1.1.2. Products
- 12.1.1.3. Company Financials
- 12.1.1.4. SWOT Analysis
- 12.1.2 BAE Systems
- 12.1.2.1. Company Overview
- 12.1.2.2. Products
- 12.1.2.3. Company Financials
- 12.1.2.4. SWOT Analysis
- 12.1.3 Microthermo Optoelectronics (Hangzhou)
- 12.1.3.1. Company Overview
- 12.1.3.2. Products
- 12.1.3.3. Company Financials
- 12.1.3.4. SWOT Analysis
- 12.1.4 HUIRUI INFRARED
- 12.1.4.1. Company Overview
- 12.1.4.2. Products
- 12.1.4.3. Company Financials
- 12.1.4.4. SWOT Analysis
- 12.1.5 ULIRVISION
- 12.1.5.1. Company Overview
- 12.1.5.2. Products
- 12.1.5.3. Company Financials
- 12.1.5.4. SWOT Analysis
- 12.1.6 Acal BFi
- 12.1.6.1. Company Overview
- 12.1.6.2. Products
- 12.1.6.3. Company Financials
- 12.1.6.4. SWOT Analysis
- 12.1.7 iTherml Technology
- 12.1.7.1. Company Overview
- 12.1.7.2. Products
- 12.1.7.3. Company Financials
- 12.1.7.4. SWOT Analysis
- 12.1.8 MH Technology
- 12.1.8.1. Company Overview
- 12.1.8.2. Products
- 12.1.8.3. Company Financials
- 12.1.8.4. SWOT Analysis
- 12.1.1 Opgal
- 12.2. Market Entropy
- 12.2.1 Company's Key Areas Served
- 12.2.2 Recent Developments
- 12.3. Company Market Share Analysis 2025
- 12.3.1 Top 5 Companies Market Share Analysis
- 12.3.2 Top 3 Companies Market Share Analysis
- 12.4. List of Potential Customers
- 13. Research Methodology
List of Figures
- Figure 1: Global Thermal Imaging Cores Revenue Breakdown (million, %) by Region 2025 & 2033
- Figure 2: Global Thermal Imaging Cores Volume Breakdown (K, %) by Region 2025 & 2033
- Figure 3: North America Thermal Imaging Cores Revenue (million), by Application 2025 & 2033
- Figure 4: North America Thermal Imaging Cores Volume (K), by Application 2025 & 2033
- Figure 5: North America Thermal Imaging Cores Revenue Share (%), by Application 2025 & 2033
- Figure 6: North America Thermal Imaging Cores Volume Share (%), by Application 2025 & 2033
- Figure 7: North America Thermal Imaging Cores Revenue (million), by Types 2025 & 2033
- Figure 8: North America Thermal Imaging Cores Volume (K), by Types 2025 & 2033
- Figure 9: North America Thermal Imaging Cores Revenue Share (%), by Types 2025 & 2033
- Figure 10: North America Thermal Imaging Cores Volume Share (%), by Types 2025 & 2033
- Figure 11: North America Thermal Imaging Cores Revenue (million), by Country 2025 & 2033
- Figure 12: North America Thermal Imaging Cores Volume (K), by Country 2025 & 2033
- Figure 13: North America Thermal Imaging Cores Revenue Share (%), by Country 2025 & 2033
- Figure 14: North America Thermal Imaging Cores Volume Share (%), by Country 2025 & 2033
- Figure 15: South America Thermal Imaging Cores Revenue (million), by Application 2025 & 2033
- Figure 16: South America Thermal Imaging Cores Volume (K), by Application 2025 & 2033
- Figure 17: South America Thermal Imaging Cores Revenue Share (%), by Application 2025 & 2033
- Figure 18: South America Thermal Imaging Cores Volume Share (%), by Application 2025 & 2033
- Figure 19: South America Thermal Imaging Cores Revenue (million), by Types 2025 & 2033
- Figure 20: South America Thermal Imaging Cores Volume (K), by Types 2025 & 2033
- Figure 21: South America Thermal Imaging Cores Revenue Share (%), by Types 2025 & 2033
- Figure 22: South America Thermal Imaging Cores Volume Share (%), by Types 2025 & 2033
- Figure 23: South America Thermal Imaging Cores Revenue (million), by Country 2025 & 2033
- Figure 24: South America Thermal Imaging Cores Volume (K), by Country 2025 & 2033
- Figure 25: South America Thermal Imaging Cores Revenue Share (%), by Country 2025 & 2033
- Figure 26: South America Thermal Imaging Cores Volume Share (%), by Country 2025 & 2033
- Figure 27: Europe Thermal Imaging Cores Revenue (million), by Application 2025 & 2033
- Figure 28: Europe Thermal Imaging Cores Volume (K), by Application 2025 & 2033
- Figure 29: Europe Thermal Imaging Cores Revenue Share (%), by Application 2025 & 2033
- Figure 30: Europe Thermal Imaging Cores Volume Share (%), by Application 2025 & 2033
- Figure 31: Europe Thermal Imaging Cores Revenue (million), by Types 2025 & 2033
- Figure 32: Europe Thermal Imaging Cores Volume (K), by Types 2025 & 2033
- Figure 33: Europe Thermal Imaging Cores Revenue Share (%), by Types 2025 & 2033
- Figure 34: Europe Thermal Imaging Cores Volume Share (%), by Types 2025 & 2033
- Figure 35: Europe Thermal Imaging Cores Revenue (million), by Country 2025 & 2033
- Figure 36: Europe Thermal Imaging Cores Volume (K), by Country 2025 & 2033
- Figure 37: Europe Thermal Imaging Cores Revenue Share (%), by Country 2025 & 2033
- Figure 38: Europe Thermal Imaging Cores Volume Share (%), by Country 2025 & 2033
- Figure 39: Middle East & Africa Thermal Imaging Cores Revenue (million), by Application 2025 & 2033
- Figure 40: Middle East & Africa Thermal Imaging Cores Volume (K), by Application 2025 & 2033
- Figure 41: Middle East & Africa Thermal Imaging Cores Revenue Share (%), by Application 2025 & 2033
- Figure 42: Middle East & Africa Thermal Imaging Cores Volume Share (%), by Application 2025 & 2033
- Figure 43: Middle East & Africa Thermal Imaging Cores Revenue (million), by Types 2025 & 2033
- Figure 44: Middle East & Africa Thermal Imaging Cores Volume (K), by Types 2025 & 2033
- Figure 45: Middle East & Africa Thermal Imaging Cores Revenue Share (%), by Types 2025 & 2033
- Figure 46: Middle East & Africa Thermal Imaging Cores Volume Share (%), by Types 2025 & 2033
- Figure 47: Middle East & Africa Thermal Imaging Cores Revenue (million), by Country 2025 & 2033
- Figure 48: Middle East & Africa Thermal Imaging Cores Volume (K), by Country 2025 & 2033
- Figure 49: Middle East & Africa Thermal Imaging Cores Revenue Share (%), by Country 2025 & 2033
- Figure 50: Middle East & Africa Thermal Imaging Cores Volume Share (%), by Country 2025 & 2033
- Figure 51: Asia Pacific Thermal Imaging Cores Revenue (million), by Application 2025 & 2033
- Figure 52: Asia Pacific Thermal Imaging Cores Volume (K), by Application 2025 & 2033
- Figure 53: Asia Pacific Thermal Imaging Cores Revenue Share (%), by Application 2025 & 2033
- Figure 54: Asia Pacific Thermal Imaging Cores Volume Share (%), by Application 2025 & 2033
- Figure 55: Asia Pacific Thermal Imaging Cores Revenue (million), by Types 2025 & 2033
- Figure 56: Asia Pacific Thermal Imaging Cores Volume (K), by Types 2025 & 2033
- Figure 57: Asia Pacific Thermal Imaging Cores Revenue Share (%), by Types 2025 & 2033
- Figure 58: Asia Pacific Thermal Imaging Cores Volume Share (%), by Types 2025 & 2033
- Figure 59: Asia Pacific Thermal Imaging Cores Revenue (million), by Country 2025 & 2033
- Figure 60: Asia Pacific Thermal Imaging Cores Volume (K), by Country 2025 & 2033
- Figure 61: Asia Pacific Thermal Imaging Cores Revenue Share (%), by Country 2025 & 2033
- Figure 62: Asia Pacific Thermal Imaging Cores Volume Share (%), by Country 2025 & 2033
List of Tables
- Table 1: Global Thermal Imaging Cores Revenue million Forecast, by Application 2020 & 2033
- Table 2: Global Thermal Imaging Cores Volume K Forecast, by Application 2020 & 2033
- Table 3: Global Thermal Imaging Cores Revenue million Forecast, by Types 2020 & 2033
- Table 4: Global Thermal Imaging Cores Volume K Forecast, by Types 2020 & 2033
- Table 5: Global Thermal Imaging Cores Revenue million Forecast, by Region 2020 & 2033
- Table 6: Global Thermal Imaging Cores Volume K Forecast, by Region 2020 & 2033
- Table 7: Global Thermal Imaging Cores Revenue million Forecast, by Application 2020 & 2033
- Table 8: Global Thermal Imaging Cores Volume K Forecast, by Application 2020 & 2033
- Table 9: Global Thermal Imaging Cores Revenue million Forecast, by Types 2020 & 2033
- Table 10: Global Thermal Imaging Cores Volume K Forecast, by Types 2020 & 2033
- Table 11: Global Thermal Imaging Cores Revenue million Forecast, by Country 2020 & 2033
- Table 12: Global Thermal Imaging Cores Volume K Forecast, by Country 2020 & 2033
- Table 13: United States Thermal Imaging Cores Revenue (million) Forecast, by Application 2020 & 2033
- Table 14: United States Thermal Imaging Cores Volume (K) Forecast, by Application 2020 & 2033
- Table 15: Canada Thermal Imaging Cores Revenue (million) Forecast, by Application 2020 & 2033
- Table 16: Canada Thermal Imaging Cores Volume (K) Forecast, by Application 2020 & 2033
- Table 17: Mexico Thermal Imaging Cores Revenue (million) Forecast, by Application 2020 & 2033
- Table 18: Mexico Thermal Imaging Cores Volume (K) Forecast, by Application 2020 & 2033
- Table 19: Global Thermal Imaging Cores Revenue million Forecast, by Application 2020 & 2033
- Table 20: Global Thermal Imaging Cores Volume K Forecast, by Application 2020 & 2033
- Table 21: Global Thermal Imaging Cores Revenue million Forecast, by Types 2020 & 2033
- Table 22: Global Thermal Imaging Cores Volume K Forecast, by Types 2020 & 2033
- Table 23: Global Thermal Imaging Cores Revenue million Forecast, by Country 2020 & 2033
- Table 24: Global Thermal Imaging Cores Volume K Forecast, by Country 2020 & 2033
- Table 25: Brazil Thermal Imaging Cores Revenue (million) Forecast, by Application 2020 & 2033
- Table 26: Brazil Thermal Imaging Cores Volume (K) Forecast, by Application 2020 & 2033
- Table 27: Argentina Thermal Imaging Cores Revenue (million) Forecast, by Application 2020 & 2033
- Table 28: Argentina Thermal Imaging Cores Volume (K) Forecast, by Application 2020 & 2033
- Table 29: Rest of South America Thermal Imaging Cores Revenue (million) Forecast, by Application 2020 & 2033
- Table 30: Rest of South America Thermal Imaging Cores Volume (K) Forecast, by Application 2020 & 2033
- Table 31: Global Thermal Imaging Cores Revenue million Forecast, by Application 2020 & 2033
- Table 32: Global Thermal Imaging Cores Volume K Forecast, by Application 2020 & 2033
- Table 33: Global Thermal Imaging Cores Revenue million Forecast, by Types 2020 & 2033
- Table 34: Global Thermal Imaging Cores Volume K Forecast, by Types 2020 & 2033
- Table 35: Global Thermal Imaging Cores Revenue million Forecast, by Country 2020 & 2033
- Table 36: Global Thermal Imaging Cores Volume K Forecast, by Country 2020 & 2033
- Table 37: United Kingdom Thermal Imaging Cores Revenue (million) Forecast, by Application 2020 & 2033
- Table 38: United Kingdom Thermal Imaging Cores Volume (K) Forecast, by Application 2020 & 2033
- Table 39: Germany Thermal Imaging Cores Revenue (million) Forecast, by Application 2020 & 2033
- Table 40: Germany Thermal Imaging Cores Volume (K) Forecast, by Application 2020 & 2033
- Table 41: France Thermal Imaging Cores Revenue (million) Forecast, by Application 2020 & 2033
- Table 42: France Thermal Imaging Cores Volume (K) Forecast, by Application 2020 & 2033
- Table 43: Italy Thermal Imaging Cores Revenue (million) Forecast, by Application 2020 & 2033
- Table 44: Italy Thermal Imaging Cores Volume (K) Forecast, by Application 2020 & 2033
- Table 45: Spain Thermal Imaging Cores Revenue (million) Forecast, by Application 2020 & 2033
- Table 46: Spain Thermal Imaging Cores Volume (K) Forecast, by Application 2020 & 2033
- Table 47: Russia Thermal Imaging Cores Revenue (million) Forecast, by Application 2020 & 2033
- Table 48: Russia Thermal Imaging Cores Volume (K) Forecast, by Application 2020 & 2033
- Table 49: Benelux Thermal Imaging Cores Revenue (million) Forecast, by Application 2020 & 2033
- Table 50: Benelux Thermal Imaging Cores Volume (K) Forecast, by Application 2020 & 2033
- Table 51: Nordics Thermal Imaging Cores Revenue (million) Forecast, by Application 2020 & 2033
- Table 52: Nordics Thermal Imaging Cores Volume (K) Forecast, by Application 2020 & 2033
- Table 53: Rest of Europe Thermal Imaging Cores Revenue (million) Forecast, by Application 2020 & 2033
- Table 54: Rest of Europe Thermal Imaging Cores Volume (K) Forecast, by Application 2020 & 2033
- Table 55: Global Thermal Imaging Cores Revenue million Forecast, by Application 2020 & 2033
- Table 56: Global Thermal Imaging Cores Volume K Forecast, by Application 2020 & 2033
- Table 57: Global Thermal Imaging Cores Revenue million Forecast, by Types 2020 & 2033
- Table 58: Global Thermal Imaging Cores Volume K Forecast, by Types 2020 & 2033
- Table 59: Global Thermal Imaging Cores Revenue million Forecast, by Country 2020 & 2033
- Table 60: Global Thermal Imaging Cores Volume K Forecast, by Country 2020 & 2033
- Table 61: Turkey Thermal Imaging Cores Revenue (million) Forecast, by Application 2020 & 2033
- Table 62: Turkey Thermal Imaging Cores Volume (K) Forecast, by Application 2020 & 2033
- Table 63: Israel Thermal Imaging Cores Revenue (million) Forecast, by Application 2020 & 2033
- Table 64: Israel Thermal Imaging Cores Volume (K) Forecast, by Application 2020 & 2033
- Table 65: GCC Thermal Imaging Cores Revenue (million) Forecast, by Application 2020 & 2033
- Table 66: GCC Thermal Imaging Cores Volume (K) Forecast, by Application 2020 & 2033
- Table 67: North Africa Thermal Imaging Cores Revenue (million) Forecast, by Application 2020 & 2033
- Table 68: North Africa Thermal Imaging Cores Volume (K) Forecast, by Application 2020 & 2033
- Table 69: South Africa Thermal Imaging Cores Revenue (million) Forecast, by Application 2020 & 2033
- Table 70: South Africa Thermal Imaging Cores Volume (K) Forecast, by Application 2020 & 2033
- Table 71: Rest of Middle East & Africa Thermal Imaging Cores Revenue (million) Forecast, by Application 2020 & 2033
- Table 72: Rest of Middle East & Africa Thermal Imaging Cores Volume (K) Forecast, by Application 2020 & 2033
- Table 73: Global Thermal Imaging Cores Revenue million Forecast, by Application 2020 & 2033
- Table 74: Global Thermal Imaging Cores Volume K Forecast, by Application 2020 & 2033
- Table 75: Global Thermal Imaging Cores Revenue million Forecast, by Types 2020 & 2033
- Table 76: Global Thermal Imaging Cores Volume K Forecast, by Types 2020 & 2033
- Table 77: Global Thermal Imaging Cores Revenue million Forecast, by Country 2020 & 2033
- Table 78: Global Thermal Imaging Cores Volume K Forecast, by Country 2020 & 2033
- Table 79: China Thermal Imaging Cores Revenue (million) Forecast, by Application 2020 & 2033
- Table 80: China Thermal Imaging Cores Volume (K) Forecast, by Application 2020 & 2033
- Table 81: India Thermal Imaging Cores Revenue (million) Forecast, by Application 2020 & 2033
- Table 82: India Thermal Imaging Cores Volume (K) Forecast, by Application 2020 & 2033
- Table 83: Japan Thermal Imaging Cores Revenue (million) Forecast, by Application 2020 & 2033
- Table 84: Japan Thermal Imaging Cores Volume (K) Forecast, by Application 2020 & 2033
- Table 85: South Korea Thermal Imaging Cores Revenue (million) Forecast, by Application 2020 & 2033
- Table 86: South Korea Thermal Imaging Cores Volume (K) Forecast, by Application 2020 & 2033
- Table 87: ASEAN Thermal Imaging Cores Revenue (million) Forecast, by Application 2020 & 2033
- Table 88: ASEAN Thermal Imaging Cores Volume (K) Forecast, by Application 2020 & 2033
- Table 89: Oceania Thermal Imaging Cores Revenue (million) Forecast, by Application 2020 & 2033
- Table 90: Oceania Thermal Imaging Cores Volume (K) Forecast, by Application 2020 & 2033
- Table 91: Rest of Asia Pacific Thermal Imaging Cores Revenue (million) Forecast, by Application 2020 & 2033
- Table 92: Rest of Asia Pacific Thermal Imaging Cores Volume (K) Forecast, by Application 2020 & 2033
Frequently Asked Questions
1. What is the projected Compound Annual Growth Rate (CAGR) of the Thermal Imaging Cores?
The projected CAGR is approximately XX%.
2. Which companies are prominent players in the Thermal Imaging Cores?
Key companies in the market include Opgal, BAE Systems, Microthermo Optoelectronics (Hangzhou), HUIRUI INFRARED, ULIRVISION, Acal BFi, iTherml Technology, MH Technology.
3. What are the main segments of the Thermal Imaging Cores?
The market segments include Application, Types.
4. Can you provide details about the market size?
The market size is estimated to be USD XXX million as of 2022.
5. What are some drivers contributing to market growth?
N/A
6. What are the notable trends driving market growth?
N/A
7. Are there any restraints impacting market growth?
N/A
8. Can you provide examples of recent developments in the market?
N/A
9. What pricing options are available for accessing the report?
Pricing options include single-user, multi-user, and enterprise licenses priced at USD 3350.00, USD 5025.00, and USD 6700.00 respectively.
10. Is the market size provided in terms of value or volume?
The market size is provided in terms of value, measured in million and volume, measured in K.
11. Are there any specific market keywords associated with the report?
Yes, the market keyword associated with the report is "Thermal Imaging Cores," which aids in identifying and referencing the specific market segment covered.
12. How do I determine which pricing option suits my needs best?
The pricing options vary based on user requirements and access needs. Individual users may opt for single-user licenses, while businesses requiring broader access may choose multi-user or enterprise licenses for cost-effective access to the report.
13. Are there any additional resources or data provided in the Thermal Imaging Cores report?
While the report offers comprehensive insights, it's advisable to review the specific contents or supplementary materials provided to ascertain if additional resources or data are available.
14. How can I stay updated on further developments or reports in the Thermal Imaging Cores?
To stay informed about further developments, trends, and reports in the Thermal Imaging Cores, consider subscribing to industry newsletters, following relevant companies and organizations, or regularly checking reputable industry news sources and publications.
Methodology
Step 1 - Identification of Relevant Samples Size from Population Database


Step 2 - Approaches for Defining Global Market Size (Value, Volume* & Price*)

Note*: In applicable scenarios
Step 3 - Data Sources
Primary Research
- Web Analytics
- Survey Reports
- Research Institute
- Latest Research Reports
- Opinion Leaders
Secondary Research
- Annual Reports
- White Paper
- Latest Press Release
- Industry Association
- Paid Database
- Investor Presentations

Step 4 - Data Triangulation
Involves using different sources of information in order to increase the validity of a study
These sources are likely to be stakeholders in a program - participants, other researchers, program staff, other community members, and so on.
Then we put all data in single framework & apply various statistical tools to find out the dynamic on the market.
During the analysis stage, feedback from the stakeholder groups would be compared to determine areas of agreement as well as areas of divergence