

Key Insights
The Thermal Long-Wave Infrared (LWIR) hyperspectral remote sensing market is poised for significant expansion, propelled by increasing demand across key sectors. Advancements in sensor technology, delivering higher resolution, enhanced sensitivity, and reduced costs, are primary market drivers. Defense and security applications, particularly for advanced target identification and surveillance, represent substantial growth segments. The burgeoning adoption of precision agriculture, sophisticated environmental monitoring solutions (including greenhouse gas detection and pollution analysis), and industrial process optimization further fuels market demand. A notable trend is the increasing integration and miniaturization of hyperspectral sensors into unmanned aerial vehicles (UAVs) and other agile platforms, thereby improving operational flexibility and data acquisition efficiency. The global market size was valued at 45 million in the base year of 2025 and is projected to grow at a Compound Annual Growth Rate (CAGR) of 3.8%.
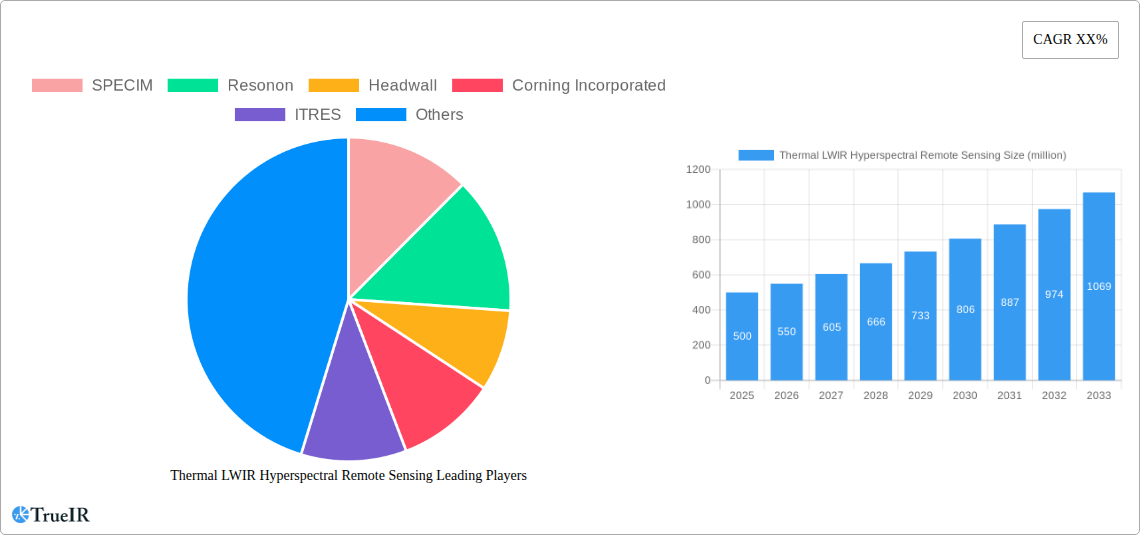
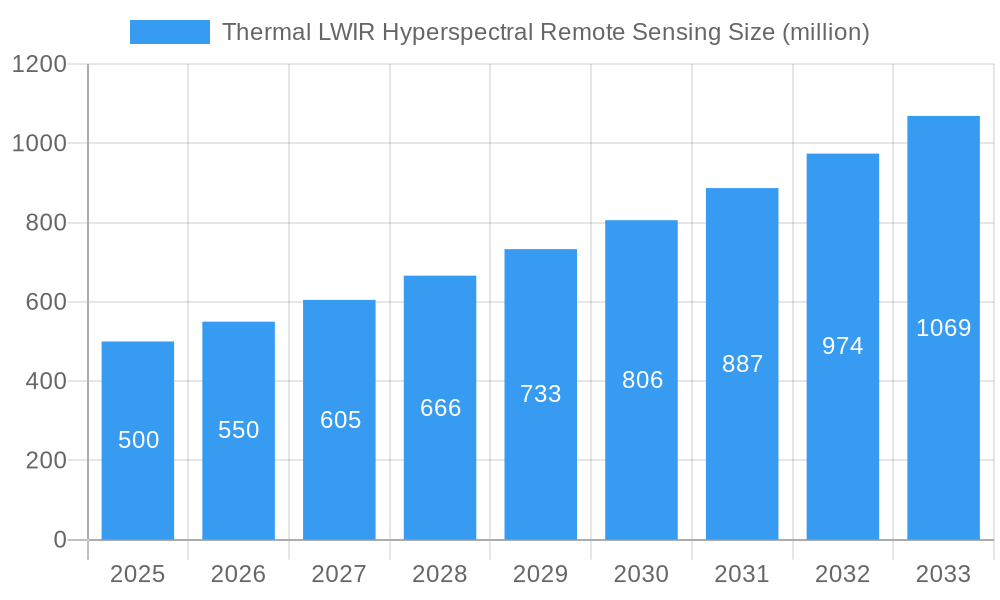
Thermal LWIR Hyperspectral Remote Sensing Market Size (In Million)
Market growth is tempered by certain constraints, including the substantial initial investment required for hyperspectral sensors and the necessity for specialized data processing expertise, which can impede broader market adoption. The intricate nature of hyperspectral data analysis and the requirement for advanced algorithms to derive actionable insights present further challenges. Despite these hurdles, continuous technological innovation, coupled with declining sensor prices and the development of intuitive data processing software, is anticipated to alleviate these limitations and foster wider market penetration. Leading industry players, including SPECIM, Resonon, and Headwall, are spearheading innovation through continuous improvements in sensor performance and the expansion of application domains. Emerging economies, with their expanding infrastructure requirements and growing environmental awareness, represent significant untapped potential for market expansion in the forecast period.
Thermal LWIR Hyperspectral Remote Sensing Company Market Share
Thermal LWIR Hyperspectral Remote Sensing Market Report: 2019-2033
This comprehensive report provides an in-depth analysis of the global Thermal LWIR Hyperspectral Remote Sensing market, offering valuable insights for businesses, investors, and researchers. With a detailed examination spanning the historical period (2019-2024), base year (2025), and forecast period (2025-2033), this report projects a market exceeding $XX million by 2033, driven by significant technological advancements and increasing demand across diverse sectors. The study period covers 2019-2033, with 2025 serving as both the base and estimated year.
Thermal LWIR Hyperspectral Remote Sensing Market Structure & Competitive Landscape
The Thermal LWIR Hyperspectral Remote Sensing market exhibits a moderately concentrated structure, with several key players holding significant market share. The Herfindahl-Hirschman Index (HHI) is estimated at xx, indicating a moderately competitive landscape. Innovation is a crucial driver, with companies constantly developing advanced sensors, improved algorithms, and more efficient data processing techniques. Regulatory frameworks concerning data privacy and security significantly influence market growth, particularly in defense and surveillance applications. The market faces competition from alternative technologies like multispectral imaging, but hyperspectral's superior spectral resolution provides a strong competitive advantage.
End-user segments include defense & security, environmental monitoring, industrial inspection, and medical diagnostics. The report analyzes the market share of each segment and predicts substantial growth in environmental monitoring and industrial applications in the coming years. M&A activity in the past five years has seen approximately xx million USD in transactions, indicating consolidation and strategic expansion among leading players.
- Market Concentration: HHI estimated at xx.
- Key Innovation Drivers: Advanced sensor technology, improved algorithms, data processing efficiency.
- Regulatory Impacts: Data privacy and security regulations are increasingly influential.
- Product Substitutes: Multispectral imaging, but hyperspectral maintains its superior resolution advantage.
- End-User Segmentation: Defense & security, environmental monitoring, industrial inspection, medical diagnostics.
- M&A Trends: Approximately xx million USD in transactions over the past five years.
Thermal LWIR Hyperspectral Remote Sensing Market Trends & Opportunities
The global Thermal LWIR Hyperspectral Remote Sensing market is experiencing robust growth, with a projected CAGR of xx% during the forecast period (2025-2033). This expansion is driven by factors like the increasing demand for high-resolution spectral imaging across various applications, coupled with technological advancements resulting in reduced costs and enhanced performance. The market penetration rate for Thermal LWIR Hyperspectral Remote Sensing is currently estimated at xx%, with significant potential for growth across emerging economies. The market size is projected to surpass $xx million by 2033. Technological shifts towards miniaturization, improved spectral range, and more efficient data processing are key factors driving adoption. Competitive dynamics are intense, with ongoing innovation and product differentiation playing crucial roles in market share acquisition. Consumer preferences are shifting toward higher performance, more compact devices, and cost-effective solutions.
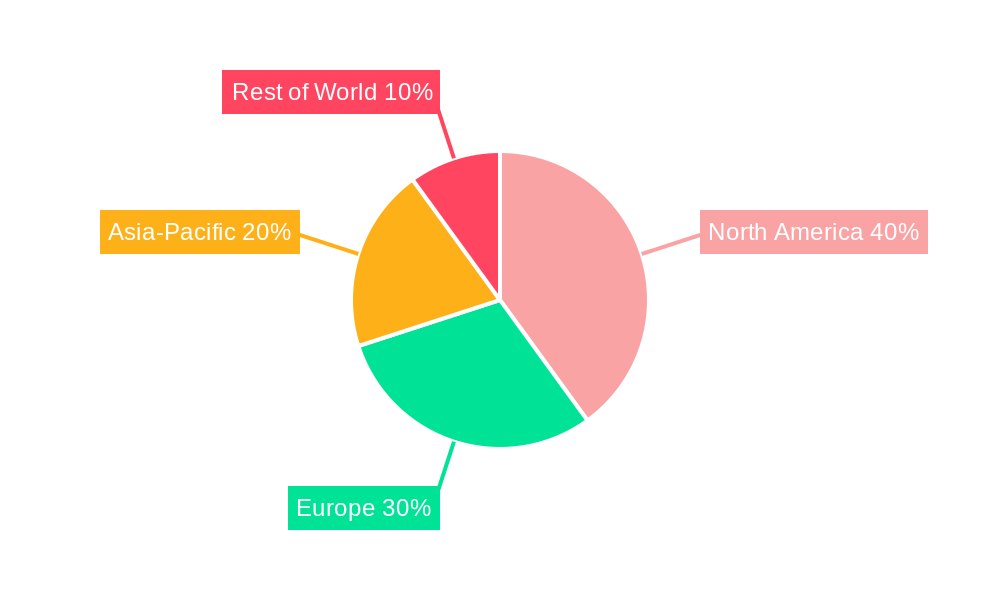
Dominant Markets & Segments in Thermal LWIR Hyperspectral Remote Sensing
The North American region currently holds the dominant position in the Thermal LWIR Hyperspectral Remote Sensing market, accounting for approximately xx% of the global market share in 2025. This dominance is attributed to the significant presence of major players, robust research and development activities, and substantial government spending in defense and environmental monitoring. Europe and Asia-Pacific regions are expected to witness significant growth during the forecast period, fueled by increasing industrial investments and government initiatives to promote technological advancements.
- North America: Strong presence of key players, high R&D investment, significant government spending.
- Europe: Growing investments in industrial applications and environmental monitoring.
- Asia-Pacific: Rapid industrialization and increasing government initiatives driving market growth.
Thermal LWIR Hyperspectral Remote Sensing Product Analysis
Significant technological advancements have led to the development of more compact, lighter, and energy-efficient thermal LWIR hyperspectral sensors. These advancements have broadened the applicability of the technology, expanding into new markets, and making it more affordable and accessible for a wider range of users. Improved algorithms enhance data processing speed and accuracy. The competitive advantage lies in the precision of spectral information captured, enabling improved analysis and decision-making across multiple applications.
Key Drivers, Barriers & Challenges in Thermal LWIR Hyperspectral Remote Sensing
Key Drivers: Advancements in sensor technology (improved sensitivity, resolution, and spectral range), increased demand for precise spectral data across various sectors (environmental monitoring, defense, industrial inspection), and supportive government regulations and funding for R&D in specific applications are key growth drivers.
Key Challenges: High initial costs of systems, complex data processing and analysis requirements, and limitations in miniaturization and power consumption present challenges. Supply chain disruptions due to geopolitical factors or material shortages can also impact production and availability.
Growth Drivers in the Thermal LWIR Hyperspectral Remote Sensing Market
Technological advancements continue to drive market expansion, enabling the development of more compact, robust, and affordable systems. Increasing demand across diverse sectors such as environmental monitoring and precision agriculture significantly contributes to growth. Supportive government policies and funding for R&D further accelerate market expansion.
Challenges Impacting Thermal LWIR Hyperspectral Remote Sensing Growth
High initial investment costs remain a significant barrier to entry for many potential users. Complex data analysis requirements necessitate specialized expertise, adding to the overall cost and limiting wider adoption. Supply chain uncertainties and potential material shortages can disrupt production and increase prices. Stringent regulatory environments in certain sectors can also pose challenges.
Significant Thermal LWIR Hyperspectral Remote Sensing Industry Milestones
- 2020: SPECIM launches a new generation of compact hyperspectral cameras.
- 2021: Resonon introduces advanced algorithms for improved data processing.
- 2022: Headwall announces a strategic partnership for enhanced sensor technology.
- 2023: A major merger occurs between two key players in the market (specific details will be included in the full report).
- 2024: Significant advancements in miniaturization and power efficiency are showcased at industry conferences.
Future Outlook for Thermal LWIR Hyperspectral Remote Sensing Market
The Thermal LWIR Hyperspectral Remote Sensing market is poised for continued growth, driven by technological advancements, increasing demand from diverse sectors, and supportive government policies. Strategic partnerships and collaborations among key players will further stimulate innovation and market expansion. Opportunities exist in emerging applications, such as precision agriculture and medical diagnostics, leading to substantial market expansion in the years to come. The market is expected to reach significant value by 2033 with ongoing expansion in multiple sectors.
Thermal LWIR Hyperspectral Remote Sensing Segmentation
-
1. Application
- 1.1. Commercial Enterprises
- 1.2. Defense Organizations
- 1.3. Research Institutions
-
2. Types
- 2.1. Common Type
- 2.2. Airborne Type
Thermal LWIR Hyperspectral Remote Sensing Segmentation By Geography
-
1. North America
- 1.1. United States
- 1.2. Canada
- 1.3. Mexico
-
2. South America
- 2.1. Brazil
- 2.2. Argentina
- 2.3. Rest of South America
-
3. Europe
- 3.1. United Kingdom
- 3.2. Germany
- 3.3. France
- 3.4. Italy
- 3.5. Spain
- 3.6. Russia
- 3.7. Benelux
- 3.8. Nordics
- 3.9. Rest of Europe
-
4. Middle East & Africa
- 4.1. Turkey
- 4.2. Israel
- 4.3. GCC
- 4.4. North Africa
- 4.5. South Africa
- 4.6. Rest of Middle East & Africa
-
5. Asia Pacific
- 5.1. China
- 5.2. India
- 5.3. Japan
- 5.4. South Korea
- 5.5. ASEAN
- 5.6. Oceania
- 5.7. Rest of Asia Pacific
Thermal LWIR Hyperspectral Remote Sensing Regional Market Share
Geographic Coverage of Thermal LWIR Hyperspectral Remote Sensing
Thermal LWIR Hyperspectral Remote Sensing REPORT HIGHLIGHTS
| Aspects | Details |
|---|---|
| Study Period | 2020-2034 |
| Base Year | 2025 |
| Estimated Year | 2026 |
| Forecast Period | 2026-2034 |
| Historical Period | 2020-2025 |
| Growth Rate | CAGR of 3.8% from 2020-2034 |
| Segmentation |
|
Table of Contents
- 1. Introduction
- 1.1. Research Scope
- 1.2. Market Segmentation
- 1.3. Research Objective
- 1.4. Definitions and Assumptions
- 2. Executive Summary
- 2.1. Market Snapshot
- 3. Market Dynamics
- 3.1. Market Drivers
- 3.2. Market Restrains
- 3.3. Market Trends
- 3.4. Market Opportunities
- 4. Market Factor Analysis
- 4.1. Porters Five Forces
- 4.1.1. Bargaining Power of Suppliers
- 4.1.2. Bargaining Power of Buyers
- 4.1.3. Threat of New Entrants
- 4.1.4. Threat of Substitutes
- 4.1.5. Competitive Rivalry
- 4.2. PESTEL analysis
- 4.3. BCG Analysis
- 4.3.1. Stars (High Growth, High Market Share)
- 4.3.2. Cash Cows (Low Growth, High Market Share)
- 4.3.3. Question Mark (High Growth, Low Market Share)
- 4.3.4. Dogs (Low Growth, Low Market Share)
- 4.4. Ansoff Matrix Analysis
- 4.5. Supply Chain Analysis
- 4.6. Regulatory Landscape
- 4.7. Current Market Potential and Opportunity Assessment (TAM–SAM–SOM Framework)
- 4.8. TIR Analyst Note
- 4.1. Porters Five Forces
- 5. Market Analysis, Insights and Forecast 2021-2033
- 5.1. Market Analysis, Insights and Forecast - by Application
- 5.1.1. Commercial Enterprises
- 5.1.2. Defense Organizations
- 5.1.3. Research Institutions
- 5.2. Market Analysis, Insights and Forecast - by Types
- 5.2.1. Common Type
- 5.2.2. Airborne Type
- 5.3. Market Analysis, Insights and Forecast - by Region
- 5.3.1. North America
- 5.3.2. South America
- 5.3.3. Europe
- 5.3.4. Middle East & Africa
- 5.3.5. Asia Pacific
- 5.1. Market Analysis, Insights and Forecast - by Application
- 6. Global Thermal LWIR Hyperspectral Remote Sensing Analysis, Insights and Forecast, 2021-2033
- 6.1. Market Analysis, Insights and Forecast - by Application
- 6.1.1. Commercial Enterprises
- 6.1.2. Defense Organizations
- 6.1.3. Research Institutions
- 6.2. Market Analysis, Insights and Forecast - by Types
- 6.2.1. Common Type
- 6.2.2. Airborne Type
- 6.1. Market Analysis, Insights and Forecast - by Application
- 7. North America Thermal LWIR Hyperspectral Remote Sensing Analysis, Insights and Forecast, 2020-2032
- 7.1. Market Analysis, Insights and Forecast - by Application
- 7.1.1. Commercial Enterprises
- 7.1.2. Defense Organizations
- 7.1.3. Research Institutions
- 7.2. Market Analysis, Insights and Forecast - by Types
- 7.2.1. Common Type
- 7.2.2. Airborne Type
- 7.1. Market Analysis, Insights and Forecast - by Application
- 8. South America Thermal LWIR Hyperspectral Remote Sensing Analysis, Insights and Forecast, 2020-2032
- 8.1. Market Analysis, Insights and Forecast - by Application
- 8.1.1. Commercial Enterprises
- 8.1.2. Defense Organizations
- 8.1.3. Research Institutions
- 8.2. Market Analysis, Insights and Forecast - by Types
- 8.2.1. Common Type
- 8.2.2. Airborne Type
- 8.1. Market Analysis, Insights and Forecast - by Application
- 9. Europe Thermal LWIR Hyperspectral Remote Sensing Analysis, Insights and Forecast, 2020-2032
- 9.1. Market Analysis, Insights and Forecast - by Application
- 9.1.1. Commercial Enterprises
- 9.1.2. Defense Organizations
- 9.1.3. Research Institutions
- 9.2. Market Analysis, Insights and Forecast - by Types
- 9.2.1. Common Type
- 9.2.2. Airborne Type
- 9.1. Market Analysis, Insights and Forecast - by Application
- 10. Middle East & Africa Thermal LWIR Hyperspectral Remote Sensing Analysis, Insights and Forecast, 2020-2032
- 10.1. Market Analysis, Insights and Forecast - by Application
- 10.1.1. Commercial Enterprises
- 10.1.2. Defense Organizations
- 10.1.3. Research Institutions
- 10.2. Market Analysis, Insights and Forecast - by Types
- 10.2.1. Common Type
- 10.2.2. Airborne Type
- 10.1. Market Analysis, Insights and Forecast - by Application
- 11. Asia Pacific Thermal LWIR Hyperspectral Remote Sensing Analysis, Insights and Forecast, 2020-2032
- 11.1. Market Analysis, Insights and Forecast - by Application
- 11.1.1. Commercial Enterprises
- 11.1.2. Defense Organizations
- 11.1.3. Research Institutions
- 11.2. Market Analysis, Insights and Forecast - by Types
- 11.2.1. Common Type
- 11.2.2. Airborne Type
- 11.1. Market Analysis, Insights and Forecast - by Application
- 12. Competitive Analysis
- 12.1. Company Profiles
- 12.1.1 SPECIM
- 12.1.1.1. Company Overview
- 12.1.1.2. Products
- 12.1.1.3. Company Financials
- 12.1.1.4. SWOT Analysis
- 12.1.2 Resonon
- 12.1.2.1. Company Overview
- 12.1.2.2. Products
- 12.1.2.3. Company Financials
- 12.1.2.4. SWOT Analysis
- 12.1.3 Headwall
- 12.1.3.1. Company Overview
- 12.1.3.2. Products
- 12.1.3.3. Company Financials
- 12.1.3.4. SWOT Analysis
- 12.1.4 Corning Incorporated
- 12.1.4.1. Company Overview
- 12.1.4.2. Products
- 12.1.4.3. Company Financials
- 12.1.4.4. SWOT Analysis
- 12.1.5 ITRES
- 12.1.5.1. Company Overview
- 12.1.5.2. Products
- 12.1.5.3. Company Financials
- 12.1.5.4. SWOT Analysis
- 12.1.6 Norsk Elektro Optikk
- 12.1.6.1. Company Overview
- 12.1.6.2. Products
- 12.1.6.3. Company Financials
- 12.1.6.4. SWOT Analysis
- 12.1.7 Surface Optics Corp
- 12.1.7.1. Company Overview
- 12.1.7.2. Products
- 12.1.7.3. Company Financials
- 12.1.7.4. SWOT Analysis
- 12.1.8 Telops
- 12.1.8.1. Company Overview
- 12.1.8.2. Products
- 12.1.8.3. Company Financials
- 12.1.8.4. SWOT Analysis
- 12.1.9 Brimrose Corporation
- 12.1.9.1. Company Overview
- 12.1.9.2. Products
- 12.1.9.3. Company Financials
- 12.1.9.4. SWOT Analysis
- 12.1.10 BaySpec
- 12.1.10.1. Company Overview
- 12.1.10.2. Products
- 12.1.10.3. Company Financials
- 12.1.10.4. SWOT Analysis
- 12.1.11 XIMEA
- 12.1.11.1. Company Overview
- 12.1.11.2. Products
- 12.1.11.3. Company Financials
- 12.1.11.4. SWOT Analysis
- 12.1.12 RIKOLA
- 12.1.12.1. Company Overview
- 12.1.12.2. Products
- 12.1.12.3. Company Financials
- 12.1.12.4. SWOT Analysis
- 12.1.13 CI Systems
- 12.1.13.1. Company Overview
- 12.1.13.2. Products
- 12.1.13.3. Company Financials
- 12.1.13.4. SWOT Analysis
- 12.1.14 Cubert GmbH
- 12.1.14.1. Company Overview
- 12.1.14.2. Products
- 12.1.14.3. Company Financials
- 12.1.14.4. SWOT Analysis
- 12.1.15 Applied Infrared Sensing
- 12.1.15.1. Company Overview
- 12.1.15.2. Products
- 12.1.15.3. Company Financials
- 12.1.15.4. SWOT Analysis
- 12.1.1 SPECIM
- 12.2. Market Entropy
- 12.2.1 Company's Key Areas Served
- 12.2.2 Recent Developments
- 12.3. Company Market Share Analysis 2025
- 12.3.1 Top 5 Companies Market Share Analysis
- 12.3.2 Top 3 Companies Market Share Analysis
- 12.4. List of Potential Customers
- 13. Research Methodology
List of Figures
- Figure 1: Global Thermal LWIR Hyperspectral Remote Sensing Revenue Breakdown (million, %) by Region 2025 & 2033
- Figure 2: Global Thermal LWIR Hyperspectral Remote Sensing Volume Breakdown (K, %) by Region 2025 & 2033
- Figure 3: North America Thermal LWIR Hyperspectral Remote Sensing Revenue (million), by Application 2025 & 2033
- Figure 4: North America Thermal LWIR Hyperspectral Remote Sensing Volume (K), by Application 2025 & 2033
- Figure 5: North America Thermal LWIR Hyperspectral Remote Sensing Revenue Share (%), by Application 2025 & 2033
- Figure 6: North America Thermal LWIR Hyperspectral Remote Sensing Volume Share (%), by Application 2025 & 2033
- Figure 7: North America Thermal LWIR Hyperspectral Remote Sensing Revenue (million), by Types 2025 & 2033
- Figure 8: North America Thermal LWIR Hyperspectral Remote Sensing Volume (K), by Types 2025 & 2033
- Figure 9: North America Thermal LWIR Hyperspectral Remote Sensing Revenue Share (%), by Types 2025 & 2033
- Figure 10: North America Thermal LWIR Hyperspectral Remote Sensing Volume Share (%), by Types 2025 & 2033
- Figure 11: North America Thermal LWIR Hyperspectral Remote Sensing Revenue (million), by Country 2025 & 2033
- Figure 12: North America Thermal LWIR Hyperspectral Remote Sensing Volume (K), by Country 2025 & 2033
- Figure 13: North America Thermal LWIR Hyperspectral Remote Sensing Revenue Share (%), by Country 2025 & 2033
- Figure 14: North America Thermal LWIR Hyperspectral Remote Sensing Volume Share (%), by Country 2025 & 2033
- Figure 15: South America Thermal LWIR Hyperspectral Remote Sensing Revenue (million), by Application 2025 & 2033
- Figure 16: South America Thermal LWIR Hyperspectral Remote Sensing Volume (K), by Application 2025 & 2033
- Figure 17: South America Thermal LWIR Hyperspectral Remote Sensing Revenue Share (%), by Application 2025 & 2033
- Figure 18: South America Thermal LWIR Hyperspectral Remote Sensing Volume Share (%), by Application 2025 & 2033
- Figure 19: South America Thermal LWIR Hyperspectral Remote Sensing Revenue (million), by Types 2025 & 2033
- Figure 20: South America Thermal LWIR Hyperspectral Remote Sensing Volume (K), by Types 2025 & 2033
- Figure 21: South America Thermal LWIR Hyperspectral Remote Sensing Revenue Share (%), by Types 2025 & 2033
- Figure 22: South America Thermal LWIR Hyperspectral Remote Sensing Volume Share (%), by Types 2025 & 2033
- Figure 23: South America Thermal LWIR Hyperspectral Remote Sensing Revenue (million), by Country 2025 & 2033
- Figure 24: South America Thermal LWIR Hyperspectral Remote Sensing Volume (K), by Country 2025 & 2033
- Figure 25: South America Thermal LWIR Hyperspectral Remote Sensing Revenue Share (%), by Country 2025 & 2033
- Figure 26: South America Thermal LWIR Hyperspectral Remote Sensing Volume Share (%), by Country 2025 & 2033
- Figure 27: Europe Thermal LWIR Hyperspectral Remote Sensing Revenue (million), by Application 2025 & 2033
- Figure 28: Europe Thermal LWIR Hyperspectral Remote Sensing Volume (K), by Application 2025 & 2033
- Figure 29: Europe Thermal LWIR Hyperspectral Remote Sensing Revenue Share (%), by Application 2025 & 2033
- Figure 30: Europe Thermal LWIR Hyperspectral Remote Sensing Volume Share (%), by Application 2025 & 2033
- Figure 31: Europe Thermal LWIR Hyperspectral Remote Sensing Revenue (million), by Types 2025 & 2033
- Figure 32: Europe Thermal LWIR Hyperspectral Remote Sensing Volume (K), by Types 2025 & 2033
- Figure 33: Europe Thermal LWIR Hyperspectral Remote Sensing Revenue Share (%), by Types 2025 & 2033
- Figure 34: Europe Thermal LWIR Hyperspectral Remote Sensing Volume Share (%), by Types 2025 & 2033
- Figure 35: Europe Thermal LWIR Hyperspectral Remote Sensing Revenue (million), by Country 2025 & 2033
- Figure 36: Europe Thermal LWIR Hyperspectral Remote Sensing Volume (K), by Country 2025 & 2033
- Figure 37: Europe Thermal LWIR Hyperspectral Remote Sensing Revenue Share (%), by Country 2025 & 2033
- Figure 38: Europe Thermal LWIR Hyperspectral Remote Sensing Volume Share (%), by Country 2025 & 2033
- Figure 39: Middle East & Africa Thermal LWIR Hyperspectral Remote Sensing Revenue (million), by Application 2025 & 2033
- Figure 40: Middle East & Africa Thermal LWIR Hyperspectral Remote Sensing Volume (K), by Application 2025 & 2033
- Figure 41: Middle East & Africa Thermal LWIR Hyperspectral Remote Sensing Revenue Share (%), by Application 2025 & 2033
- Figure 42: Middle East & Africa Thermal LWIR Hyperspectral Remote Sensing Volume Share (%), by Application 2025 & 2033
- Figure 43: Middle East & Africa Thermal LWIR Hyperspectral Remote Sensing Revenue (million), by Types 2025 & 2033
- Figure 44: Middle East & Africa Thermal LWIR Hyperspectral Remote Sensing Volume (K), by Types 2025 & 2033
- Figure 45: Middle East & Africa Thermal LWIR Hyperspectral Remote Sensing Revenue Share (%), by Types 2025 & 2033
- Figure 46: Middle East & Africa Thermal LWIR Hyperspectral Remote Sensing Volume Share (%), by Types 2025 & 2033
- Figure 47: Middle East & Africa Thermal LWIR Hyperspectral Remote Sensing Revenue (million), by Country 2025 & 2033
- Figure 48: Middle East & Africa Thermal LWIR Hyperspectral Remote Sensing Volume (K), by Country 2025 & 2033
- Figure 49: Middle East & Africa Thermal LWIR Hyperspectral Remote Sensing Revenue Share (%), by Country 2025 & 2033
- Figure 50: Middle East & Africa Thermal LWIR Hyperspectral Remote Sensing Volume Share (%), by Country 2025 & 2033
- Figure 51: Asia Pacific Thermal LWIR Hyperspectral Remote Sensing Revenue (million), by Application 2025 & 2033
- Figure 52: Asia Pacific Thermal LWIR Hyperspectral Remote Sensing Volume (K), by Application 2025 & 2033
- Figure 53: Asia Pacific Thermal LWIR Hyperspectral Remote Sensing Revenue Share (%), by Application 2025 & 2033
- Figure 54: Asia Pacific Thermal LWIR Hyperspectral Remote Sensing Volume Share (%), by Application 2025 & 2033
- Figure 55: Asia Pacific Thermal LWIR Hyperspectral Remote Sensing Revenue (million), by Types 2025 & 2033
- Figure 56: Asia Pacific Thermal LWIR Hyperspectral Remote Sensing Volume (K), by Types 2025 & 2033
- Figure 57: Asia Pacific Thermal LWIR Hyperspectral Remote Sensing Revenue Share (%), by Types 2025 & 2033
- Figure 58: Asia Pacific Thermal LWIR Hyperspectral Remote Sensing Volume Share (%), by Types 2025 & 2033
- Figure 59: Asia Pacific Thermal LWIR Hyperspectral Remote Sensing Revenue (million), by Country 2025 & 2033
- Figure 60: Asia Pacific Thermal LWIR Hyperspectral Remote Sensing Volume (K), by Country 2025 & 2033
- Figure 61: Asia Pacific Thermal LWIR Hyperspectral Remote Sensing Revenue Share (%), by Country 2025 & 2033
- Figure 62: Asia Pacific Thermal LWIR Hyperspectral Remote Sensing Volume Share (%), by Country 2025 & 2033
List of Tables
- Table 1: Global Thermal LWIR Hyperspectral Remote Sensing Revenue million Forecast, by Application 2020 & 2033
- Table 2: Global Thermal LWIR Hyperspectral Remote Sensing Volume K Forecast, by Application 2020 & 2033
- Table 3: Global Thermal LWIR Hyperspectral Remote Sensing Revenue million Forecast, by Types 2020 & 2033
- Table 4: Global Thermal LWIR Hyperspectral Remote Sensing Volume K Forecast, by Types 2020 & 2033
- Table 5: Global Thermal LWIR Hyperspectral Remote Sensing Revenue million Forecast, by Region 2020 & 2033
- Table 6: Global Thermal LWIR Hyperspectral Remote Sensing Volume K Forecast, by Region 2020 & 2033
- Table 7: Global Thermal LWIR Hyperspectral Remote Sensing Revenue million Forecast, by Application 2020 & 2033
- Table 8: Global Thermal LWIR Hyperspectral Remote Sensing Volume K Forecast, by Application 2020 & 2033
- Table 9: Global Thermal LWIR Hyperspectral Remote Sensing Revenue million Forecast, by Types 2020 & 2033
- Table 10: Global Thermal LWIR Hyperspectral Remote Sensing Volume K Forecast, by Types 2020 & 2033
- Table 11: Global Thermal LWIR Hyperspectral Remote Sensing Revenue million Forecast, by Country 2020 & 2033
- Table 12: Global Thermal LWIR Hyperspectral Remote Sensing Volume K Forecast, by Country 2020 & 2033
- Table 13: United States Thermal LWIR Hyperspectral Remote Sensing Revenue (million) Forecast, by Application 2020 & 2033
- Table 14: United States Thermal LWIR Hyperspectral Remote Sensing Volume (K) Forecast, by Application 2020 & 2033
- Table 15: Canada Thermal LWIR Hyperspectral Remote Sensing Revenue (million) Forecast, by Application 2020 & 2033
- Table 16: Canada Thermal LWIR Hyperspectral Remote Sensing Volume (K) Forecast, by Application 2020 & 2033
- Table 17: Mexico Thermal LWIR Hyperspectral Remote Sensing Revenue (million) Forecast, by Application 2020 & 2033
- Table 18: Mexico Thermal LWIR Hyperspectral Remote Sensing Volume (K) Forecast, by Application 2020 & 2033
- Table 19: Global Thermal LWIR Hyperspectral Remote Sensing Revenue million Forecast, by Application 2020 & 2033
- Table 20: Global Thermal LWIR Hyperspectral Remote Sensing Volume K Forecast, by Application 2020 & 2033
- Table 21: Global Thermal LWIR Hyperspectral Remote Sensing Revenue million Forecast, by Types 2020 & 2033
- Table 22: Global Thermal LWIR Hyperspectral Remote Sensing Volume K Forecast, by Types 2020 & 2033
- Table 23: Global Thermal LWIR Hyperspectral Remote Sensing Revenue million Forecast, by Country 2020 & 2033
- Table 24: Global Thermal LWIR Hyperspectral Remote Sensing Volume K Forecast, by Country 2020 & 2033
- Table 25: Brazil Thermal LWIR Hyperspectral Remote Sensing Revenue (million) Forecast, by Application 2020 & 2033
- Table 26: Brazil Thermal LWIR Hyperspectral Remote Sensing Volume (K) Forecast, by Application 2020 & 2033
- Table 27: Argentina Thermal LWIR Hyperspectral Remote Sensing Revenue (million) Forecast, by Application 2020 & 2033
- Table 28: Argentina Thermal LWIR Hyperspectral Remote Sensing Volume (K) Forecast, by Application 2020 & 2033
- Table 29: Rest of South America Thermal LWIR Hyperspectral Remote Sensing Revenue (million) Forecast, by Application 2020 & 2033
- Table 30: Rest of South America Thermal LWIR Hyperspectral Remote Sensing Volume (K) Forecast, by Application 2020 & 2033
- Table 31: Global Thermal LWIR Hyperspectral Remote Sensing Revenue million Forecast, by Application 2020 & 2033
- Table 32: Global Thermal LWIR Hyperspectral Remote Sensing Volume K Forecast, by Application 2020 & 2033
- Table 33: Global Thermal LWIR Hyperspectral Remote Sensing Revenue million Forecast, by Types 2020 & 2033
- Table 34: Global Thermal LWIR Hyperspectral Remote Sensing Volume K Forecast, by Types 2020 & 2033
- Table 35: Global Thermal LWIR Hyperspectral Remote Sensing Revenue million Forecast, by Country 2020 & 2033
- Table 36: Global Thermal LWIR Hyperspectral Remote Sensing Volume K Forecast, by Country 2020 & 2033
- Table 37: United Kingdom Thermal LWIR Hyperspectral Remote Sensing Revenue (million) Forecast, by Application 2020 & 2033
- Table 38: United Kingdom Thermal LWIR Hyperspectral Remote Sensing Volume (K) Forecast, by Application 2020 & 2033
- Table 39: Germany Thermal LWIR Hyperspectral Remote Sensing Revenue (million) Forecast, by Application 2020 & 2033
- Table 40: Germany Thermal LWIR Hyperspectral Remote Sensing Volume (K) Forecast, by Application 2020 & 2033
- Table 41: France Thermal LWIR Hyperspectral Remote Sensing Revenue (million) Forecast, by Application 2020 & 2033
- Table 42: France Thermal LWIR Hyperspectral Remote Sensing Volume (K) Forecast, by Application 2020 & 2033
- Table 43: Italy Thermal LWIR Hyperspectral Remote Sensing Revenue (million) Forecast, by Application 2020 & 2033
- Table 44: Italy Thermal LWIR Hyperspectral Remote Sensing Volume (K) Forecast, by Application 2020 & 2033
- Table 45: Spain Thermal LWIR Hyperspectral Remote Sensing Revenue (million) Forecast, by Application 2020 & 2033
- Table 46: Spain Thermal LWIR Hyperspectral Remote Sensing Volume (K) Forecast, by Application 2020 & 2033
- Table 47: Russia Thermal LWIR Hyperspectral Remote Sensing Revenue (million) Forecast, by Application 2020 & 2033
- Table 48: Russia Thermal LWIR Hyperspectral Remote Sensing Volume (K) Forecast, by Application 2020 & 2033
- Table 49: Benelux Thermal LWIR Hyperspectral Remote Sensing Revenue (million) Forecast, by Application 2020 & 2033
- Table 50: Benelux Thermal LWIR Hyperspectral Remote Sensing Volume (K) Forecast, by Application 2020 & 2033
- Table 51: Nordics Thermal LWIR Hyperspectral Remote Sensing Revenue (million) Forecast, by Application 2020 & 2033
- Table 52: Nordics Thermal LWIR Hyperspectral Remote Sensing Volume (K) Forecast, by Application 2020 & 2033
- Table 53: Rest of Europe Thermal LWIR Hyperspectral Remote Sensing Revenue (million) Forecast, by Application 2020 & 2033
- Table 54: Rest of Europe Thermal LWIR Hyperspectral Remote Sensing Volume (K) Forecast, by Application 2020 & 2033
- Table 55: Global Thermal LWIR Hyperspectral Remote Sensing Revenue million Forecast, by Application 2020 & 2033
- Table 56: Global Thermal LWIR Hyperspectral Remote Sensing Volume K Forecast, by Application 2020 & 2033
- Table 57: Global Thermal LWIR Hyperspectral Remote Sensing Revenue million Forecast, by Types 2020 & 2033
- Table 58: Global Thermal LWIR Hyperspectral Remote Sensing Volume K Forecast, by Types 2020 & 2033
- Table 59: Global Thermal LWIR Hyperspectral Remote Sensing Revenue million Forecast, by Country 2020 & 2033
- Table 60: Global Thermal LWIR Hyperspectral Remote Sensing Volume K Forecast, by Country 2020 & 2033
- Table 61: Turkey Thermal LWIR Hyperspectral Remote Sensing Revenue (million) Forecast, by Application 2020 & 2033
- Table 62: Turkey Thermal LWIR Hyperspectral Remote Sensing Volume (K) Forecast, by Application 2020 & 2033
- Table 63: Israel Thermal LWIR Hyperspectral Remote Sensing Revenue (million) Forecast, by Application 2020 & 2033
- Table 64: Israel Thermal LWIR Hyperspectral Remote Sensing Volume (K) Forecast, by Application 2020 & 2033
- Table 65: GCC Thermal LWIR Hyperspectral Remote Sensing Revenue (million) Forecast, by Application 2020 & 2033
- Table 66: GCC Thermal LWIR Hyperspectral Remote Sensing Volume (K) Forecast, by Application 2020 & 2033
- Table 67: North Africa Thermal LWIR Hyperspectral Remote Sensing Revenue (million) Forecast, by Application 2020 & 2033
- Table 68: North Africa Thermal LWIR Hyperspectral Remote Sensing Volume (K) Forecast, by Application 2020 & 2033
- Table 69: South Africa Thermal LWIR Hyperspectral Remote Sensing Revenue (million) Forecast, by Application 2020 & 2033
- Table 70: South Africa Thermal LWIR Hyperspectral Remote Sensing Volume (K) Forecast, by Application 2020 & 2033
- Table 71: Rest of Middle East & Africa Thermal LWIR Hyperspectral Remote Sensing Revenue (million) Forecast, by Application 2020 & 2033
- Table 72: Rest of Middle East & Africa Thermal LWIR Hyperspectral Remote Sensing Volume (K) Forecast, by Application 2020 & 2033
- Table 73: Global Thermal LWIR Hyperspectral Remote Sensing Revenue million Forecast, by Application 2020 & 2033
- Table 74: Global Thermal LWIR Hyperspectral Remote Sensing Volume K Forecast, by Application 2020 & 2033
- Table 75: Global Thermal LWIR Hyperspectral Remote Sensing Revenue million Forecast, by Types 2020 & 2033
- Table 76: Global Thermal LWIR Hyperspectral Remote Sensing Volume K Forecast, by Types 2020 & 2033
- Table 77: Global Thermal LWIR Hyperspectral Remote Sensing Revenue million Forecast, by Country 2020 & 2033
- Table 78: Global Thermal LWIR Hyperspectral Remote Sensing Volume K Forecast, by Country 2020 & 2033
- Table 79: China Thermal LWIR Hyperspectral Remote Sensing Revenue (million) Forecast, by Application 2020 & 2033
- Table 80: China Thermal LWIR Hyperspectral Remote Sensing Volume (K) Forecast, by Application 2020 & 2033
- Table 81: India Thermal LWIR Hyperspectral Remote Sensing Revenue (million) Forecast, by Application 2020 & 2033
- Table 82: India Thermal LWIR Hyperspectral Remote Sensing Volume (K) Forecast, by Application 2020 & 2033
- Table 83: Japan Thermal LWIR Hyperspectral Remote Sensing Revenue (million) Forecast, by Application 2020 & 2033
- Table 84: Japan Thermal LWIR Hyperspectral Remote Sensing Volume (K) Forecast, by Application 2020 & 2033
- Table 85: South Korea Thermal LWIR Hyperspectral Remote Sensing Revenue (million) Forecast, by Application 2020 & 2033
- Table 86: South Korea Thermal LWIR Hyperspectral Remote Sensing Volume (K) Forecast, by Application 2020 & 2033
- Table 87: ASEAN Thermal LWIR Hyperspectral Remote Sensing Revenue (million) Forecast, by Application 2020 & 2033
- Table 88: ASEAN Thermal LWIR Hyperspectral Remote Sensing Volume (K) Forecast, by Application 2020 & 2033
- Table 89: Oceania Thermal LWIR Hyperspectral Remote Sensing Revenue (million) Forecast, by Application 2020 & 2033
- Table 90: Oceania Thermal LWIR Hyperspectral Remote Sensing Volume (K) Forecast, by Application 2020 & 2033
- Table 91: Rest of Asia Pacific Thermal LWIR Hyperspectral Remote Sensing Revenue (million) Forecast, by Application 2020 & 2033
- Table 92: Rest of Asia Pacific Thermal LWIR Hyperspectral Remote Sensing Volume (K) Forecast, by Application 2020 & 2033
Frequently Asked Questions
1. What is the projected Compound Annual Growth Rate (CAGR) of the Thermal LWIR Hyperspectral Remote Sensing?
The projected CAGR is approximately 3.8%.
2. Which companies are prominent players in the Thermal LWIR Hyperspectral Remote Sensing?
Key companies in the market include SPECIM, Resonon, Headwall, Corning Incorporated, ITRES, Norsk Elektro Optikk, Surface Optics Corp, Telops, Brimrose Corporation, BaySpec, XIMEA, RIKOLA, CI Systems, Cubert GmbH, Applied Infrared Sensing.
3. What are the main segments of the Thermal LWIR Hyperspectral Remote Sensing?
The market segments include Application, Types.
4. Can you provide details about the market size?
The market size is estimated to be USD 45 million as of 2022.
5. What are some drivers contributing to market growth?
N/A
6. What are the notable trends driving market growth?
N/A
7. Are there any restraints impacting market growth?
N/A
8. Can you provide examples of recent developments in the market?
N/A
9. What pricing options are available for accessing the report?
Pricing options include single-user, multi-user, and enterprise licenses priced at USD 3350.00, USD 5025.00, and USD 6700.00 respectively.
10. Is the market size provided in terms of value or volume?
The market size is provided in terms of value, measured in million and volume, measured in K.
11. Are there any specific market keywords associated with the report?
Yes, the market keyword associated with the report is "Thermal LWIR Hyperspectral Remote Sensing," which aids in identifying and referencing the specific market segment covered.
12. How do I determine which pricing option suits my needs best?
The pricing options vary based on user requirements and access needs. Individual users may opt for single-user licenses, while businesses requiring broader access may choose multi-user or enterprise licenses for cost-effective access to the report.
13. Are there any additional resources or data provided in the Thermal LWIR Hyperspectral Remote Sensing report?
While the report offers comprehensive insights, it's advisable to review the specific contents or supplementary materials provided to ascertain if additional resources or data are available.
14. How can I stay updated on further developments or reports in the Thermal LWIR Hyperspectral Remote Sensing?
To stay informed about further developments, trends, and reports in the Thermal LWIR Hyperspectral Remote Sensing, consider subscribing to industry newsletters, following relevant companies and organizations, or regularly checking reputable industry news sources and publications.
Methodology
Step 1 - Identification of Relevant Samples Size from Population Database


Step 2 - Approaches for Defining Global Market Size (Value, Volume* & Price*)

Note*: In applicable scenarios
Step 3 - Data Sources
Primary Research
- Web Analytics
- Survey Reports
- Research Institute
- Latest Research Reports
- Opinion Leaders
Secondary Research
- Annual Reports
- White Paper
- Latest Press Release
- Industry Association
- Paid Database
- Investor Presentations

Step 4 - Data Triangulation
Involves using different sources of information in order to increase the validity of a study
These sources are likely to be stakeholders in a program - participants, other researchers, program staff, other community members, and so on.
Then we put all data in single framework & apply various statistical tools to find out the dynamic on the market.
During the analysis stage, feedback from the stakeholder groups would be compared to determine areas of agreement as well as areas of divergence