

Key Insights
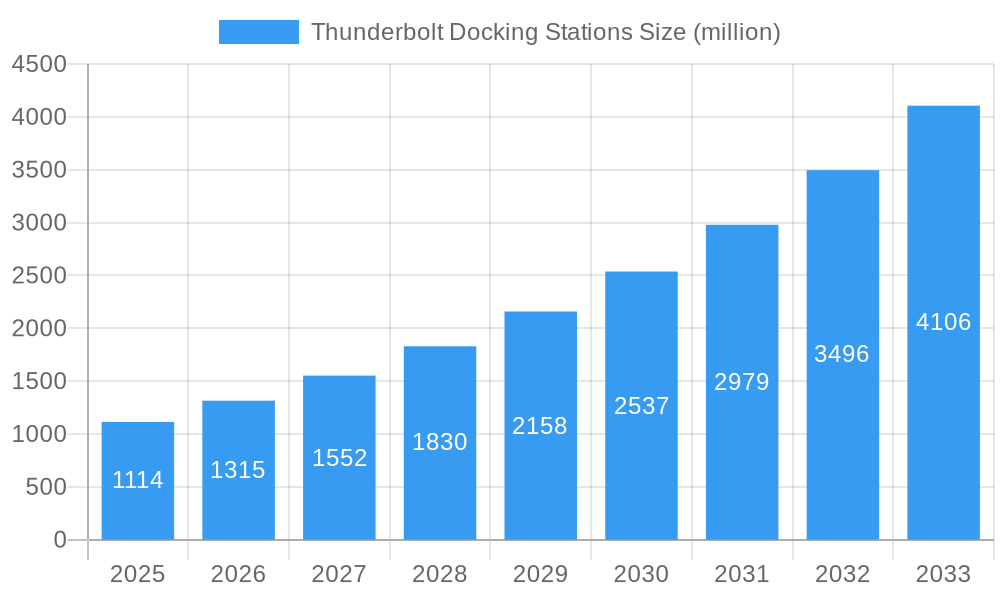
The global Thunderbolt Docking Stations market is poised for substantial expansion, driven by the escalating adoption of high-performance computing, professional content creation, and the increasing demand for seamless connectivity in both professional and home office environments. With a robust CAGR of 18.1%, the market is projected to reach an estimated $1114 million by 2025. This growth trajectory is largely fueled by the inherent advantages of Thunderbolt technology, including its high bandwidth capabilities, enabling faster data transfer, support for multiple high-resolution displays, and the ability to power peripherals. The market's dynamism is further accentuated by the ongoing advancements in Thunderbolt technology, with the widespread adoption of Thunderbolt 4 and the anticipation of future iterations promising even greater speeds and enhanced functionality. Key market drivers include the proliferation of premium laptops and workstations equipped with Thunderbolt ports, the growing trend towards remote and hybrid work models necessitating advanced docking solutions for productivity, and the surge in demand for sophisticated gaming setups and content editing workflows that rely on high-speed, versatile connectivity.
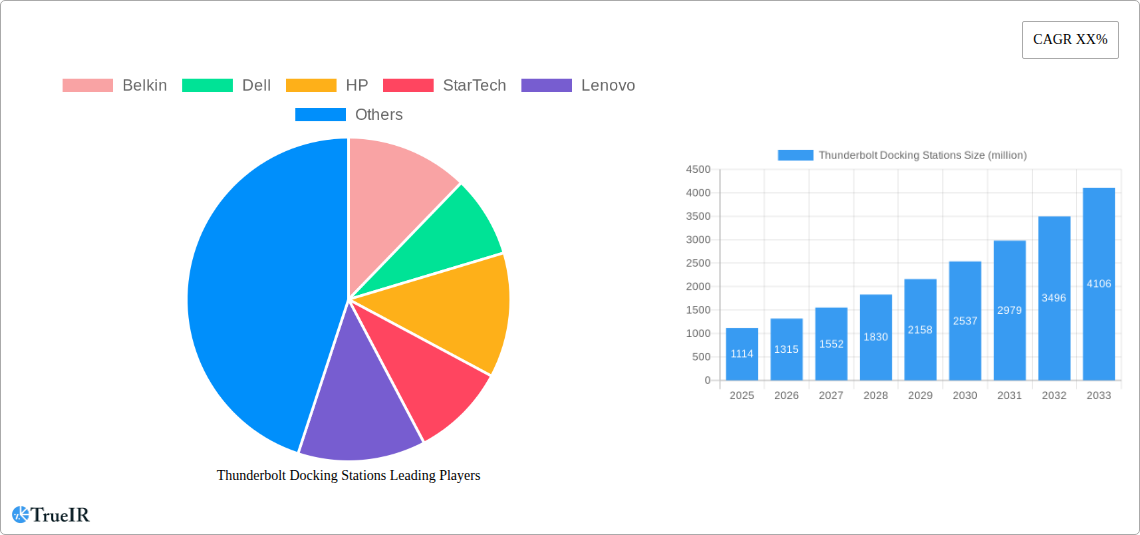
Thunderbolt Docking Stations Market Size (In Billion)
The market segmentation reveals a strong inclination towards Online sales channels, reflecting the e-commerce boom and convenience for consumers and businesses alike. While Offline channels continue to hold relevance, particularly for enterprise deployments and specialized retail, the digital marketplace is expected to dominate. In terms of product types, Thunderbolt 4 docks are gaining significant traction due to their superior capabilities over Thunderbolt 3, including enhanced security features and guaranteed minimum performance standards. However, Thunderbolt 3 docks remain a substantial segment, offering a cost-effective solution for many users. The competitive landscape is characterized by the presence of prominent players such as Belkin, Dell, HP, Lenovo, and Anker, alongside innovative companies like OWC, Corsair, and CalDigit, all vying to capture market share through product innovation, strategic partnerships, and expanding distribution networks. Geographically, North America and Asia Pacific are expected to lead market growth, owing to strong technological adoption, a significant presence of IT and creative industries, and increasing disposable incomes.
Thunderbolt Docking Stations Company Market Share
Comprehensive Report on the Thunderbolt Docking Stations Market: Dynamics, Trends, and Future Outlook
This in-depth report provides a holistic view of the global Thunderbolt Docking Stations market, offering critical insights for stakeholders, investors, and industry professionals. Spanning a study period from 2019 to 2033, with a base year of 2025 and a detailed forecast period of 2025–2033, this analysis leverages high-volume SEO keywords to ensure maximum visibility and engagement for industry audiences seeking detailed market intelligence on Thunderbolt docking solutions.
Thunderbolt Docking Stations Market Structure & Competitive Landscape
The Thunderbolt docking stations market exhibits a moderately concentrated structure, with a blend of established technology giants and specialized peripheral manufacturers vying for market share. Innovation is a primary driver, fueled by the continuous evolution of Thunderbolt technology, demanding enhanced port configurations, higher bandwidth, and improved power delivery capabilities. Regulatory impacts, while less pronounced than in other tech sectors, primarily revolve around USB-IF certifications and compliance standards, ensuring interoperability and safety. Product substitutes, such as USB-C hubs and proprietary docking solutions, present a competitive challenge, though Thunderbolt's superior bandwidth and feature set maintain its premium position. End-user segmentation highlights a strong reliance on professional creative workflows, enterprise IT departments, and power users who benefit from single-cable connectivity and expanded peripheral support. Merger and acquisition (M&A) trends are evident as larger companies seek to integrate advanced docking solutions into their broader ecosystem offerings, with an estimated volume of XX M&A deals observed over the historical period. Concentration ratios are estimated to be XX% for the top 5 players.
Thunderbolt Docking Stations Market Trends & Opportunities
The Thunderbolt docking stations market is poised for robust expansion, driven by an accelerating demand for seamless connectivity and enhanced productivity solutions. The market size is projected to grow from an estimated XX million in 2025 to an impressive XX million by 2033, reflecting a compound annual growth rate (CAGR) of approximately XX%. This significant growth trajectory is underpinned by several key technological shifts. The widespread adoption of Thunderbolt 4, offering a standardized 40Gbps bandwidth, increased device compatibility, and dual 4K display support, is a primary catalyst. This technological advancement directly addresses the growing need for high-performance peripherals and multi-display setups in professional environments.
Consumer preferences are increasingly leaning towards minimalist desk setups and the convenience of a single cable for data, display, and power delivery. This "one-cable solution" paradigm is a powerful trend that Thunderbolt docking stations are perfectly positioned to capitalize on. Furthermore, the resurgence of hybrid work models necessitates flexible and powerful workstation setups, both in office and home environments, further bolstering demand for versatile docking solutions.
Competitive dynamics are intensifying as key players like Belkin, Dell, HP, StarTech, Lenovo, Anker, OWC, Corsair, Razer, CalDigit, TRIPP LITE, Sonnet Technologies, Plugable, ORICO, Kensington, Zikko, Sabrent, IOGEAR, and Hyper continually innovate. Product differentiation is emerging through features such as advanced power delivery, integrated Ethernet ports, SD card readers, additional USB ports (including USB-C and USB-A), and even built-in storage solutions. The market penetration rate for Thunderbolt docking stations, while still representing a niche within the broader peripheral market, is steadily increasing, indicating a growing awareness and appreciation for its premium capabilities. Opportunities exist in developing more compact and portable docking solutions, as well as specialized docks tailored for specific industries, such as gaming or video editing. The ongoing evolution of USB-C ports on laptops and desktops, often incorporating Thunderbolt capabilities, further expands the addressable market for these advanced docking stations.
Dominant Markets & Segments in Thunderbolt Docking Stations
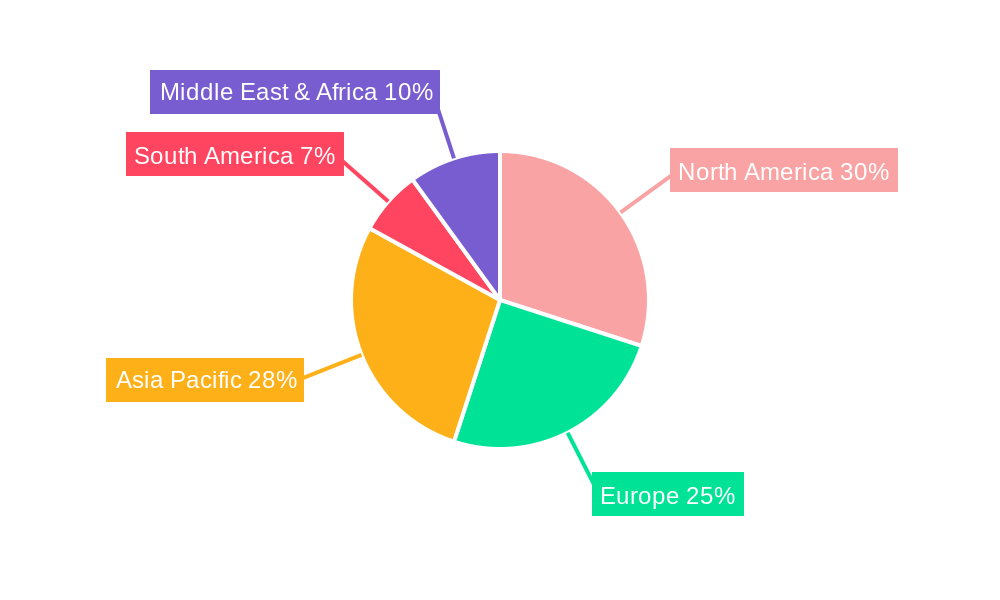
The Thunderbolt docking stations market demonstrates distinct regional dominance and segment growth, primarily driven by technological infrastructure, supportive government policies, and the concentration of key industries.
Leading Region and Country Dominance:
North America currently leads the market, with the United States being the primary driver. This dominance is attributed to a well-established ecosystem of technology innovation, a significant presence of high-tech industries (including software development, creative agencies, and financial services), and a consumer base that readily adopts premium technology. High disposable incomes and a strong demand for productivity-enhancing peripherals contribute to this leadership.
- Key Growth Drivers in North America:
- High adoption rates of Thunderbolt-enabled laptops and desktops.
- Prevalence of remote and hybrid work models, necessitating advanced home office setups.
- Strong presence of major technology companies that integrate Thunderbolt docks into their product lines.
- Robust IT spending by enterprises seeking to standardize and streamline workstation connectivity.
Europe, particularly Western Europe (e.g., Germany, UK, France), represents the second-largest market. The region benefits from advanced technological infrastructure, a strong manufacturing base, and a growing demand for high-performance computing solutions in sectors like engineering and design.
Asia Pacific is emerging as a rapidly growing market, fueled by increasing disposable incomes, the burgeoning IT sector in countries like China and India, and a growing adoption of premium consumer electronics. Government initiatives promoting digitalization and technological advancement are also playing a crucial role.
Dominant Segments by Type:
Thunderbolt 4: This segment is experiencing the most rapid growth and is expected to dominate the market in the forecast period.
- Key Growth Drivers for Thunderbolt 4:
- Mandated feature set for certified devices, ensuring consistent performance and interoperability.
- Enhanced capabilities including support for two 4K displays at 60Hz or one 8K display, advanced PCIe tunneling, and improved security features.
- Increasing integration of Thunderbolt 4 ports on a wider range of laptops and motherboards from major manufacturers.
- Greater compatibility with a broader array of peripherals and accessories.
- Key Growth Drivers for Thunderbolt 4:
Thunderbolt 3: While superseded by Thunderbolt 4 in terms of standardization, Thunderbolt 3 remains a significant segment, particularly in existing device ecosystems.
- Market Dynamics for Thunderbolt 3:
- Continued demand from users with existing Thunderbolt 3-equipped devices.
- Availability of a wide range of cost-effective Thunderbolt 3 docking stations.
- Many Thunderbolt 4 docks are backward compatible with Thunderbolt 3, ensuring ongoing relevance.
- Market Dynamics for Thunderbolt 3:
Others: This category encompasses older Thunderbolt versions or proprietary implementations, which are gradually losing market share to the more standardized Thunderbolt 3 and 4.
Dominant Segments by Application:
Online: The online sales channel is becoming increasingly dominant for Thunderbolt docking stations.
- Key Growth Drivers for Online Sales:
- E-commerce platforms offer a wider selection of brands and models.
- Convenience of home delivery and direct-to-consumer purchasing.
- Detailed product reviews and specifications available for informed decision-making.
- Competitive pricing and promotional offers often found online.
- Key Growth Drivers for Online Sales:
Offline: Brick-and-mortar retail stores, including electronics specialists and big-box retailers, still hold a significant share, particularly for users who prefer hands-on product evaluation or immediate purchase.
Thunderbolt Docking Stations Product Analysis
Thunderbolt docking stations are characterized by cutting-edge technological advancements, enabling single-cable connectivity for a multitude of peripherals. Innovations focus on maximizing bandwidth (40Gbps), delivering high power output for charging laptops, and supporting multiple high-resolution displays (up to 8K). Key applications span professional creative work, enterprise IT solutions, and power-user productivity, offering seamless integration with laptops and desktops. Competitive advantages lie in their superior performance, extensive port selection (including USB-C, USB-A, HDMI, DisplayPort, Ethernet, and audio), and robust build quality. The market sees continuous evolution with features like Thunderbolt 4 certification, improved thermal management, and enhanced device compatibility, ensuring they remain at the forefront of peripheral connectivity.
Key Drivers, Barriers & Challenges in Thunderbolt Docking Stations
Key Drivers:
The primary forces propelling the Thunderbolt docking stations market are the relentless pursuit of enhanced productivity and simplified workflows. Technological advancements, particularly the widespread adoption of Thunderbolt 4, offer standardized high bandwidth and versatile connectivity, making single-cable solutions increasingly attractive. Economic factors, including increased IT spending by enterprises and the growing demand for premium consumer electronics, fuel market growth. Policy-driven factors, such as the push for universal connectivity standards and the growing importance of remote work, further stimulate demand for robust docking solutions. For example, the increasing prevalence of Thunderbolt 4 ports on new laptop models directly drives the market for compatible docking stations.
Key Barriers & Challenges:
Supply chain issues, including the availability of critical components and manufacturing capacity, can pose significant challenges, potentially leading to price fluctuations and extended lead times. Regulatory hurdles, though minimal, involve ensuring compliance with USB-IF standards and regional certifications. Competitive pressures from more affordable USB-C hubs and proprietary docking solutions can limit market penetration, particularly in cost-sensitive segments. The premium pricing associated with Thunderbolt technology also remains a barrier for some consumers, with an estimated market segment of XX% being price-sensitive.
Growth Drivers in the Thunderbolt Docking Stations Market
Growth drivers in the Thunderbolt docking stations market are multifaceted, stemming from technological evolution, shifting economic landscapes, and evolving work paradigms. The continuous innovation in Thunderbolt technology, specifically the standardization and enhanced capabilities of Thunderbolt 4, is a paramount driver. This provides a consistent and high-performance solution for demanding workflows. Economically, the robust IT spending by enterprises, coupled with a growing demand for premium productivity tools in the consumer segment, fuels market expansion. The sustained trend towards remote and hybrid work models necessitates flexible and powerful workstation setups, significantly increasing the demand for single-cable docking solutions that consolidate multiple peripherals.
Challenges Impacting Thunderbolt Docking Stations Growth
Several barriers and restraints impact the growth of the Thunderbolt docking stations market. Regulatory complexities, primarily ensuring adherence to USB-IF specifications and regional certifications, can add to development timelines and costs. Supply chain disruptions, including component shortages and manufacturing bottlenecks, can lead to price volatility and affect product availability, with estimated impacts on production cycles of up to XX%. Competitive pressures from less expensive USB-C hubs and specialized docking solutions pose a constant challenge, particularly for market segments where cost is a primary purchasing factor. The inherently higher price point of Thunderbolt technology also acts as a restraint, limiting its adoption in budget-conscious markets.
Key Players Shaping the Thunderbolt Docking Stations Market
- Belkin
- Dell
- HP
- StarTech
- Lenovo
- Anker
- OWC
- Corsair
- Razer
- CalDigit
- TRIPP LITE
- Sonnet Technologies
- Plugable
- ORICO
- Kensington
- Zikko
- Sabrent
- IOGEAR
- Hyper
Significant Thunderbolt Docking Stations Industry Milestones
- 2019: Introduction of Thunderbolt 3 revisions with improved power delivery capabilities.
- 2020: Official announcement and initial product launches for Thunderbolt 4, standardizing features and performance.
- 2021: Increased integration of Thunderbolt 4 ports across high-end laptop lineups from major manufacturers.
- 2022: Emergence of compact and portable Thunderbolt docking solutions catering to mobile professionals.
- 2023: Further refinement of Thunderbolt 4 docks with advanced features like higher refresh rate display support and improved thermal management.
- 2024: Increased market penetration of Thunderbolt 4 docks in enterprise deployments seeking standardized connectivity.
- 2025: Anticipated broader adoption of Thunderbolt 4 across mid-range computing devices.
- 2026: Potential for next-generation Thunderbolt specifications offering even higher bandwidth.
Future Outlook for Thunderbolt Docking Stations Market
The future outlook for the Thunderbolt docking stations market is exceptionally positive, driven by continued technological advancements and an evolving work environment. The sustained growth of hybrid and remote work models will remain a primary catalyst, demanding efficient and streamlined workstation setups. The ongoing development and adoption of Thunderbolt 4, along with potential future iterations, will ensure that these docks remain at the pinnacle of connectivity solutions. Strategic opportunities lie in the creation of more specialized docking stations tailored for niche industries such as gaming, content creation, and scientific research, offering customized port configurations and enhanced performance. The increasing integration of Thunderbolt capabilities into a wider range of devices suggests a broadening addressable market, promising sustained growth and innovation in the years to come.
Thunderbolt Docking Stations Segmentation
-
1. Application
- 1.1. Online
- 1.2. Offline
-
2. Types
- 2.1. Thunderbolt 3
- 2.2. Thunderbolt 4
- 2.3. Others
Thunderbolt Docking Stations Segmentation By Geography
-
1. North America
- 1.1. United States
- 1.2. Canada
- 1.3. Mexico
-
2. South America
- 2.1. Brazil
- 2.2. Argentina
- 2.3. Rest of South America
-
3. Europe
- 3.1. United Kingdom
- 3.2. Germany
- 3.3. France
- 3.4. Italy
- 3.5. Spain
- 3.6. Russia
- 3.7. Benelux
- 3.8. Nordics
- 3.9. Rest of Europe
-
4. Middle East & Africa
- 4.1. Turkey
- 4.2. Israel
- 4.3. GCC
- 4.4. North Africa
- 4.5. South Africa
- 4.6. Rest of Middle East & Africa
-
5. Asia Pacific
- 5.1. China
- 5.2. India
- 5.3. Japan
- 5.4. South Korea
- 5.5. ASEAN
- 5.6. Oceania
- 5.7. Rest of Asia Pacific
Thunderbolt Docking Stations Regional Market Share
Geographic Coverage of Thunderbolt Docking Stations
Thunderbolt Docking Stations REPORT HIGHLIGHTS
| Aspects | Details |
|---|---|
| Study Period | 2020-2034 |
| Base Year | 2025 |
| Estimated Year | 2026 |
| Forecast Period | 2026-2034 |
| Historical Period | 2020-2025 |
| Growth Rate | CAGR of 3.99% from 2020-2034 |
| Segmentation |
|
Table of Contents
- 1. Introduction
- 1.1. Research Scope
- 1.2. Market Segmentation
- 1.3. Research Objective
- 1.4. Definitions and Assumptions
- 2. Executive Summary
- 2.1. Market Snapshot
- 3. Market Dynamics
- 3.1. Market Drivers
- 3.2. Market Restrains
- 3.3. Market Trends
- 3.4. Market Opportunities
- 4. Market Factor Analysis
- 4.1. Porters Five Forces
- 4.1.1. Bargaining Power of Suppliers
- 4.1.2. Bargaining Power of Buyers
- 4.1.3. Threat of New Entrants
- 4.1.4. Threat of Substitutes
- 4.1.5. Competitive Rivalry
- 4.2. PESTEL analysis
- 4.3. BCG Analysis
- 4.3.1. Stars (High Growth, High Market Share)
- 4.3.2. Cash Cows (Low Growth, High Market Share)
- 4.3.3. Question Mark (High Growth, Low Market Share)
- 4.3.4. Dogs (Low Growth, Low Market Share)
- 4.4. Ansoff Matrix Analysis
- 4.5. Supply Chain Analysis
- 4.6. Regulatory Landscape
- 4.7. Current Market Potential and Opportunity Assessment (TAM–SAM–SOM Framework)
- 4.8. TIR Analyst Note
- 4.1. Porters Five Forces
- 5. Market Analysis, Insights and Forecast 2021-2033
- 5.1. Market Analysis, Insights and Forecast - by Application
- 5.1.1. Online
- 5.1.2. Offline
- 5.2. Market Analysis, Insights and Forecast - by Types
- 5.2.1. Thunderbolt 3
- 5.2.2. Thunderbolt 4
- 5.2.3. Others
- 5.3. Market Analysis, Insights and Forecast - by Region
- 5.3.1. North America
- 5.3.2. South America
- 5.3.3. Europe
- 5.3.4. Middle East & Africa
- 5.3.5. Asia Pacific
- 5.1. Market Analysis, Insights and Forecast - by Application
- 6. Global Thunderbolt Docking Stations Analysis, Insights and Forecast, 2021-2033
- 6.1. Market Analysis, Insights and Forecast - by Application
- 6.1.1. Online
- 6.1.2. Offline
- 6.2. Market Analysis, Insights and Forecast - by Types
- 6.2.1. Thunderbolt 3
- 6.2.2. Thunderbolt 4
- 6.2.3. Others
- 6.1. Market Analysis, Insights and Forecast - by Application
- 7. North America Thunderbolt Docking Stations Analysis, Insights and Forecast, 2020-2032
- 7.1. Market Analysis, Insights and Forecast - by Application
- 7.1.1. Online
- 7.1.2. Offline
- 7.2. Market Analysis, Insights and Forecast - by Types
- 7.2.1. Thunderbolt 3
- 7.2.2. Thunderbolt 4
- 7.2.3. Others
- 7.1. Market Analysis, Insights and Forecast - by Application
- 8. South America Thunderbolt Docking Stations Analysis, Insights and Forecast, 2020-2032
- 8.1. Market Analysis, Insights and Forecast - by Application
- 8.1.1. Online
- 8.1.2. Offline
- 8.2. Market Analysis, Insights and Forecast - by Types
- 8.2.1. Thunderbolt 3
- 8.2.2. Thunderbolt 4
- 8.2.3. Others
- 8.1. Market Analysis, Insights and Forecast - by Application
- 9. Europe Thunderbolt Docking Stations Analysis, Insights and Forecast, 2020-2032
- 9.1. Market Analysis, Insights and Forecast - by Application
- 9.1.1. Online
- 9.1.2. Offline
- 9.2. Market Analysis, Insights and Forecast - by Types
- 9.2.1. Thunderbolt 3
- 9.2.2. Thunderbolt 4
- 9.2.3. Others
- 9.1. Market Analysis, Insights and Forecast - by Application
- 10. Middle East & Africa Thunderbolt Docking Stations Analysis, Insights and Forecast, 2020-2032
- 10.1. Market Analysis, Insights and Forecast - by Application
- 10.1.1. Online
- 10.1.2. Offline
- 10.2. Market Analysis, Insights and Forecast - by Types
- 10.2.1. Thunderbolt 3
- 10.2.2. Thunderbolt 4
- 10.2.3. Others
- 10.1. Market Analysis, Insights and Forecast - by Application
- 11. Asia Pacific Thunderbolt Docking Stations Analysis, Insights and Forecast, 2020-2032
- 11.1. Market Analysis, Insights and Forecast - by Application
- 11.1.1. Online
- 11.1.2. Offline
- 11.2. Market Analysis, Insights and Forecast - by Types
- 11.2.1. Thunderbolt 3
- 11.2.2. Thunderbolt 4
- 11.2.3. Others
- 11.1. Market Analysis, Insights and Forecast - by Application
- 12. Competitive Analysis
- 12.1. Company Profiles
- 12.1.1 Belkin
- 12.1.1.1. Company Overview
- 12.1.1.2. Products
- 12.1.1.3. Company Financials
- 12.1.1.4. SWOT Analysis
- 12.1.2 Dell
- 12.1.2.1. Company Overview
- 12.1.2.2. Products
- 12.1.2.3. Company Financials
- 12.1.2.4. SWOT Analysis
- 12.1.3 HP
- 12.1.3.1. Company Overview
- 12.1.3.2. Products
- 12.1.3.3. Company Financials
- 12.1.3.4. SWOT Analysis
- 12.1.4 StarTech
- 12.1.4.1. Company Overview
- 12.1.4.2. Products
- 12.1.4.3. Company Financials
- 12.1.4.4. SWOT Analysis
- 12.1.5 Lenovo
- 12.1.5.1. Company Overview
- 12.1.5.2. Products
- 12.1.5.3. Company Financials
- 12.1.5.4. SWOT Analysis
- 12.1.6 Anker
- 12.1.6.1. Company Overview
- 12.1.6.2. Products
- 12.1.6.3. Company Financials
- 12.1.6.4. SWOT Analysis
- 12.1.7 OWC
- 12.1.7.1. Company Overview
- 12.1.7.2. Products
- 12.1.7.3. Company Financials
- 12.1.7.4. SWOT Analysis
- 12.1.8 Corsair
- 12.1.8.1. Company Overview
- 12.1.8.2. Products
- 12.1.8.3. Company Financials
- 12.1.8.4. SWOT Analysis
- 12.1.9 Razer
- 12.1.9.1. Company Overview
- 12.1.9.2. Products
- 12.1.9.3. Company Financials
- 12.1.9.4. SWOT Analysis
- 12.1.10 CalDigit
- 12.1.10.1. Company Overview
- 12.1.10.2. Products
- 12.1.10.3. Company Financials
- 12.1.10.4. SWOT Analysis
- 12.1.11 TRIPP LITE
- 12.1.11.1. Company Overview
- 12.1.11.2. Products
- 12.1.11.3. Company Financials
- 12.1.11.4. SWOT Analysis
- 12.1.12 Sonnet Technologies
- 12.1.12.1. Company Overview
- 12.1.12.2. Products
- 12.1.12.3. Company Financials
- 12.1.12.4. SWOT Analysis
- 12.1.13 Plugable
- 12.1.13.1. Company Overview
- 12.1.13.2. Products
- 12.1.13.3. Company Financials
- 12.1.13.4. SWOT Analysis
- 12.1.14 ORICO
- 12.1.14.1. Company Overview
- 12.1.14.2. Products
- 12.1.14.3. Company Financials
- 12.1.14.4. SWOT Analysis
- 12.1.15 Kensington
- 12.1.15.1. Company Overview
- 12.1.15.2. Products
- 12.1.15.3. Company Financials
- 12.1.15.4. SWOT Analysis
- 12.1.16 Zikko
- 12.1.16.1. Company Overview
- 12.1.16.2. Products
- 12.1.16.3. Company Financials
- 12.1.16.4. SWOT Analysis
- 12.1.17 Sabrent
- 12.1.17.1. Company Overview
- 12.1.17.2. Products
- 12.1.17.3. Company Financials
- 12.1.17.4. SWOT Analysis
- 12.1.18 IOGEAR
- 12.1.18.1. Company Overview
- 12.1.18.2. Products
- 12.1.18.3. Company Financials
- 12.1.18.4. SWOT Analysis
- 12.1.19 Hyper
- 12.1.19.1. Company Overview
- 12.1.19.2. Products
- 12.1.19.3. Company Financials
- 12.1.19.4. SWOT Analysis
- 12.1.1 Belkin
- 12.2. Market Entropy
- 12.2.1 Company's Key Areas Served
- 12.2.2 Recent Developments
- 12.3. Company Market Share Analysis 2025
- 12.3.1 Top 5 Companies Market Share Analysis
- 12.3.2 Top 3 Companies Market Share Analysis
- 12.4. List of Potential Customers
- 13. Research Methodology
List of Figures
- Figure 1: Global Thunderbolt Docking Stations Revenue Breakdown (undefined, %) by Region 2025 & 2033
- Figure 2: Global Thunderbolt Docking Stations Volume Breakdown (K, %) by Region 2025 & 2033
- Figure 3: North America Thunderbolt Docking Stations Revenue (undefined), by Application 2025 & 2033
- Figure 4: North America Thunderbolt Docking Stations Volume (K), by Application 2025 & 2033
- Figure 5: North America Thunderbolt Docking Stations Revenue Share (%), by Application 2025 & 2033
- Figure 6: North America Thunderbolt Docking Stations Volume Share (%), by Application 2025 & 2033
- Figure 7: North America Thunderbolt Docking Stations Revenue (undefined), by Types 2025 & 2033
- Figure 8: North America Thunderbolt Docking Stations Volume (K), by Types 2025 & 2033
- Figure 9: North America Thunderbolt Docking Stations Revenue Share (%), by Types 2025 & 2033
- Figure 10: North America Thunderbolt Docking Stations Volume Share (%), by Types 2025 & 2033
- Figure 11: North America Thunderbolt Docking Stations Revenue (undefined), by Country 2025 & 2033
- Figure 12: North America Thunderbolt Docking Stations Volume (K), by Country 2025 & 2033
- Figure 13: North America Thunderbolt Docking Stations Revenue Share (%), by Country 2025 & 2033
- Figure 14: North America Thunderbolt Docking Stations Volume Share (%), by Country 2025 & 2033
- Figure 15: South America Thunderbolt Docking Stations Revenue (undefined), by Application 2025 & 2033
- Figure 16: South America Thunderbolt Docking Stations Volume (K), by Application 2025 & 2033
- Figure 17: South America Thunderbolt Docking Stations Revenue Share (%), by Application 2025 & 2033
- Figure 18: South America Thunderbolt Docking Stations Volume Share (%), by Application 2025 & 2033
- Figure 19: South America Thunderbolt Docking Stations Revenue (undefined), by Types 2025 & 2033
- Figure 20: South America Thunderbolt Docking Stations Volume (K), by Types 2025 & 2033
- Figure 21: South America Thunderbolt Docking Stations Revenue Share (%), by Types 2025 & 2033
- Figure 22: South America Thunderbolt Docking Stations Volume Share (%), by Types 2025 & 2033
- Figure 23: South America Thunderbolt Docking Stations Revenue (undefined), by Country 2025 & 2033
- Figure 24: South America Thunderbolt Docking Stations Volume (K), by Country 2025 & 2033
- Figure 25: South America Thunderbolt Docking Stations Revenue Share (%), by Country 2025 & 2033
- Figure 26: South America Thunderbolt Docking Stations Volume Share (%), by Country 2025 & 2033
- Figure 27: Europe Thunderbolt Docking Stations Revenue (undefined), by Application 2025 & 2033
- Figure 28: Europe Thunderbolt Docking Stations Volume (K), by Application 2025 & 2033
- Figure 29: Europe Thunderbolt Docking Stations Revenue Share (%), by Application 2025 & 2033
- Figure 30: Europe Thunderbolt Docking Stations Volume Share (%), by Application 2025 & 2033
- Figure 31: Europe Thunderbolt Docking Stations Revenue (undefined), by Types 2025 & 2033
- Figure 32: Europe Thunderbolt Docking Stations Volume (K), by Types 2025 & 2033
- Figure 33: Europe Thunderbolt Docking Stations Revenue Share (%), by Types 2025 & 2033
- Figure 34: Europe Thunderbolt Docking Stations Volume Share (%), by Types 2025 & 2033
- Figure 35: Europe Thunderbolt Docking Stations Revenue (undefined), by Country 2025 & 2033
- Figure 36: Europe Thunderbolt Docking Stations Volume (K), by Country 2025 & 2033
- Figure 37: Europe Thunderbolt Docking Stations Revenue Share (%), by Country 2025 & 2033
- Figure 38: Europe Thunderbolt Docking Stations Volume Share (%), by Country 2025 & 2033
- Figure 39: Middle East & Africa Thunderbolt Docking Stations Revenue (undefined), by Application 2025 & 2033
- Figure 40: Middle East & Africa Thunderbolt Docking Stations Volume (K), by Application 2025 & 2033
- Figure 41: Middle East & Africa Thunderbolt Docking Stations Revenue Share (%), by Application 2025 & 2033
- Figure 42: Middle East & Africa Thunderbolt Docking Stations Volume Share (%), by Application 2025 & 2033
- Figure 43: Middle East & Africa Thunderbolt Docking Stations Revenue (undefined), by Types 2025 & 2033
- Figure 44: Middle East & Africa Thunderbolt Docking Stations Volume (K), by Types 2025 & 2033
- Figure 45: Middle East & Africa Thunderbolt Docking Stations Revenue Share (%), by Types 2025 & 2033
- Figure 46: Middle East & Africa Thunderbolt Docking Stations Volume Share (%), by Types 2025 & 2033
- Figure 47: Middle East & Africa Thunderbolt Docking Stations Revenue (undefined), by Country 2025 & 2033
- Figure 48: Middle East & Africa Thunderbolt Docking Stations Volume (K), by Country 2025 & 2033
- Figure 49: Middle East & Africa Thunderbolt Docking Stations Revenue Share (%), by Country 2025 & 2033
- Figure 50: Middle East & Africa Thunderbolt Docking Stations Volume Share (%), by Country 2025 & 2033
- Figure 51: Asia Pacific Thunderbolt Docking Stations Revenue (undefined), by Application 2025 & 2033
- Figure 52: Asia Pacific Thunderbolt Docking Stations Volume (K), by Application 2025 & 2033
- Figure 53: Asia Pacific Thunderbolt Docking Stations Revenue Share (%), by Application 2025 & 2033
- Figure 54: Asia Pacific Thunderbolt Docking Stations Volume Share (%), by Application 2025 & 2033
- Figure 55: Asia Pacific Thunderbolt Docking Stations Revenue (undefined), by Types 2025 & 2033
- Figure 56: Asia Pacific Thunderbolt Docking Stations Volume (K), by Types 2025 & 2033
- Figure 57: Asia Pacific Thunderbolt Docking Stations Revenue Share (%), by Types 2025 & 2033
- Figure 58: Asia Pacific Thunderbolt Docking Stations Volume Share (%), by Types 2025 & 2033
- Figure 59: Asia Pacific Thunderbolt Docking Stations Revenue (undefined), by Country 2025 & 2033
- Figure 60: Asia Pacific Thunderbolt Docking Stations Volume (K), by Country 2025 & 2033
- Figure 61: Asia Pacific Thunderbolt Docking Stations Revenue Share (%), by Country 2025 & 2033
- Figure 62: Asia Pacific Thunderbolt Docking Stations Volume Share (%), by Country 2025 & 2033
List of Tables
- Table 1: Global Thunderbolt Docking Stations Revenue undefined Forecast, by Application 2020 & 2033
- Table 2: Global Thunderbolt Docking Stations Volume K Forecast, by Application 2020 & 2033
- Table 3: Global Thunderbolt Docking Stations Revenue undefined Forecast, by Types 2020 & 2033
- Table 4: Global Thunderbolt Docking Stations Volume K Forecast, by Types 2020 & 2033
- Table 5: Global Thunderbolt Docking Stations Revenue undefined Forecast, by Region 2020 & 2033
- Table 6: Global Thunderbolt Docking Stations Volume K Forecast, by Region 2020 & 2033
- Table 7: Global Thunderbolt Docking Stations Revenue undefined Forecast, by Application 2020 & 2033
- Table 8: Global Thunderbolt Docking Stations Volume K Forecast, by Application 2020 & 2033
- Table 9: Global Thunderbolt Docking Stations Revenue undefined Forecast, by Types 2020 & 2033
- Table 10: Global Thunderbolt Docking Stations Volume K Forecast, by Types 2020 & 2033
- Table 11: Global Thunderbolt Docking Stations Revenue undefined Forecast, by Country 2020 & 2033
- Table 12: Global Thunderbolt Docking Stations Volume K Forecast, by Country 2020 & 2033
- Table 13: United States Thunderbolt Docking Stations Revenue (undefined) Forecast, by Application 2020 & 2033
- Table 14: United States Thunderbolt Docking Stations Volume (K) Forecast, by Application 2020 & 2033
- Table 15: Canada Thunderbolt Docking Stations Revenue (undefined) Forecast, by Application 2020 & 2033
- Table 16: Canada Thunderbolt Docking Stations Volume (K) Forecast, by Application 2020 & 2033
- Table 17: Mexico Thunderbolt Docking Stations Revenue (undefined) Forecast, by Application 2020 & 2033
- Table 18: Mexico Thunderbolt Docking Stations Volume (K) Forecast, by Application 2020 & 2033
- Table 19: Global Thunderbolt Docking Stations Revenue undefined Forecast, by Application 2020 & 2033
- Table 20: Global Thunderbolt Docking Stations Volume K Forecast, by Application 2020 & 2033
- Table 21: Global Thunderbolt Docking Stations Revenue undefined Forecast, by Types 2020 & 2033
- Table 22: Global Thunderbolt Docking Stations Volume K Forecast, by Types 2020 & 2033
- Table 23: Global Thunderbolt Docking Stations Revenue undefined Forecast, by Country 2020 & 2033
- Table 24: Global Thunderbolt Docking Stations Volume K Forecast, by Country 2020 & 2033
- Table 25: Brazil Thunderbolt Docking Stations Revenue (undefined) Forecast, by Application 2020 & 2033
- Table 26: Brazil Thunderbolt Docking Stations Volume (K) Forecast, by Application 2020 & 2033
- Table 27: Argentina Thunderbolt Docking Stations Revenue (undefined) Forecast, by Application 2020 & 2033
- Table 28: Argentina Thunderbolt Docking Stations Volume (K) Forecast, by Application 2020 & 2033
- Table 29: Rest of South America Thunderbolt Docking Stations Revenue (undefined) Forecast, by Application 2020 & 2033
- Table 30: Rest of South America Thunderbolt Docking Stations Volume (K) Forecast, by Application 2020 & 2033
- Table 31: Global Thunderbolt Docking Stations Revenue undefined Forecast, by Application 2020 & 2033
- Table 32: Global Thunderbolt Docking Stations Volume K Forecast, by Application 2020 & 2033
- Table 33: Global Thunderbolt Docking Stations Revenue undefined Forecast, by Types 2020 & 2033
- Table 34: Global Thunderbolt Docking Stations Volume K Forecast, by Types 2020 & 2033
- Table 35: Global Thunderbolt Docking Stations Revenue undefined Forecast, by Country 2020 & 2033
- Table 36: Global Thunderbolt Docking Stations Volume K Forecast, by Country 2020 & 2033
- Table 37: United Kingdom Thunderbolt Docking Stations Revenue (undefined) Forecast, by Application 2020 & 2033
- Table 38: United Kingdom Thunderbolt Docking Stations Volume (K) Forecast, by Application 2020 & 2033
- Table 39: Germany Thunderbolt Docking Stations Revenue (undefined) Forecast, by Application 2020 & 2033
- Table 40: Germany Thunderbolt Docking Stations Volume (K) Forecast, by Application 2020 & 2033
- Table 41: France Thunderbolt Docking Stations Revenue (undefined) Forecast, by Application 2020 & 2033
- Table 42: France Thunderbolt Docking Stations Volume (K) Forecast, by Application 2020 & 2033
- Table 43: Italy Thunderbolt Docking Stations Revenue (undefined) Forecast, by Application 2020 & 2033
- Table 44: Italy Thunderbolt Docking Stations Volume (K) Forecast, by Application 2020 & 2033
- Table 45: Spain Thunderbolt Docking Stations Revenue (undefined) Forecast, by Application 2020 & 2033
- Table 46: Spain Thunderbolt Docking Stations Volume (K) Forecast, by Application 2020 & 2033
- Table 47: Russia Thunderbolt Docking Stations Revenue (undefined) Forecast, by Application 2020 & 2033
- Table 48: Russia Thunderbolt Docking Stations Volume (K) Forecast, by Application 2020 & 2033
- Table 49: Benelux Thunderbolt Docking Stations Revenue (undefined) Forecast, by Application 2020 & 2033
- Table 50: Benelux Thunderbolt Docking Stations Volume (K) Forecast, by Application 2020 & 2033
- Table 51: Nordics Thunderbolt Docking Stations Revenue (undefined) Forecast, by Application 2020 & 2033
- Table 52: Nordics Thunderbolt Docking Stations Volume (K) Forecast, by Application 2020 & 2033
- Table 53: Rest of Europe Thunderbolt Docking Stations Revenue (undefined) Forecast, by Application 2020 & 2033
- Table 54: Rest of Europe Thunderbolt Docking Stations Volume (K) Forecast, by Application 2020 & 2033
- Table 55: Global Thunderbolt Docking Stations Revenue undefined Forecast, by Application 2020 & 2033
- Table 56: Global Thunderbolt Docking Stations Volume K Forecast, by Application 2020 & 2033
- Table 57: Global Thunderbolt Docking Stations Revenue undefined Forecast, by Types 2020 & 2033
- Table 58: Global Thunderbolt Docking Stations Volume K Forecast, by Types 2020 & 2033
- Table 59: Global Thunderbolt Docking Stations Revenue undefined Forecast, by Country 2020 & 2033
- Table 60: Global Thunderbolt Docking Stations Volume K Forecast, by Country 2020 & 2033
- Table 61: Turkey Thunderbolt Docking Stations Revenue (undefined) Forecast, by Application 2020 & 2033
- Table 62: Turkey Thunderbolt Docking Stations Volume (K) Forecast, by Application 2020 & 2033
- Table 63: Israel Thunderbolt Docking Stations Revenue (undefined) Forecast, by Application 2020 & 2033
- Table 64: Israel Thunderbolt Docking Stations Volume (K) Forecast, by Application 2020 & 2033
- Table 65: GCC Thunderbolt Docking Stations Revenue (undefined) Forecast, by Application 2020 & 2033
- Table 66: GCC Thunderbolt Docking Stations Volume (K) Forecast, by Application 2020 & 2033
- Table 67: North Africa Thunderbolt Docking Stations Revenue (undefined) Forecast, by Application 2020 & 2033
- Table 68: North Africa Thunderbolt Docking Stations Volume (K) Forecast, by Application 2020 & 2033
- Table 69: South Africa Thunderbolt Docking Stations Revenue (undefined) Forecast, by Application 2020 & 2033
- Table 70: South Africa Thunderbolt Docking Stations Volume (K) Forecast, by Application 2020 & 2033
- Table 71: Rest of Middle East & Africa Thunderbolt Docking Stations Revenue (undefined) Forecast, by Application 2020 & 2033
- Table 72: Rest of Middle East & Africa Thunderbolt Docking Stations Volume (K) Forecast, by Application 2020 & 2033
- Table 73: Global Thunderbolt Docking Stations Revenue undefined Forecast, by Application 2020 & 2033
- Table 74: Global Thunderbolt Docking Stations Volume K Forecast, by Application 2020 & 2033
- Table 75: Global Thunderbolt Docking Stations Revenue undefined Forecast, by Types 2020 & 2033
- Table 76: Global Thunderbolt Docking Stations Volume K Forecast, by Types 2020 & 2033
- Table 77: Global Thunderbolt Docking Stations Revenue undefined Forecast, by Country 2020 & 2033
- Table 78: Global Thunderbolt Docking Stations Volume K Forecast, by Country 2020 & 2033
- Table 79: China Thunderbolt Docking Stations Revenue (undefined) Forecast, by Application 2020 & 2033
- Table 80: China Thunderbolt Docking Stations Volume (K) Forecast, by Application 2020 & 2033
- Table 81: India Thunderbolt Docking Stations Revenue (undefined) Forecast, by Application 2020 & 2033
- Table 82: India Thunderbolt Docking Stations Volume (K) Forecast, by Application 2020 & 2033
- Table 83: Japan Thunderbolt Docking Stations Revenue (undefined) Forecast, by Application 2020 & 2033
- Table 84: Japan Thunderbolt Docking Stations Volume (K) Forecast, by Application 2020 & 2033
- Table 85: South Korea Thunderbolt Docking Stations Revenue (undefined) Forecast, by Application 2020 & 2033
- Table 86: South Korea Thunderbolt Docking Stations Volume (K) Forecast, by Application 2020 & 2033
- Table 87: ASEAN Thunderbolt Docking Stations Revenue (undefined) Forecast, by Application 2020 & 2033
- Table 88: ASEAN Thunderbolt Docking Stations Volume (K) Forecast, by Application 2020 & 2033
- Table 89: Oceania Thunderbolt Docking Stations Revenue (undefined) Forecast, by Application 2020 & 2033
- Table 90: Oceania Thunderbolt Docking Stations Volume (K) Forecast, by Application 2020 & 2033
- Table 91: Rest of Asia Pacific Thunderbolt Docking Stations Revenue (undefined) Forecast, by Application 2020 & 2033
- Table 92: Rest of Asia Pacific Thunderbolt Docking Stations Volume (K) Forecast, by Application 2020 & 2033
Frequently Asked Questions
1. What is the projected Compound Annual Growth Rate (CAGR) of the Thunderbolt Docking Stations?
The projected CAGR is approximately 3.99%.
2. Which companies are prominent players in the Thunderbolt Docking Stations?
Key companies in the market include Belkin, Dell, HP, StarTech, Lenovo, Anker, OWC, Corsair, Razer, CalDigit, TRIPP LITE, Sonnet Technologies, Plugable, ORICO, Kensington, Zikko, Sabrent, IOGEAR, Hyper.
3. What are the main segments of the Thunderbolt Docking Stations?
The market segments include Application, Types.
4. Can you provide details about the market size?
The market size is estimated to be USD XXX N/A as of 2022.
5. What are some drivers contributing to market growth?
N/A
6. What are the notable trends driving market growth?
N/A
7. Are there any restraints impacting market growth?
N/A
8. Can you provide examples of recent developments in the market?
N/A
9. What pricing options are available for accessing the report?
Pricing options include single-user, multi-user, and enterprise licenses priced at USD 3350.00, USD 5025.00, and USD 6700.00 respectively.
10. Is the market size provided in terms of value or volume?
The market size is provided in terms of value, measured in N/A and volume, measured in K.
11. Are there any specific market keywords associated with the report?
Yes, the market keyword associated with the report is "Thunderbolt Docking Stations," which aids in identifying and referencing the specific market segment covered.
12. How do I determine which pricing option suits my needs best?
The pricing options vary based on user requirements and access needs. Individual users may opt for single-user licenses, while businesses requiring broader access may choose multi-user or enterprise licenses for cost-effective access to the report.
13. Are there any additional resources or data provided in the Thunderbolt Docking Stations report?
While the report offers comprehensive insights, it's advisable to review the specific contents or supplementary materials provided to ascertain if additional resources or data are available.
14. How can I stay updated on further developments or reports in the Thunderbolt Docking Stations?
To stay informed about further developments, trends, and reports in the Thunderbolt Docking Stations, consider subscribing to industry newsletters, following relevant companies and organizations, or regularly checking reputable industry news sources and publications.
Methodology
Step 1 - Identification of Relevant Samples Size from Population Database


Step 2 - Approaches for Defining Global Market Size (Value, Volume* & Price*)

Note*: In applicable scenarios
Step 3 - Data Sources
Primary Research
- Web Analytics
- Survey Reports
- Research Institute
- Latest Research Reports
- Opinion Leaders
Secondary Research
- Annual Reports
- White Paper
- Latest Press Release
- Industry Association
- Paid Database
- Investor Presentations

Step 4 - Data Triangulation
Involves using different sources of information in order to increase the validity of a study
These sources are likely to be stakeholders in a program - participants, other researchers, program staff, other community members, and so on.
Then we put all data in single framework & apply various statistical tools to find out the dynamic on the market.
During the analysis stage, feedback from the stakeholder groups would be compared to determine areas of agreement as well as areas of divergence