

Key Insights
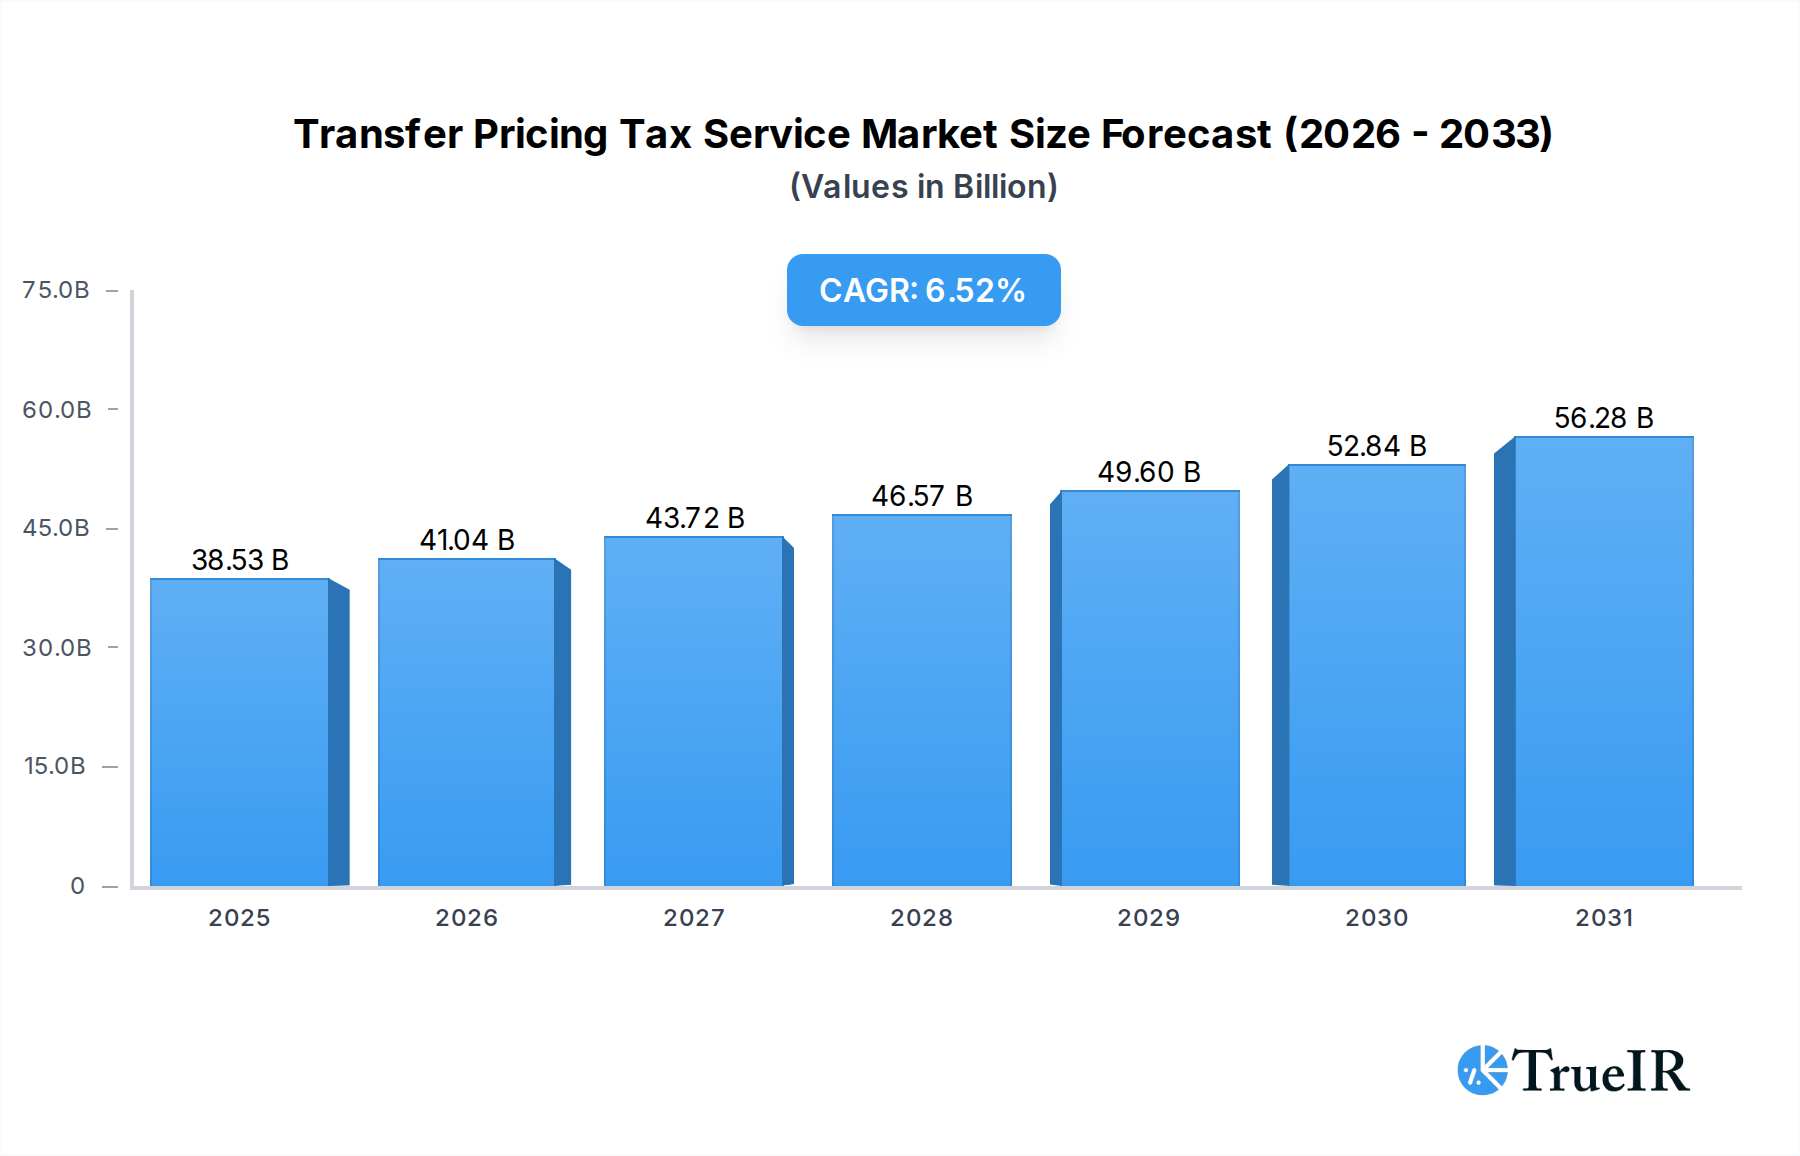
The Transfer Pricing Tax Service Market is poised for significant expansion, driven by the increasing complexity of global tax regulations and the persistent need for multinational corporations to optimize their intercompany transactions. Valued at $36.17 billion in 2023, the market is projected to grow substantially, registering a robust Compound Annual Growth Rate (CAGR) of 6.52% through the forecast period extending to 2033. This growth trajectory is anticipated to propel the market valuation to approximately $68.14 billion by the end of 2033. This robust expansion is primarily fueled by a confluence of factors, including the global push for tax transparency, stricter enforcement by tax authorities, and the evolving digital economy which introduces new challenges in valuing intangible assets and digital services.

Transfer Pricing Tax Service Market Size (In Billion)
The macro tailwinds supporting this market include the sustained increase in cross-border trade and investment, requiring intricate transfer pricing policies, documentation, and defense strategies. The ongoing implementation of the OECD's Base Erosion and Profit Shifting (BEPS) framework, coupled with new initiatives like Pillar One and Pillar Two, has fundamentally reshaped the international tax landscape, compelling companies to reassess their transfer pricing structures. This regulatory pressure directly translates into heightened demand for specialized advisory, compliance, and dispute resolution services. Furthermore, advancements in data analytics and artificial intelligence are beginning to influence service delivery, enabling more efficient compliance and proactive risk management. The strategic importance of optimizing tax positions while ensuring regulatory adherence makes the Transfer Pricing Tax Service Market an indispensable component of global enterprise financial planning. As companies navigate diverse tax jurisdictions and evolving regulatory requirements, the demand for sophisticated services, including those offered by the broader Financial Advisory Services Market, will continue to escalate, solidifying the market's upward trajectory.
Transfer Pricing Tax Service Company Market Share
Advisory & Value Chain Optimisation in Transfer Pricing Tax Service Market
The Advisory & Value Chain Optimisation segment currently holds the largest revenue share within the global Transfer Pricing Tax Service Market. This dominance stems from the strategic imperative for multinational corporations (MNCs) to not only comply with tax regulations but also to proactively design and optimize their operational and legal structures to achieve tax efficiency and manage risk effectively. Unlike reactive compliance and documentation, advisory services focus on forward-looking strategies, helping companies align their transfer pricing policies with their overall business model, supply chain, and commercial realities. This segment encompasses a broad range of services, including supply chain restructuring, intellectual property planning, permanent establishment risk assessment, and pre-filing consultation.
The complexity of modern business operations, particularly the growth of the digital economy and the increasing importance of intangible assets, further bolsters the demand for Advisory & Value Chain Optimisation. Valuing digital services, data, and intellectual property across multiple jurisdictions presents significant challenges that necessitate expert guidance beyond standard compliance frameworks. Key players such as PwC, EY, Deloitte, and KPMG are particularly strong in this segment, leveraging their extensive global networks and deep industry expertise to offer tailored solutions. These firms often integrate their transfer pricing advice with broader management consulting services, providing comprehensive strategies that consider legal, operational, and financial implications. The segment's share is not only dominant but also appears to be growing, driven by the dynamic regulatory environment—especially with the advent of new rules around global minimum tax (Pillar Two) and digital services taxation. Companies are increasingly seeking proactive advice to mitigate future tax controversies and ensure robust, defensible transfer pricing models, which is a key driver for the Management Consulting Market as well. The high-value, bespoke nature of these services commands premium fees, contributing significantly to the overall market revenue. Furthermore, the increasing need for integrated solutions across various business functions drives the demand for comprehensive Enterprise Resource Planning Software Market solutions that can support complex transfer pricing analyses.
Key Market Drivers or Constraints in Transfer Pricing Tax Service Market
The Transfer Pricing Tax Service Market is profoundly influenced by several intricate drivers and constraints, each with measurable impacts on market dynamics.
Drivers:
Global Regulatory Scrutiny and Harmonization Initiatives: The overarching driver is the intensified global regulatory landscape, particularly evident with the OECD's Base Erosion and Profit Shifting (BEPS) Action Plans, now evolving into Pillar One and Pillar Two. For instance, the implementation of Pillar Two's Global Anti-Base Erosion (GloBE) rules, impacting multinational enterprises with revenues exceeding EUR 750 million, necessitates a complete overhaul of existing transfer pricing policies and compliance strategies. This regulatory evolution directly compels firms to invest in advanced Compliance & Documentation services and proactive Advisory & Value Chain Optimisation, pushing the market forward by expanding the scope and depth of required services. The need for precise and consistent reporting across jurisdictions enhances the demand for robust Tax Compliance Software Market solutions.
Growth of the Digital Economy and Intangible Assets: The accelerated shift towards digital business models and the proliferation of intangible assets (e.g., software, brands, patents) create unprecedented challenges in value attribution for tax purposes. Traditional transfer pricing methods struggle to adequately address the unique economics of digital services and the cross-jurisdictional movement of IP. This complexity drives demand for highly specialized Advisory & Value Chain Optimisation services, particularly within the Information Technology Services Market, to establish defensible valuation methodologies. The increasing sophistication required further stimulates the Regulatory Technology Market, as firms seek automated solutions for intricate compliance.
Cross-Border Transaction Volume and Complexity: The continuous expansion of global trade and investment, including the rapid growth observed in the E-commerce Services Market, means more multinational corporations engage in a higher volume of intercompany transactions. Each transaction must be conducted at arm's length, necessitating rigorous analysis and documentation. This exponential growth in transaction volume and their inherent complexity fuels the demand for expert Transfer Pricing Tax Services, especially for Cross-Border Geographical Scope services, to mitigate tax risks and ensure compliance in diverse jurisdictions.
Constraints:
High Cost of Compliance and Specialist Expertise: A significant constraint is the substantial cost associated with engaging highly specialized transfer pricing tax service providers. While large enterprises can absorb these costs, Small & Medium Enterprises (SMEs) often find it prohibitive, potentially leading to under-compliance or reliance on less comprehensive solutions. This cost barrier can limit market penetration within the SME segment, despite their increasing involvement in cross-border activities.
Data Fragmentation and Integration Challenges: Effective transfer pricing relies heavily on granular financial and operational data from various internal systems (e.g., ERP, CRM). Many multinational corporations face significant challenges in collecting, integrating, and analyzing this disparate data. This data fragmentation complicates the accurate and timely preparation of transfer pricing documentation and analysis, potentially increasing project timelines and costs. This challenge underscores the need for better data governance and integrated Business Process Automation Market solutions, but it remains a practical hurdle for many organizations.
Competitive Ecosystem of Transfer Pricing Tax Service Market
The Transfer Pricing Tax Service Market is characterized by a mix of global professional services networks, specialized tax consultancies, and technology providers. The competitive landscape is largely dominated by the 'Big Four' accounting firms, which leverage their extensive global reach and multidisciplinary expertise. However, a growing number of mid-tier firms and niche players are carving out significant market shares, particularly by focusing on specific industries, geographies, or specialized services.
- PwC: A global leader in professional services, PwC offers comprehensive transfer pricing solutions encompassing planning, documentation, controversy resolution, and digital transformation in tax, leveraging its broad industry expertise and global network.
- EY: Renowned for its advisory capabilities, EY provides extensive transfer pricing services, focusing on strategic alignment, value chain transformation, and robust compliance strategies for multinational clients worldwide.
- Deloitte: With a strong focus on technology and innovation, Deloitte delivers integrated transfer pricing services, including advanced data analytics and digital tools to help clients manage risks and optimize their global tax positions.
- KPMG: KPMG offers a full suite of transfer pricing services, from policy design and implementation to dispute resolution, emphasizing a pragmatic approach to help clients navigate complex international tax regulations.
- RSM International: As a global network of independent assurance, tax, and consulting firms, RSM provides tailored transfer pricing advice, often serving middle-market companies with complex cross-border operations.
- Crowe: Crowe delivers specialized transfer pricing services, focusing on practical and defensible solutions for clients across various industries, emphasizing risk mitigation and operational efficiency.
- Grant Thornton: Grant Thornton offers comprehensive transfer pricing solutions, combining global insight with local expertise to help businesses manage their intercompany transactions and navigate regulatory challenges.
- Cherry Bekaert: This firm provides dedicated tax advisory and compliance services, including transfer pricing, often for growth-oriented companies seeking strategic tax planning and dispute resolution support.
- BDO: BDO’s transfer pricing team assists multinational enterprises with designing, implementing, and defending their transfer pricing policies, leveraging a globally integrated approach to tax planning and compliance.
- CohnReznick: CohnReznick offers specialized tax services, including transfer pricing, with a focus on delivering tailored strategies and compliance solutions for clients in complex industries.
- CBIZ: CBIZ provides various tax and advisory services, including transfer pricing, helping clients achieve tax efficiency and compliance through customized strategies and expert guidance.
- CliftonLarsonAllen (CLA): CLA delivers tax consulting, including transfer pricing, to a diverse client base, focusing on proactive planning and robust documentation to support international operations.
- EisnerAmper: EisnerAmper offers specialized transfer pricing expertise, assisting multinational companies with intricate valuation, documentation, and controversy management.
- Moss Adams: Moss Adams provides comprehensive tax services, including transfer pricing, catering to middle-market businesses and private companies with a focus on practical and compliant solutions.
- Kroll: Kroll provides independent valuation and consulting services, including transfer pricing analysis and dispute resolution support, particularly for complex valuation issues involving intangibles.
- Tax Consultants International: A specialized firm offering bespoke transfer pricing solutions, focusing on in-depth expertise and client-specific strategies for complex cross-border scenarios.
- Thomson Reuters: A leading provider of integrated tax and regulatory software solutions, Thomson Reuters offers technology that supports transfer pricing documentation, analysis, and compliance workflows.
- HLS Global: HLS Global offers specialized transfer pricing and international tax services, focusing on delivering strategic insights and compliant solutions for multinational enterprises.
Recent Developments & Milestones in Transfer Pricing Tax Service Market
April 2024: The OECD released updated administrative guidance on the Pillar Two GloBE rules, providing further clarity on the implementation and coordination of these complex international tax regulations. This development significantly impacts multinational enterprises, requiring immediate adjustments to their transfer pricing policies and compliance frameworks.
January 2024: A major global consulting firm (e.g., Deloitte) announced the launch of an enhanced AI-powered platform designed to automate aspects of transfer pricing data collection, analysis, and documentation. This innovation aims to reduce manual effort and improve accuracy for clients navigating intricate global tax requirements.
October 2023: The European Union introduced new legislative proposals aimed at strengthening the framework for mandatory disclosure rules (MDR) related to cross-border tax arrangements, building upon the DAC6 directive. These proposals increase the reporting burden and demand for proactive advisory services within the Transfer Pricing Tax Service Market.
June 2023: A prominent tax technology provider (e.g., Thomson Reuters) acquired a specialized data analytics company focusing on intercompany transaction analysis. This strategic move aims to integrate advanced data capabilities into existing Tax Compliance Software Market solutions, enhancing their offerings for transfer pricing professionals.
March 2023: Several national tax authorities, including those in high-growth regions, began implementing stricter enforcement measures and conducting more detailed audits focused on transfer pricing, particularly concerning intangible assets and intra-group financing. This increased scrutiny underscores the critical need for robust documentation and defensible policies.
Regional Market Breakdown for Transfer Pricing Tax Service Market
The global Transfer Pricing Tax Service Market exhibits varied growth dynamics across its key geographical segments, influenced by regional economic conditions, regulatory maturity, and the presence of multinational corporations.
North America holds a significant share of the Transfer Pricing Tax Service Market, characterized by its mature regulatory environment and a high concentration of large multinational enterprises, particularly from the Information Technology Services Market. The U.S. and Canada are early adopters of advanced transfer pricing strategies and sophisticated compliance tools. The region's demand is driven by constant updates to its tax code, such as the Tax Cuts and Jobs Act (TCJA) which introduced new transfer pricing considerations, and a highly active audit environment. This necessitates ongoing advisory and compliance support, often leading to a stable, high-value market segment.
Europe represents another substantial market, shaped by the complex interplay of EU directives and individual country-specific tax laws. Countries like Germany, France, and the UK are leaders in demand, driven by their large economies and extensive cross-border trade within the EU and globally. The region is at the forefront of implementing BEPS and Pillar Two rules, creating a sustained demand for Advisory & Value Chain Optimisation and Compliance & Documentation services. The fragmented regulatory landscape, while challenging, ensures a continuous need for expert transfer pricing guidance.
Asia Pacific is identified as the fastest-growing region in the Transfer Pricing Tax Service Market. Rapid economic expansion, increasing foreign direct investment, and the emergence of multinational corporations from countries like China, India, and Japan are key growth catalysts. Developing tax regimes in many APAC nations are becoming more sophisticated, adopting OECD guidelines and increasing enforcement, leading to a surge in demand for transfer pricing services. The growth in the E-commerce Services Market across Asia Pacific particularly fuels the demand for complex intercompany transaction analysis related to digital platforms and intangible assets. While starting from a smaller base, its CAGR is projected to outpace other regions due to this dynamic regulatory and economic environment.
Middle East & Africa is an emerging market for transfer pricing services, witnessing significant growth propelled by economic diversification efforts and the introduction of new tax frameworks, such as corporate income tax in the UAE. As countries in the GCC and North Africa aim to attract international investment, the need for transparent and compliant transfer pricing practices is growing. While currently a smaller market share, the increasing number of cross-border projects and evolving regulatory landscapes signal strong future growth potential.
South America presents a mixed landscape, with countries like Brazil and Argentina having complex, often volatile, tax regulations that necessitate robust transfer pricing planning and defense. The demand is significant for both Domestic and Cross-Border Geographical Scope services, driven by economic fluctuations and the need for companies to navigate frequently changing local rules. The region's focus on primary industries and natural resources also introduces unique valuation challenges that require specialized transfer pricing expertise.

Transfer Pricing Tax Service Regional Market Share
Technology Innovation Trajectory in Transfer Pricing Tax Service Market
The Transfer Pricing Tax Service Market is undergoing a transformative period fueled by technological innovation, primarily centered around data analytics, artificial intelligence (AI), and automation. These technologies are poised to disrupt traditional service delivery models and reinforce the strategic value of advisory services.
One of the most disruptive emerging technologies is AI and Machine Learning (ML) for enhanced data analysis and predictive analytics. Adoption timelines for basic AI tools in data collection and preliminary analysis are already underway among leading service providers and large enterprises. However, more advanced applications, such as predictive modeling for audit risk or real-time transfer pricing adjustments, are still in early to mid-stage adoption (3-5 years for widespread integration). R&D investment is significant, with major consulting firms and dedicated tax technology vendors like those in the Tax Compliance Software Market investing heavily to develop algorithms that can process vast datasets, identify anomalies, and model various transfer pricing scenarios. This technology threatens incumbent manual data processing and review tasks, enabling faster, more accurate compliance while simultaneously empowering advisors with deeper insights for strategic planning. It fundamentally alters the scope of services, shifting focus from data collation to data interpretation and strategic counsel.
Another impactful innovation is the rise of Robotic Process Automation (RPA) and intelligent automation for routine compliance tasks. RPA is rapidly gaining traction for automating repetitive, rule-based processes involved in transfer pricing documentation and report generation. The adoption timeline for RPA is relatively short, with many firms already implementing it for tasks like extracting financial data from Enterprise Resource Planning Software Market systems and populating templates. R&D in this area focuses on integrating RPA with cognitive capabilities to handle more unstructured data. This technology directly threatens the manual, high-volume Compliance & Documentation services, making them more efficient and cost-effective. It also reinforces the Business Process Automation Market by showcasing tangible benefits in the tax domain. The outcome is a reduction in human error and operational costs, allowing human experts to focus on complex advisory, dispute resolution, and strategic aspects of transfer pricing.
Lastly, the exploration of blockchain and distributed ledger technology (DLT) for secure intercompany transaction recording and verification represents a longer-term, yet potentially highly disruptive, innovation. While widespread adoption is still 5-10 years away due to scalability and regulatory hurdles, R&D is exploring its potential for creating immutable records of intercompany transactions, streamlining audit processes, and enhancing transparency. This could fundamentally reinforce incumbent business models by providing an indisputable source of truth for transactions, reducing disputes and enhancing trust between MNEs and tax authorities. It could also significantly influence how data is managed and verified within the Regulatory Technology Market, reducing the need for extensive manual reconciliation.
Regulatory & Policy Landscape Shaping Transfer Pricing Tax Service Market
The Transfer Pricing Tax Service Market operates within a constantly evolving and increasingly stringent global regulatory and policy landscape. Major international frameworks and national legislation significantly dictate the demand for and nature of transfer pricing services.
At the forefront is the OECD's Base Erosion and Profit Shifting (BEPS) Action Plan, which has fundamentally reshaped international tax norms. Key actions impacting transfer pricing include Action 8-10 (Aligning Transfer Pricing Outcomes with Value Creation, particularly concerning intangibles, intra-group services, and financing) and Action 13 (Guidance on Transfer Pricing Documentation and Country-by-Country Reporting). These actions have led to mandatory country-by-country (CbC) reporting, master files, and local files, increasing transparency requirements and the administrative burden for multinational enterprises. The recent advancements in the Pillar One and Pillar Two initiatives by the OECD further intensify this. Pillar Two, with its Global Anti-Base Erosion (GloBE) rules, aims to ensure large multinational corporations pay a minimum corporate income tax rate of 15% on profits in every jurisdiction where they operate. This necessitates a complete re-evaluation of intercompany pricing strategies and a significant surge in demand for expert Transfer Pricing Tax Service to ensure compliance with complex calculations and reporting obligations. The Regulatory Technology Market is seeing significant growth in tools to help navigate these new complexities.
Regionally, the European Union has been active with directives such as the Anti-Tax Avoidance Directive (ATAD) and the Directive on Administrative Cooperation (DAC), particularly DAC6, which mandates the reporting of certain cross-border tax arrangements. These policies impose stricter disclosure obligations and increase the need for proactive tax planning and risk management, driving demand for advisory services in the Transfer Pricing Tax Service Market. Member states are also implementing their own nuanced transfer pricing rules, leading to a patchwork of regulations that demand specialized local expertise.
In North America, the United States operates under its own comprehensive Treasury Regulations, notably Section 482, which provides extensive guidance on transfer pricing. Recent legislative changes, while less dramatic than the BEPS project, continue to refine these rules, requiring ongoing vigilance and adaptation from companies. Canada also has a robust transfer pricing regime aligned with OECD principles. The focus on outbound and inbound transactions, as well as the unique aspects of intangible property transfers, keeps demand high for specialized services.
Developing economies in Asia Pacific, such as China and India, are rapidly maturing their transfer pricing regulations, often incorporating elements of the BEPS framework. Their tax authorities are increasingly sophisticated in auditing transfer pricing practices, leading to a surge in demand for compliance, documentation, and controversy resolution services. Many of these countries are also implementing digital service taxes, creating further complexities for valuing digital economy transactions.
Overall, the global trend is towards greater transparency, increased substance requirements, and enhanced cooperation among tax authorities. This environment mandates that businesses adopt a proactive, integrated approach to transfer pricing, relying heavily on specialized expertise to navigate the complex web of international and national tax laws, ensuring both compliance and efficient tax management.
Transfer Pricing Tax Service Segmentation
-
1. Service Type
- 1.1. Advisory & Value Chain Optimisation
- 1.2. Compliance & Documentation
- 1.3. Implementation & Compliance Management
- 1.4. Controversy & Dispute Resolution
- 1.5. Others
-
2. Enterprise Size
- 2.1. Large Enterprises
- 2.2. Small & Medium Enterprises (SMEs)
-
3. Geographical Scope
- 3.1. Domestic
- 3.2. Cross-Border
-
4. End User Industry
- 4.1. BFSI
- 4.2. Information Technology & Telecom
- 4.3. Manufacturing
- 4.4. Healthcare & Pharmaceuticals
- 4.5. Retail & E-commerce
- 4.6. Energy & Utilities
- 4.7. Automotive
- 4.8. Consumer Goods
- 4.9. Others
Transfer Pricing Tax Service Segmentation By Geography
-
1. North America
- 1.1. United States
- 1.2. Canada
- 1.3. Mexico
-
2. South America
- 2.1. Brazil
- 2.2. Argentina
- 2.3. Rest of South America
-
3. Europe
- 3.1. United Kingdom
- 3.2. Germany
- 3.3. France
- 3.4. Italy
- 3.5. Spain
- 3.6. Russia
- 3.7. Benelux
- 3.8. Nordics
- 3.9. Rest of Europe
-
4. Middle East & Africa
- 4.1. Turkey
- 4.2. Israel
- 4.3. GCC
- 4.4. North Africa
- 4.5. South Africa
- 4.6. Rest of Middle East & Africa
-
5. Asia Pacific
- 5.1. China
- 5.2. India
- 5.3. Japan
- 5.4. South Korea
- 5.5. ASEAN
- 5.6. Oceania
- 5.7. Rest of Asia Pacific
Transfer Pricing Tax Service Regional Market Share
Geographic Coverage of Transfer Pricing Tax Service
Transfer Pricing Tax Service REPORT HIGHLIGHTS
| Aspects | Details |
|---|---|
| Study Period | 2020-2034 |
| Base Year | 2025 |
| Estimated Year | 2026 |
| Forecast Period | 2026-2034 |
| Historical Period | 2020-2025 |
| Growth Rate | CAGR of 6.52% from 2020-2034 |
| Segmentation |
|
Table of Contents
- 1. Introduction
- 1.1. Research Scope
- 1.2. Market Segmentation
- 1.3. Research Objective
- 1.4. Definitions and Assumptions
- 2. Executive Summary
- 2.1. Market Snapshot
- 3. Market Dynamics
- 3.1. Market Drivers
- 3.2. Market Restrains
- 3.3. Market Trends
- 3.4. Market Opportunities
- 4. Market Factor Analysis
- 4.1. Porters Five Forces
- 4.1.1. Bargaining Power of Suppliers
- 4.1.2. Bargaining Power of Buyers
- 4.1.3. Threat of New Entrants
- 4.1.4. Threat of Substitutes
- 4.1.5. Competitive Rivalry
- 4.2. PESTEL analysis
- 4.3. BCG Analysis
- 4.3.1. Stars (High Growth, High Market Share)
- 4.3.2. Cash Cows (Low Growth, High Market Share)
- 4.3.3. Question Mark (High Growth, Low Market Share)
- 4.3.4. Dogs (Low Growth, Low Market Share)
- 4.4. Ansoff Matrix Analysis
- 4.5. Supply Chain Analysis
- 4.6. Regulatory Landscape
- 4.7. Current Market Potential and Opportunity Assessment (TAM–SAM–SOM Framework)
- 4.8. TIR Analyst Note
- 4.1. Porters Five Forces
- 5. Market Analysis, Insights and Forecast 2021-2033
- 5.1. Market Analysis, Insights and Forecast - by Service Type
- 5.1.1. Advisory & Value Chain Optimisation
- 5.1.2. Compliance & Documentation
- 5.1.3. Implementation & Compliance Management
- 5.1.4. Controversy & Dispute Resolution
- 5.1.5. Others
- 5.2. Market Analysis, Insights and Forecast - by Enterprise Size
- 5.2.1. Large Enterprises
- 5.2.2. Small & Medium Enterprises (SMEs)
- 5.3. Market Analysis, Insights and Forecast - by Geographical Scope
- 5.3.1. Domestic
- 5.3.2. Cross-Border
- 5.4. Market Analysis, Insights and Forecast - by End User Industry
- 5.4.1. BFSI
- 5.4.2. Information Technology & Telecom
- 5.4.3. Manufacturing
- 5.4.4. Healthcare & Pharmaceuticals
- 5.4.5. Retail & E-commerce
- 5.4.6. Energy & Utilities
- 5.4.7. Automotive
- 5.4.8. Consumer Goods
- 5.4.9. Others
- 5.5. Market Analysis, Insights and Forecast - by Region
- 5.5.1. North America
- 5.5.2. South America
- 5.5.3. Europe
- 5.5.4. Middle East & Africa
- 5.5.5. Asia Pacific
- 5.1. Market Analysis, Insights and Forecast - by Service Type
- 6. Global Transfer Pricing Tax Service Analysis, Insights and Forecast, 2021-2033
- 6.1. Market Analysis, Insights and Forecast - by Service Type
- 6.1.1. Advisory & Value Chain Optimisation
- 6.1.2. Compliance & Documentation
- 6.1.3. Implementation & Compliance Management
- 6.1.4. Controversy & Dispute Resolution
- 6.1.5. Others
- 6.2. Market Analysis, Insights and Forecast - by Enterprise Size
- 6.2.1. Large Enterprises
- 6.2.2. Small & Medium Enterprises (SMEs)
- 6.3. Market Analysis, Insights and Forecast - by Geographical Scope
- 6.3.1. Domestic
- 6.3.2. Cross-Border
- 6.4. Market Analysis, Insights and Forecast - by End User Industry
- 6.4.1. BFSI
- 6.4.2. Information Technology & Telecom
- 6.4.3. Manufacturing
- 6.4.4. Healthcare & Pharmaceuticals
- 6.4.5. Retail & E-commerce
- 6.4.6. Energy & Utilities
- 6.4.7. Automotive
- 6.4.8. Consumer Goods
- 6.4.9. Others
- 6.1. Market Analysis, Insights and Forecast - by Service Type
- 7. North America Transfer Pricing Tax Service Analysis, Insights and Forecast, 2020-2032
- 7.1. Market Analysis, Insights and Forecast - by Service Type
- 7.1.1. Advisory & Value Chain Optimisation
- 7.1.2. Compliance & Documentation
- 7.1.3. Implementation & Compliance Management
- 7.1.4. Controversy & Dispute Resolution
- 7.1.5. Others
- 7.2. Market Analysis, Insights and Forecast - by Enterprise Size
- 7.2.1. Large Enterprises
- 7.2.2. Small & Medium Enterprises (SMEs)
- 7.3. Market Analysis, Insights and Forecast - by Geographical Scope
- 7.3.1. Domestic
- 7.3.2. Cross-Border
- 7.4. Market Analysis, Insights and Forecast - by End User Industry
- 7.4.1. BFSI
- 7.4.2. Information Technology & Telecom
- 7.4.3. Manufacturing
- 7.4.4. Healthcare & Pharmaceuticals
- 7.4.5. Retail & E-commerce
- 7.4.6. Energy & Utilities
- 7.4.7. Automotive
- 7.4.8. Consumer Goods
- 7.4.9. Others
- 7.1. Market Analysis, Insights and Forecast - by Service Type
- 8. South America Transfer Pricing Tax Service Analysis, Insights and Forecast, 2020-2032
- 8.1. Market Analysis, Insights and Forecast - by Service Type
- 8.1.1. Advisory & Value Chain Optimisation
- 8.1.2. Compliance & Documentation
- 8.1.3. Implementation & Compliance Management
- 8.1.4. Controversy & Dispute Resolution
- 8.1.5. Others
- 8.2. Market Analysis, Insights and Forecast - by Enterprise Size
- 8.2.1. Large Enterprises
- 8.2.2. Small & Medium Enterprises (SMEs)
- 8.3. Market Analysis, Insights and Forecast - by Geographical Scope
- 8.3.1. Domestic
- 8.3.2. Cross-Border
- 8.4. Market Analysis, Insights and Forecast - by End User Industry
- 8.4.1. BFSI
- 8.4.2. Information Technology & Telecom
- 8.4.3. Manufacturing
- 8.4.4. Healthcare & Pharmaceuticals
- 8.4.5. Retail & E-commerce
- 8.4.6. Energy & Utilities
- 8.4.7. Automotive
- 8.4.8. Consumer Goods
- 8.4.9. Others
- 8.1. Market Analysis, Insights and Forecast - by Service Type
- 9. Europe Transfer Pricing Tax Service Analysis, Insights and Forecast, 2020-2032
- 9.1. Market Analysis, Insights and Forecast - by Service Type
- 9.1.1. Advisory & Value Chain Optimisation
- 9.1.2. Compliance & Documentation
- 9.1.3. Implementation & Compliance Management
- 9.1.4. Controversy & Dispute Resolution
- 9.1.5. Others
- 9.2. Market Analysis, Insights and Forecast - by Enterprise Size
- 9.2.1. Large Enterprises
- 9.2.2. Small & Medium Enterprises (SMEs)
- 9.3. Market Analysis, Insights and Forecast - by Geographical Scope
- 9.3.1. Domestic
- 9.3.2. Cross-Border
- 9.4. Market Analysis, Insights and Forecast - by End User Industry
- 9.4.1. BFSI
- 9.4.2. Information Technology & Telecom
- 9.4.3. Manufacturing
- 9.4.4. Healthcare & Pharmaceuticals
- 9.4.5. Retail & E-commerce
- 9.4.6. Energy & Utilities
- 9.4.7. Automotive
- 9.4.8. Consumer Goods
- 9.4.9. Others
- 9.1. Market Analysis, Insights and Forecast - by Service Type
- 10. Middle East & Africa Transfer Pricing Tax Service Analysis, Insights and Forecast, 2020-2032
- 10.1. Market Analysis, Insights and Forecast - by Service Type
- 10.1.1. Advisory & Value Chain Optimisation
- 10.1.2. Compliance & Documentation
- 10.1.3. Implementation & Compliance Management
- 10.1.4. Controversy & Dispute Resolution
- 10.1.5. Others
- 10.2. Market Analysis, Insights and Forecast - by Enterprise Size
- 10.2.1. Large Enterprises
- 10.2.2. Small & Medium Enterprises (SMEs)
- 10.3. Market Analysis, Insights and Forecast - by Geographical Scope
- 10.3.1. Domestic
- 10.3.2. Cross-Border
- 10.4. Market Analysis, Insights and Forecast - by End User Industry
- 10.4.1. BFSI
- 10.4.2. Information Technology & Telecom
- 10.4.3. Manufacturing
- 10.4.4. Healthcare & Pharmaceuticals
- 10.4.5. Retail & E-commerce
- 10.4.6. Energy & Utilities
- 10.4.7. Automotive
- 10.4.8. Consumer Goods
- 10.4.9. Others
- 10.1. Market Analysis, Insights and Forecast - by Service Type
- 11. Asia Pacific Transfer Pricing Tax Service Analysis, Insights and Forecast, 2020-2032
- 11.1. Market Analysis, Insights and Forecast - by Service Type
- 11.1.1. Advisory & Value Chain Optimisation
- 11.1.2. Compliance & Documentation
- 11.1.3. Implementation & Compliance Management
- 11.1.4. Controversy & Dispute Resolution
- 11.1.5. Others
- 11.2. Market Analysis, Insights and Forecast - by Enterprise Size
- 11.2.1. Large Enterprises
- 11.2.2. Small & Medium Enterprises (SMEs)
- 11.3. Market Analysis, Insights and Forecast - by Geographical Scope
- 11.3.1. Domestic
- 11.3.2. Cross-Border
- 11.4. Market Analysis, Insights and Forecast - by End User Industry
- 11.4.1. BFSI
- 11.4.2. Information Technology & Telecom
- 11.4.3. Manufacturing
- 11.4.4. Healthcare & Pharmaceuticals
- 11.4.5. Retail & E-commerce
- 11.4.6. Energy & Utilities
- 11.4.7. Automotive
- 11.4.8. Consumer Goods
- 11.4.9. Others
- 11.1. Market Analysis, Insights and Forecast - by Service Type
- 12. Competitive Analysis
- 12.1. Company Profiles
- 12.1.1 PwC
- 12.1.1.1. Company Overview
- 12.1.1.2. Products
- 12.1.1.3. Company Financials
- 12.1.1.4. SWOT Analysis
- 12.1.2 EY
- 12.1.2.1. Company Overview
- 12.1.2.2. Products
- 12.1.2.3. Company Financials
- 12.1.2.4. SWOT Analysis
- 12.1.3 Deloitte
- 12.1.3.1. Company Overview
- 12.1.3.2. Products
- 12.1.3.3. Company Financials
- 12.1.3.4. SWOT Analysis
- 12.1.4 KPMG
- 12.1.4.1. Company Overview
- 12.1.4.2. Products
- 12.1.4.3. Company Financials
- 12.1.4.4. SWOT Analysis
- 12.1.5 RSM International
- 12.1.5.1. Company Overview
- 12.1.5.2. Products
- 12.1.5.3. Company Financials
- 12.1.5.4. SWOT Analysis
- 12.1.6 Crowe
- 12.1.6.1. Company Overview
- 12.1.6.2. Products
- 12.1.6.3. Company Financials
- 12.1.6.4. SWOT Analysis
- 12.1.7 Grant Thornton
- 12.1.7.1. Company Overview
- 12.1.7.2. Products
- 12.1.7.3. Company Financials
- 12.1.7.4. SWOT Analysis
- 12.1.8 Cherry Bekaert
- 12.1.8.1. Company Overview
- 12.1.8.2. Products
- 12.1.8.3. Company Financials
- 12.1.8.4. SWOT Analysis
- 12.1.9 BDO
- 12.1.9.1. Company Overview
- 12.1.9.2. Products
- 12.1.9.3. Company Financials
- 12.1.9.4. SWOT Analysis
- 12.1.10 CohnReznick
- 12.1.10.1. Company Overview
- 12.1.10.2. Products
- 12.1.10.3. Company Financials
- 12.1.10.4. SWOT Analysis
- 12.1.11 CBIZ
- 12.1.11.1. Company Overview
- 12.1.11.2. Products
- 12.1.11.3. Company Financials
- 12.1.11.4. SWOT Analysis
- 12.1.12 CliftonLarsonAllen (CLA)
- 12.1.12.1. Company Overview
- 12.1.12.2. Products
- 12.1.12.3. Company Financials
- 12.1.12.4. SWOT Analysis
- 12.1.13 EisnerAmper
- 12.1.13.1. Company Overview
- 12.1.13.2. Products
- 12.1.13.3. Company Financials
- 12.1.13.4. SWOT Analysis
- 12.1.14 Moss Adams
- 12.1.14.1. Company Overview
- 12.1.14.2. Products
- 12.1.14.3. Company Financials
- 12.1.14.4. SWOT Analysis
- 12.1.15 Kroll
- 12.1.15.1. Company Overview
- 12.1.15.2. Products
- 12.1.15.3. Company Financials
- 12.1.15.4. SWOT Analysis
- 12.1.16 Tax Consultants International
- 12.1.16.1. Company Overview
- 12.1.16.2. Products
- 12.1.16.3. Company Financials
- 12.1.16.4. SWOT Analysis
- 12.1.17 Thomson Reuters
- 12.1.17.1. Company Overview
- 12.1.17.2. Products
- 12.1.17.3. Company Financials
- 12.1.17.4. SWOT Analysis
- 12.1.18 HLS Global
- 12.1.18.1. Company Overview
- 12.1.18.2. Products
- 12.1.18.3. Company Financials
- 12.1.18.4. SWOT Analysis
- 12.1.1 PwC
- 12.2. Market Entropy
- 12.2.1 Company's Key Areas Served
- 12.2.2 Recent Developments
- 12.3. Company Market Share Analysis 2025
- 12.3.1 Top 5 Companies Market Share Analysis
- 12.3.2 Top 3 Companies Market Share Analysis
- 12.4. List of Potential Customers
- 13. Research Methodology
List of Figures
- Figure 1: Global Transfer Pricing Tax Service Revenue Breakdown (billion, %) by Region 2025 & 2033
- Figure 2: North America Transfer Pricing Tax Service Revenue (billion), by Service Type 2025 & 2033
- Figure 3: North America Transfer Pricing Tax Service Revenue Share (%), by Service Type 2025 & 2033
- Figure 4: North America Transfer Pricing Tax Service Revenue (billion), by Enterprise Size 2025 & 2033
- Figure 5: North America Transfer Pricing Tax Service Revenue Share (%), by Enterprise Size 2025 & 2033
- Figure 6: North America Transfer Pricing Tax Service Revenue (billion), by Geographical Scope 2025 & 2033
- Figure 7: North America Transfer Pricing Tax Service Revenue Share (%), by Geographical Scope 2025 & 2033
- Figure 8: North America Transfer Pricing Tax Service Revenue (billion), by End User Industry 2025 & 2033
- Figure 9: North America Transfer Pricing Tax Service Revenue Share (%), by End User Industry 2025 & 2033
- Figure 10: North America Transfer Pricing Tax Service Revenue (billion), by Country 2025 & 2033
- Figure 11: North America Transfer Pricing Tax Service Revenue Share (%), by Country 2025 & 2033
- Figure 12: South America Transfer Pricing Tax Service Revenue (billion), by Service Type 2025 & 2033
- Figure 13: South America Transfer Pricing Tax Service Revenue Share (%), by Service Type 2025 & 2033
- Figure 14: South America Transfer Pricing Tax Service Revenue (billion), by Enterprise Size 2025 & 2033
- Figure 15: South America Transfer Pricing Tax Service Revenue Share (%), by Enterprise Size 2025 & 2033
- Figure 16: South America Transfer Pricing Tax Service Revenue (billion), by Geographical Scope 2025 & 2033
- Figure 17: South America Transfer Pricing Tax Service Revenue Share (%), by Geographical Scope 2025 & 2033
- Figure 18: South America Transfer Pricing Tax Service Revenue (billion), by End User Industry 2025 & 2033
- Figure 19: South America Transfer Pricing Tax Service Revenue Share (%), by End User Industry 2025 & 2033
- Figure 20: South America Transfer Pricing Tax Service Revenue (billion), by Country 2025 & 2033
- Figure 21: South America Transfer Pricing Tax Service Revenue Share (%), by Country 2025 & 2033
- Figure 22: Europe Transfer Pricing Tax Service Revenue (billion), by Service Type 2025 & 2033
- Figure 23: Europe Transfer Pricing Tax Service Revenue Share (%), by Service Type 2025 & 2033
- Figure 24: Europe Transfer Pricing Tax Service Revenue (billion), by Enterprise Size 2025 & 2033
- Figure 25: Europe Transfer Pricing Tax Service Revenue Share (%), by Enterprise Size 2025 & 2033
- Figure 26: Europe Transfer Pricing Tax Service Revenue (billion), by Geographical Scope 2025 & 2033
- Figure 27: Europe Transfer Pricing Tax Service Revenue Share (%), by Geographical Scope 2025 & 2033
- Figure 28: Europe Transfer Pricing Tax Service Revenue (billion), by End User Industry 2025 & 2033
- Figure 29: Europe Transfer Pricing Tax Service Revenue Share (%), by End User Industry 2025 & 2033
- Figure 30: Europe Transfer Pricing Tax Service Revenue (billion), by Country 2025 & 2033
- Figure 31: Europe Transfer Pricing Tax Service Revenue Share (%), by Country 2025 & 2033
- Figure 32: Middle East & Africa Transfer Pricing Tax Service Revenue (billion), by Service Type 2025 & 2033
- Figure 33: Middle East & Africa Transfer Pricing Tax Service Revenue Share (%), by Service Type 2025 & 2033
- Figure 34: Middle East & Africa Transfer Pricing Tax Service Revenue (billion), by Enterprise Size 2025 & 2033
- Figure 35: Middle East & Africa Transfer Pricing Tax Service Revenue Share (%), by Enterprise Size 2025 & 2033
- Figure 36: Middle East & Africa Transfer Pricing Tax Service Revenue (billion), by Geographical Scope 2025 & 2033
- Figure 37: Middle East & Africa Transfer Pricing Tax Service Revenue Share (%), by Geographical Scope 2025 & 2033
- Figure 38: Middle East & Africa Transfer Pricing Tax Service Revenue (billion), by End User Industry 2025 & 2033
- Figure 39: Middle East & Africa Transfer Pricing Tax Service Revenue Share (%), by End User Industry 2025 & 2033
- Figure 40: Middle East & Africa Transfer Pricing Tax Service Revenue (billion), by Country 2025 & 2033
- Figure 41: Middle East & Africa Transfer Pricing Tax Service Revenue Share (%), by Country 2025 & 2033
- Figure 42: Asia Pacific Transfer Pricing Tax Service Revenue (billion), by Service Type 2025 & 2033
- Figure 43: Asia Pacific Transfer Pricing Tax Service Revenue Share (%), by Service Type 2025 & 2033
- Figure 44: Asia Pacific Transfer Pricing Tax Service Revenue (billion), by Enterprise Size 2025 & 2033
- Figure 45: Asia Pacific Transfer Pricing Tax Service Revenue Share (%), by Enterprise Size 2025 & 2033
- Figure 46: Asia Pacific Transfer Pricing Tax Service Revenue (billion), by Geographical Scope 2025 & 2033
- Figure 47: Asia Pacific Transfer Pricing Tax Service Revenue Share (%), by Geographical Scope 2025 & 2033
- Figure 48: Asia Pacific Transfer Pricing Tax Service Revenue (billion), by End User Industry 2025 & 2033
- Figure 49: Asia Pacific Transfer Pricing Tax Service Revenue Share (%), by End User Industry 2025 & 2033
- Figure 50: Asia Pacific Transfer Pricing Tax Service Revenue (billion), by Country 2025 & 2033
- Figure 51: Asia Pacific Transfer Pricing Tax Service Revenue Share (%), by Country 2025 & 2033
List of Tables
- Table 1: Global Transfer Pricing Tax Service Revenue billion Forecast, by Service Type 2020 & 2033
- Table 2: Global Transfer Pricing Tax Service Revenue billion Forecast, by Enterprise Size 2020 & 2033
- Table 3: Global Transfer Pricing Tax Service Revenue billion Forecast, by Geographical Scope 2020 & 2033
- Table 4: Global Transfer Pricing Tax Service Revenue billion Forecast, by End User Industry 2020 & 2033
- Table 5: Global Transfer Pricing Tax Service Revenue billion Forecast, by Region 2020 & 2033
- Table 6: Global Transfer Pricing Tax Service Revenue billion Forecast, by Service Type 2020 & 2033
- Table 7: Global Transfer Pricing Tax Service Revenue billion Forecast, by Enterprise Size 2020 & 2033
- Table 8: Global Transfer Pricing Tax Service Revenue billion Forecast, by Geographical Scope 2020 & 2033
- Table 9: Global Transfer Pricing Tax Service Revenue billion Forecast, by End User Industry 2020 & 2033
- Table 10: Global Transfer Pricing Tax Service Revenue billion Forecast, by Country 2020 & 2033
- Table 11: United States Transfer Pricing Tax Service Revenue (billion) Forecast, by Application 2020 & 2033
- Table 12: Canada Transfer Pricing Tax Service Revenue (billion) Forecast, by Application 2020 & 2033
- Table 13: Mexico Transfer Pricing Tax Service Revenue (billion) Forecast, by Application 2020 & 2033
- Table 14: Global Transfer Pricing Tax Service Revenue billion Forecast, by Service Type 2020 & 2033
- Table 15: Global Transfer Pricing Tax Service Revenue billion Forecast, by Enterprise Size 2020 & 2033
- Table 16: Global Transfer Pricing Tax Service Revenue billion Forecast, by Geographical Scope 2020 & 2033
- Table 17: Global Transfer Pricing Tax Service Revenue billion Forecast, by End User Industry 2020 & 2033
- Table 18: Global Transfer Pricing Tax Service Revenue billion Forecast, by Country 2020 & 2033
- Table 19: Brazil Transfer Pricing Tax Service Revenue (billion) Forecast, by Application 2020 & 2033
- Table 20: Argentina Transfer Pricing Tax Service Revenue (billion) Forecast, by Application 2020 & 2033
- Table 21: Rest of South America Transfer Pricing Tax Service Revenue (billion) Forecast, by Application 2020 & 2033
- Table 22: Global Transfer Pricing Tax Service Revenue billion Forecast, by Service Type 2020 & 2033
- Table 23: Global Transfer Pricing Tax Service Revenue billion Forecast, by Enterprise Size 2020 & 2033
- Table 24: Global Transfer Pricing Tax Service Revenue billion Forecast, by Geographical Scope 2020 & 2033
- Table 25: Global Transfer Pricing Tax Service Revenue billion Forecast, by End User Industry 2020 & 2033
- Table 26: Global Transfer Pricing Tax Service Revenue billion Forecast, by Country 2020 & 2033
- Table 27: United Kingdom Transfer Pricing Tax Service Revenue (billion) Forecast, by Application 2020 & 2033
- Table 28: Germany Transfer Pricing Tax Service Revenue (billion) Forecast, by Application 2020 & 2033
- Table 29: France Transfer Pricing Tax Service Revenue (billion) Forecast, by Application 2020 & 2033
- Table 30: Italy Transfer Pricing Tax Service Revenue (billion) Forecast, by Application 2020 & 2033
- Table 31: Spain Transfer Pricing Tax Service Revenue (billion) Forecast, by Application 2020 & 2033
- Table 32: Russia Transfer Pricing Tax Service Revenue (billion) Forecast, by Application 2020 & 2033
- Table 33: Benelux Transfer Pricing Tax Service Revenue (billion) Forecast, by Application 2020 & 2033
- Table 34: Nordics Transfer Pricing Tax Service Revenue (billion) Forecast, by Application 2020 & 2033
- Table 35: Rest of Europe Transfer Pricing Tax Service Revenue (billion) Forecast, by Application 2020 & 2033
- Table 36: Global Transfer Pricing Tax Service Revenue billion Forecast, by Service Type 2020 & 2033
- Table 37: Global Transfer Pricing Tax Service Revenue billion Forecast, by Enterprise Size 2020 & 2033
- Table 38: Global Transfer Pricing Tax Service Revenue billion Forecast, by Geographical Scope 2020 & 2033
- Table 39: Global Transfer Pricing Tax Service Revenue billion Forecast, by End User Industry 2020 & 2033
- Table 40: Global Transfer Pricing Tax Service Revenue billion Forecast, by Country 2020 & 2033
- Table 41: Turkey Transfer Pricing Tax Service Revenue (billion) Forecast, by Application 2020 & 2033
- Table 42: Israel Transfer Pricing Tax Service Revenue (billion) Forecast, by Application 2020 & 2033
- Table 43: GCC Transfer Pricing Tax Service Revenue (billion) Forecast, by Application 2020 & 2033
- Table 44: North Africa Transfer Pricing Tax Service Revenue (billion) Forecast, by Application 2020 & 2033
- Table 45: South Africa Transfer Pricing Tax Service Revenue (billion) Forecast, by Application 2020 & 2033
- Table 46: Rest of Middle East & Africa Transfer Pricing Tax Service Revenue (billion) Forecast, by Application 2020 & 2033
- Table 47: Global Transfer Pricing Tax Service Revenue billion Forecast, by Service Type 2020 & 2033
- Table 48: Global Transfer Pricing Tax Service Revenue billion Forecast, by Enterprise Size 2020 & 2033
- Table 49: Global Transfer Pricing Tax Service Revenue billion Forecast, by Geographical Scope 2020 & 2033
- Table 50: Global Transfer Pricing Tax Service Revenue billion Forecast, by End User Industry 2020 & 2033
- Table 51: Global Transfer Pricing Tax Service Revenue billion Forecast, by Country 2020 & 2033
- Table 52: China Transfer Pricing Tax Service Revenue (billion) Forecast, by Application 2020 & 2033
- Table 53: India Transfer Pricing Tax Service Revenue (billion) Forecast, by Application 2020 & 2033
- Table 54: Japan Transfer Pricing Tax Service Revenue (billion) Forecast, by Application 2020 & 2033
- Table 55: South Korea Transfer Pricing Tax Service Revenue (billion) Forecast, by Application 2020 & 2033
- Table 56: ASEAN Transfer Pricing Tax Service Revenue (billion) Forecast, by Application 2020 & 2033
- Table 57: Oceania Transfer Pricing Tax Service Revenue (billion) Forecast, by Application 2020 & 2033
- Table 58: Rest of Asia Pacific Transfer Pricing Tax Service Revenue (billion) Forecast, by Application 2020 & 2033
Frequently Asked Questions
1. What is the projected Compound Annual Growth Rate (CAGR) of the Transfer Pricing Tax Service?
The projected CAGR is approximately 6.52%.
2. Which companies are prominent players in the Transfer Pricing Tax Service?
Key companies in the market include PwC, EY, Deloitte, KPMG, RSM International, Crowe, Grant Thornton, Cherry Bekaert, BDO, CohnReznick, CBIZ, CliftonLarsonAllen (CLA), EisnerAmper, Moss Adams, Kroll, Tax Consultants International, Thomson Reuters, HLS Global.
3. What are the main segments of the Transfer Pricing Tax Service?
The market segments include Service Type, Enterprise Size, Geographical Scope, End User Industry.
4. Can you provide details about the market size?
The market size is estimated to be USD 36.17 billion as of 2022.
5. What are some drivers contributing to market growth?
N/A
6. What are the notable trends driving market growth?
N/A
7. Are there any restraints impacting market growth?
N/A
8. Can you provide examples of recent developments in the market?
N/A
9. What pricing options are available for accessing the report?
Pricing options include single-user, multi-user, and enterprise licenses priced at USD 3350.00, USD 5025.00, and USD 6700.00 respectively.
10. Is the market size provided in terms of value or volume?
The market size is provided in terms of value, measured in billion.
11. Are there any specific market keywords associated with the report?
Yes, the market keyword associated with the report is "Transfer Pricing Tax Service," which aids in identifying and referencing the specific market segment covered.
12. How do I determine which pricing option suits my needs best?
The pricing options vary based on user requirements and access needs. Individual users may opt for single-user licenses, while businesses requiring broader access may choose multi-user or enterprise licenses for cost-effective access to the report.
13. Are there any additional resources or data provided in the Transfer Pricing Tax Service report?
While the report offers comprehensive insights, it's advisable to review the specific contents or supplementary materials provided to ascertain if additional resources or data are available.
14. How can I stay updated on further developments or reports in the Transfer Pricing Tax Service?
To stay informed about further developments, trends, and reports in the Transfer Pricing Tax Service, consider subscribing to industry newsletters, following relevant companies and organizations, or regularly checking reputable industry news sources and publications.
Methodology
Step 1 - Identification of Relevant Samples Size from Population Database


Step 2 - Approaches for Defining Global Market Size (Value, Volume* & Price*)

Note*: In applicable scenarios
Step 3 - Data Sources
Primary Research
- Web Analytics
- Survey Reports
- Research Institute
- Latest Research Reports
- Opinion Leaders
Secondary Research
- Annual Reports
- White Paper
- Latest Press Release
- Industry Association
- Paid Database
- Investor Presentations

Step 4 - Data Triangulation
Involves using different sources of information in order to increase the validity of a study
These sources are likely to be stakeholders in a program - participants, other researchers, program staff, other community members, and so on.
Then we put all data in single framework & apply various statistical tools to find out the dynamic on the market.
During the analysis stage, feedback from the stakeholder groups would be compared to determine areas of agreement as well as areas of divergence