

Key Insights
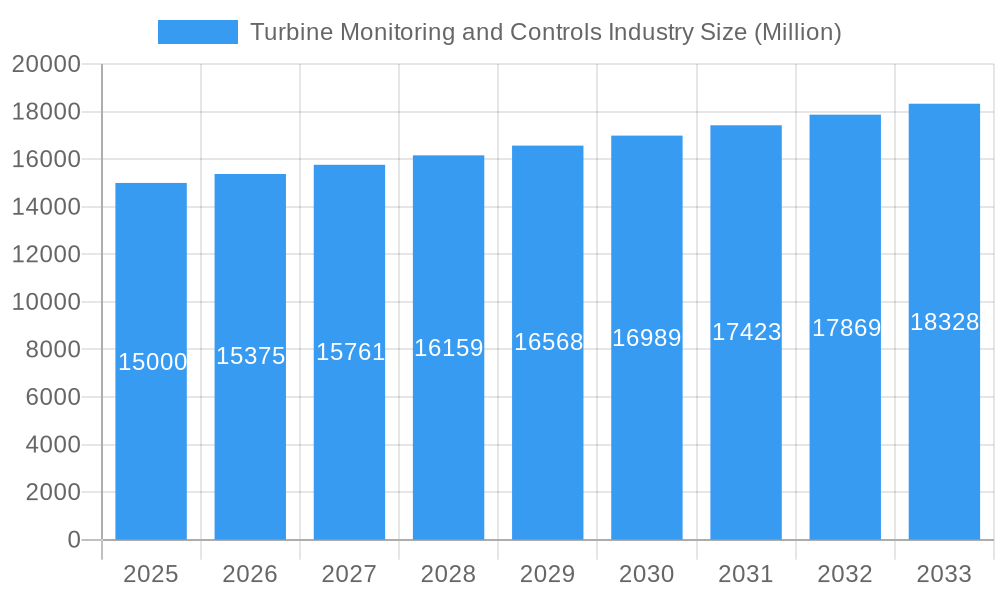
The global turbine monitoring and control systems market is experiencing robust growth, driven by the increasing demand for efficient and reliable energy generation across various sectors. A compound annual growth rate (CAGR) exceeding 2.5% indicates a steadily expanding market, projected to reach a substantial value within the forecast period (2025-2033). Key market drivers include the rising adoption of renewable energy sources like wind and hydro power, necessitating sophisticated monitoring and control systems for optimal performance and grid stability. Furthermore, stringent environmental regulations are pushing for improved efficiency and reduced emissions from traditional power generation, fueling demand for advanced control technologies capable of optimizing turbine operation and minimizing waste. The market is segmented by turbine type (steam, gas, wind, hydro) and control function (speed, temperature, load, pressure), offering diverse opportunities for specialized solutions. Leading players like Rockwell Automation, Honeywell, ABB, and Siemens are actively investing in research and development, driving innovation in areas such as predictive maintenance, data analytics, and automation, further enhancing market growth.
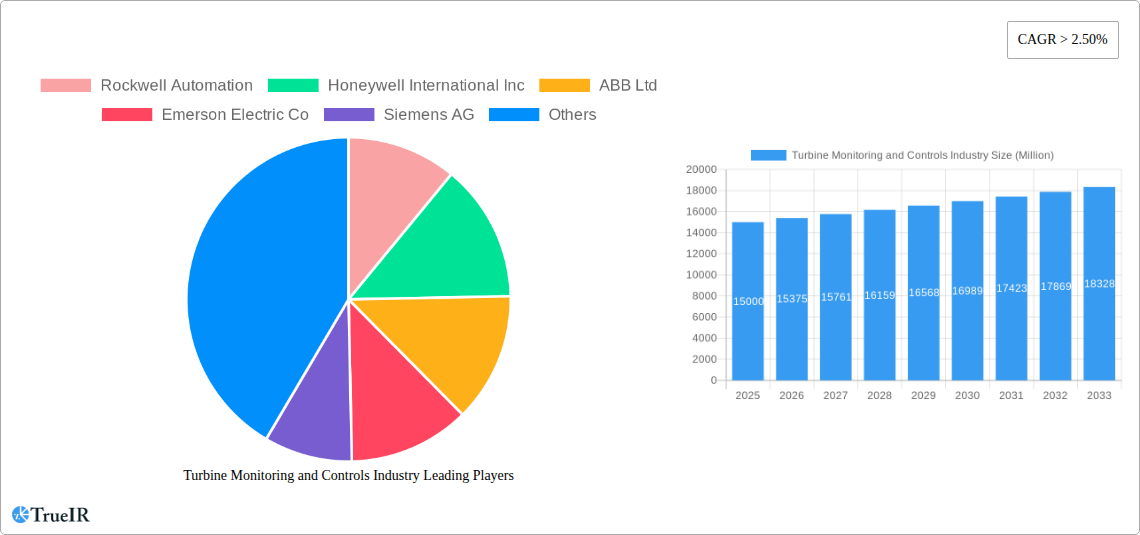
Turbine Monitoring and Controls Industry Market Size (In Billion)
Growth is fueled by several key trends. The increasing integration of digital technologies, such as the Internet of Things (IoT) and artificial intelligence (AI), is enabling predictive maintenance and optimized operational efficiency. This allows for proactive identification of potential issues, reducing downtime and maintenance costs. Furthermore, the focus on improving grid stability and reliability is prompting the adoption of advanced control systems capable of responding effectively to fluctuating energy demands and integrating renewable energy sources seamlessly. However, the market faces challenges, including high initial investment costs associated with implementing sophisticated monitoring and control systems, especially for smaller operators. Nevertheless, the long-term benefits of reduced operational costs, enhanced efficiency, and improved sustainability are expected to overcome these restraints and drive continued market expansion across various geographical regions, with North America and Asia-Pacific expected to dominate due to substantial investments in energy infrastructure and renewable energy projects. The market is expected to witness significant growth in emerging economies as well, given the increasing focus on infrastructure development and energy security.
Turbine Monitoring and Controls Industry Company Market Share
Turbine Monitoring and Controls Industry Market Report: 2019-2033
This comprehensive report provides a detailed analysis of the Turbine Monitoring and Controls industry, projecting a market valued at $XX Million in 2025 and forecasting robust growth to $XX Million by 2033. The study covers the period 2019-2033, with 2025 serving as the base and estimated year. Key players like Rockwell Automation, Honeywell International Inc, ABB Ltd, Emerson Electric Co, Siemens AG, Mita-Teknik AS, Mitsubishi Heavy Industries Ltd, Innoway-sea Group, General Electric Company, and Rolls-Royce Holding PLC are analyzed, along with market segmentations by turbine type and control function. This report is essential for industry stakeholders seeking to understand market dynamics, identify growth opportunities, and navigate the competitive landscape.
Turbine Monitoring and Controls Industry Market Structure & Competitive Landscape
The Turbine Monitoring and Controls market exhibits a moderately concentrated structure, with a few major players holding significant market share. The Herfindahl-Hirschman Index (HHI) for 2024 is estimated at xx, indicating a moderately concentrated market. However, the presence of numerous smaller, specialized firms fosters competition and innovation. Key drivers of innovation include the need for enhanced efficiency, improved safety, and reduced operational costs. Regulatory impacts, particularly concerning environmental standards and cybersecurity, are significant, shaping product development and market access. Product substitutes, such as alternative energy sources and decentralized control systems, exert pressure on the market, although their overall impact remains limited due to established infrastructure and economic factors.
End-user segmentation is primarily driven by the power generation sector (thermal, renewable), encompassing utilities, independent power producers (IPPs), and industrial facilities. The market also witnesses considerable activity in mergers and acquisitions (M&A). Over the historical period (2019-2024), an estimated xx number of M&A deals were recorded, with a total transaction value of $XX Million. These activities often involve strategic acquisitions aimed at expanding product portfolios, gaining access to new technologies, or enhancing geographic reach.
Turbine Monitoring and Controls Industry Market Trends & Opportunities
The global Turbine Monitoring and Controls market is experiencing significant growth, fueled by the increasing demand for efficient and reliable power generation across various sectors. The Compound Annual Growth Rate (CAGR) from 2025 to 2033 is projected to be xx%, driven by factors like expanding renewable energy capacity, modernization of existing power plants, and stringent environmental regulations. Market penetration rates for advanced control systems are steadily increasing, particularly in emerging economies, reflecting a shift towards improved operational efficiency and reduced emissions. Technological advancements, such as the integration of artificial intelligence (AI) and machine learning (ML) for predictive maintenance and optimized operations, are reshaping the market landscape. Consumer preferences are shifting towards solutions that offer enhanced reliability, reduced downtime, and improved data analytics capabilities. Competitive dynamics are marked by intense rivalry among established players, coupled with the emergence of innovative startups offering specialized solutions.
Dominant Markets & Segments in Turbine Monitoring and Controls Industry
The Asia-Pacific region is expected to dominate the Turbine Monitoring and Controls market during the forecast period, driven by substantial investments in power generation infrastructure and expanding renewable energy capacity. China and India are key contributors to this growth.
- Key Growth Drivers for Asia-Pacific: Rapid industrialization, rising energy demand, government incentives for renewable energy projects, and increasing adoption of advanced control technologies.
Within the segment breakdown:
- Type: The Gas Turbine Control System segment currently holds the largest market share due to its widespread application in power generation and industrial processes. However, the Wind Turbine Control System segment is projected to exhibit the fastest growth rate over the forecast period, driven by the global shift toward renewable energy sources.
- Function: Speed control systems represent the largest segment, reflecting the critical role of speed regulation in turbine operation. However, the demand for advanced control functions such as temperature and pressure control is increasing steadily, driven by requirements for enhanced efficiency and safety.
Turbine Monitoring and Controls Industry Product Analysis
Recent product innovations focus on enhancing system integration, improving data analytics capabilities, and incorporating advanced functionalities such as predictive maintenance and remote diagnostics. These advancements cater to the growing need for improved operational efficiency, reduced downtime, and enhanced safety. The key competitive advantages stem from superior technological capabilities, robust system reliability, and comprehensive service support. The market favors solutions that offer seamless integration with existing infrastructure and user-friendly interfaces.
Key Drivers, Barriers & Challenges in Turbine Monitoring and Controls Industry
Key Drivers: Stringent environmental regulations promoting renewable energy adoption are a primary driver. Technological advancements in areas such as AI/ML, IoT, and digital twins are transforming operational efficiency. Increasing demand for reliable and efficient power generation across various sectors also fuels market expansion.
Key Challenges: Supply chain disruptions, especially concerning semiconductor components, have caused production delays and increased costs. Regulatory complexities associated with cybersecurity and data privacy add to the operational challenges. Intense competition among established players and emerging startups creates pricing pressures and necessitates continuous innovation. These challenges, if unaddressed, could cumulatively impact market growth by an estimated xx% over the forecast period.
Growth Drivers in the Turbine Monitoring and Controls Industry Market
Growth is propelled by the global push for renewable energy, driving demand for advanced wind and hydro turbine control systems. Technological improvements in efficiency, predictive maintenance, and remote monitoring are also significant drivers. Government policies supporting sustainable energy and infrastructure development further stimulate market expansion.
Challenges Impacting Turbine Monitoring and Controls Industry Growth
High initial investment costs for advanced control systems can be a barrier to adoption, particularly for smaller operators. Supply chain vulnerabilities, particularly concerning specialized components, pose a risk to production and delivery timelines. The evolving regulatory landscape necessitates continuous adaptation and compliance, adding to operational complexity.
Key Players Shaping the Turbine Monitoring and Controls Industry Market
- Rockwell Automation
- Honeywell International Inc
- ABB Ltd
- Emerson Electric Co
- Siemens AG
- Mita-Teknik AS
- Mitsubishi Heavy Industries Ltd
- Innoway-sea Group
- General Electric Company
- Rolls-Royce Holding PLC
Significant Turbine Monitoring and Controls Industry Industry Milestones
- December 2021: Emerson Electric secured a contract for the Wansley power plant modernization, highlighting the demand for advanced control solutions.
- December 2021: Denmark's plan to add 3 GW of offshore wind capacity by 2030 signals significant future market expansion.
Future Outlook for Turbine Monitoring and Controls Industry Market
The Turbine Monitoring and Controls market is poised for sustained growth, driven by the global energy transition and technological advancements. Strategic opportunities exist for companies focusing on developing innovative solutions that address sustainability concerns, improve operational efficiency, and enhance data analytics capabilities. The market potential is significant, with substantial growth expected in renewable energy sectors and emerging economies.
Turbine Monitoring and Controls Industry Segmentation
-
1. Type
- 1.1. Steam Turbine Control System
- 1.2. Gas Turbine Control System
- 1.3. Wind Turbine Control System
- 1.4. Hydro Turbine Control System
-
2. Function
- 2.1. Speed Control
- 2.2. Temperature Control
- 2.3. Load Control
- 2.4. Pressure Control
- 2.5. Other Functions
Turbine Monitoring and Controls Industry Segmentation By Geography
- 1. North America
- 2. Europe
- 3. Asia Pacific
- 4. South America
- 5. Middle East
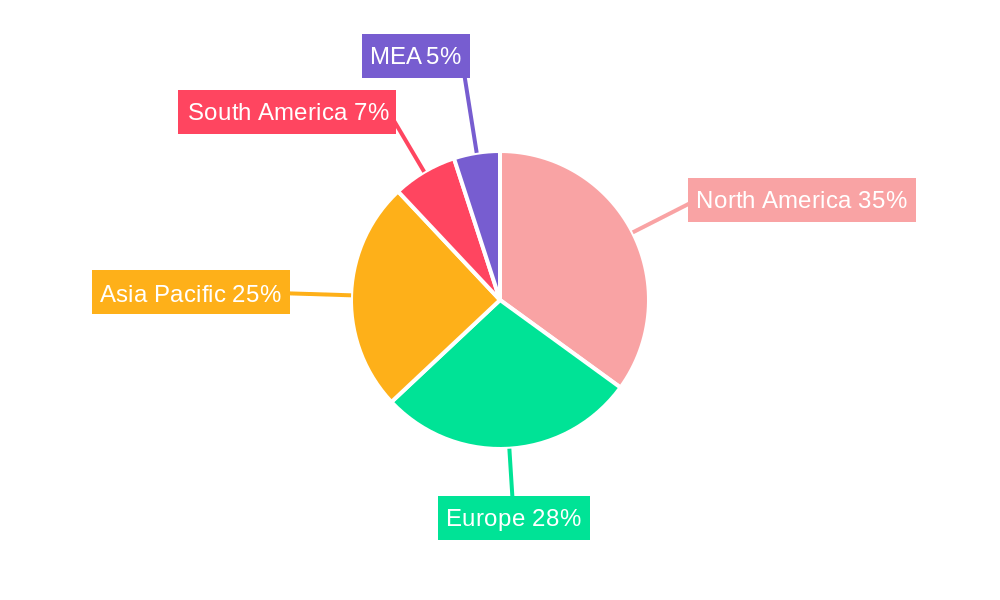
Turbine Monitoring and Controls Industry Regional Market Share
Geographic Coverage of Turbine Monitoring and Controls Industry
Turbine Monitoring and Controls Industry REPORT HIGHLIGHTS
| Aspects | Details |
|---|---|
| Study Period | 2020-2034 |
| Base Year | 2025 |
| Estimated Year | 2026 |
| Forecast Period | 2026-2034 |
| Historical Period | 2020-2025 |
| Growth Rate | CAGR of 5.8% from 2020-2034 |
| Segmentation |
|
Table of Contents
- 1. Introduction
- 1.1. Research Scope
- 1.2. Market Segmentation
- 1.3. Research Objective
- 1.4. Definitions and Assumptions
- 2. Executive Summary
- 2.1. Market Snapshot
- 3. Market Dynamics
- 3.1. Market Drivers
- 3.2. Market Restrains
- 3.3. Market Trends
- 3.4. Market Opportunities
- 4. Market Factor Analysis
- 4.1. Porters Five Forces
- 4.1.1. Bargaining Power of Suppliers
- 4.1.2. Bargaining Power of Buyers
- 4.1.3. Threat of New Entrants
- 4.1.4. Threat of Substitutes
- 4.1.5. Competitive Rivalry
- 4.2. PESTEL analysis
- 4.3. BCG Analysis
- 4.3.1. Stars (High Growth, High Market Share)
- 4.3.2. Cash Cows (Low Growth, High Market Share)
- 4.3.3. Question Mark (High Growth, Low Market Share)
- 4.3.4. Dogs (Low Growth, Low Market Share)
- 4.4. Ansoff Matrix Analysis
- 4.5. Supply Chain Analysis
- 4.6. Regulatory Landscape
- 4.7. Current Market Potential and Opportunity Assessment (TAM–SAM–SOM Framework)
- 4.8. TIR Analyst Note
- 4.1. Porters Five Forces
- 5. Market Analysis, Insights and Forecast 2021-2033
- 5.1. Market Analysis, Insights and Forecast - by Type
- 5.1.1. Steam Turbine Control System
- 5.1.2. Gas Turbine Control System
- 5.1.3. Wind Turbine Control System
- 5.1.4. Hydro Turbine Control System
- 5.2. Market Analysis, Insights and Forecast - by Function
- 5.2.1. Speed Control
- 5.2.2. Temperature Control
- 5.2.3. Load Control
- 5.2.4. Pressure Control
- 5.2.5. Other Functions
- 5.3. Market Analysis, Insights and Forecast - by Region
- 5.3.1. North America
- 5.3.2. Europe
- 5.3.3. Asia Pacific
- 5.3.4. South America
- 5.3.5. Middle East
- 5.1. Market Analysis, Insights and Forecast - by Type
- 6. Global Turbine Monitoring and Controls Industry Analysis, Insights and Forecast, 2021-2033
- 6.1. Market Analysis, Insights and Forecast - by Type
- 6.1.1. Steam Turbine Control System
- 6.1.2. Gas Turbine Control System
- 6.1.3. Wind Turbine Control System
- 6.1.4. Hydro Turbine Control System
- 6.2. Market Analysis, Insights and Forecast - by Function
- 6.2.1. Speed Control
- 6.2.2. Temperature Control
- 6.2.3. Load Control
- 6.2.4. Pressure Control
- 6.2.5. Other Functions
- 6.1. Market Analysis, Insights and Forecast - by Type
- 7. North America Turbine Monitoring and Controls Industry Analysis, Insights and Forecast, 2020-2032
- 7.1. Market Analysis, Insights and Forecast - by Type
- 7.1.1. Steam Turbine Control System
- 7.1.2. Gas Turbine Control System
- 7.1.3. Wind Turbine Control System
- 7.1.4. Hydro Turbine Control System
- 7.2. Market Analysis, Insights and Forecast - by Function
- 7.2.1. Speed Control
- 7.2.2. Temperature Control
- 7.2.3. Load Control
- 7.2.4. Pressure Control
- 7.2.5. Other Functions
- 7.1. Market Analysis, Insights and Forecast - by Type
- 8. Europe Turbine Monitoring and Controls Industry Analysis, Insights and Forecast, 2020-2032
- 8.1. Market Analysis, Insights and Forecast - by Type
- 8.1.1. Steam Turbine Control System
- 8.1.2. Gas Turbine Control System
- 8.1.3. Wind Turbine Control System
- 8.1.4. Hydro Turbine Control System
- 8.2. Market Analysis, Insights and Forecast - by Function
- 8.2.1. Speed Control
- 8.2.2. Temperature Control
- 8.2.3. Load Control
- 8.2.4. Pressure Control
- 8.2.5. Other Functions
- 8.1. Market Analysis, Insights and Forecast - by Type
- 9. Asia Pacific Turbine Monitoring and Controls Industry Analysis, Insights and Forecast, 2020-2032
- 9.1. Market Analysis, Insights and Forecast - by Type
- 9.1.1. Steam Turbine Control System
- 9.1.2. Gas Turbine Control System
- 9.1.3. Wind Turbine Control System
- 9.1.4. Hydro Turbine Control System
- 9.2. Market Analysis, Insights and Forecast - by Function
- 9.2.1. Speed Control
- 9.2.2. Temperature Control
- 9.2.3. Load Control
- 9.2.4. Pressure Control
- 9.2.5. Other Functions
- 9.1. Market Analysis, Insights and Forecast - by Type
- 10. South America Turbine Monitoring and Controls Industry Analysis, Insights and Forecast, 2020-2032
- 10.1. Market Analysis, Insights and Forecast - by Type
- 10.1.1. Steam Turbine Control System
- 10.1.2. Gas Turbine Control System
- 10.1.3. Wind Turbine Control System
- 10.1.4. Hydro Turbine Control System
- 10.2. Market Analysis, Insights and Forecast - by Function
- 10.2.1. Speed Control
- 10.2.2. Temperature Control
- 10.2.3. Load Control
- 10.2.4. Pressure Control
- 10.2.5. Other Functions
- 10.1. Market Analysis, Insights and Forecast - by Type
- 11. Middle East Turbine Monitoring and Controls Industry Analysis, Insights and Forecast, 2020-2032
- 11.1. Market Analysis, Insights and Forecast - by Type
- 11.1.1. Steam Turbine Control System
- 11.1.2. Gas Turbine Control System
- 11.1.3. Wind Turbine Control System
- 11.1.4. Hydro Turbine Control System
- 11.2. Market Analysis, Insights and Forecast - by Function
- 11.2.1. Speed Control
- 11.2.2. Temperature Control
- 11.2.3. Load Control
- 11.2.4. Pressure Control
- 11.2.5. Other Functions
- 11.1. Market Analysis, Insights and Forecast - by Type
- 12. Competitive Analysis
- 12.1. Company Profiles
- 12.1.1 Rockwell Automation
- 12.1.1.1. Company Overview
- 12.1.1.2. Products
- 12.1.1.3. Company Financials
- 12.1.1.4. SWOT Analysis
- 12.1.2 Honeywell International Inc
- 12.1.2.1. Company Overview
- 12.1.2.2. Products
- 12.1.2.3. Company Financials
- 12.1.2.4. SWOT Analysis
- 12.1.3 ABB Ltd
- 12.1.3.1. Company Overview
- 12.1.3.2. Products
- 12.1.3.3. Company Financials
- 12.1.3.4. SWOT Analysis
- 12.1.4 Emerson Electric Co
- 12.1.4.1. Company Overview
- 12.1.4.2. Products
- 12.1.4.3. Company Financials
- 12.1.4.4. SWOT Analysis
- 12.1.5 Siemens AG
- 12.1.5.1. Company Overview
- 12.1.5.2. Products
- 12.1.5.3. Company Financials
- 12.1.5.4. SWOT Analysis
- 12.1.6 Mita-Teknik AS
- 12.1.6.1. Company Overview
- 12.1.6.2. Products
- 12.1.6.3. Company Financials
- 12.1.6.4. SWOT Analysis
- 12.1.7 Mitsubishi Heavy Industries Ltd*List Not Exhaustive
- 12.1.7.1. Company Overview
- 12.1.7.2. Products
- 12.1.7.3. Company Financials
- 12.1.7.4. SWOT Analysis
- 12.1.8 Innoway-sea Group
- 12.1.8.1. Company Overview
- 12.1.8.2. Products
- 12.1.8.3. Company Financials
- 12.1.8.4. SWOT Analysis
- 12.1.9 General Electric Company
- 12.1.9.1. Company Overview
- 12.1.9.2. Products
- 12.1.9.3. Company Financials
- 12.1.9.4. SWOT Analysis
- 12.1.10 Rolls-Royce Holding PLC
- 12.1.10.1. Company Overview
- 12.1.10.2. Products
- 12.1.10.3. Company Financials
- 12.1.10.4. SWOT Analysis
- 12.1.1 Rockwell Automation
- 12.2. Market Entropy
- 12.2.1 Company's Key Areas Served
- 12.2.2 Recent Developments
- 12.3. Company Market Share Analysis 2025
- 12.3.1 Top 5 Companies Market Share Analysis
- 12.3.2 Top 3 Companies Market Share Analysis
- 12.4. List of Potential Customers
- 13. Research Methodology
List of Figures
- Figure 1: Global Turbine Monitoring and Controls Industry Revenue Breakdown (billion, %) by Region 2025 & 2033
- Figure 2: North America Turbine Monitoring and Controls Industry Revenue (billion), by Type 2025 & 2033
- Figure 3: North America Turbine Monitoring and Controls Industry Revenue Share (%), by Type 2025 & 2033
- Figure 4: North America Turbine Monitoring and Controls Industry Revenue (billion), by Function 2025 & 2033
- Figure 5: North America Turbine Monitoring and Controls Industry Revenue Share (%), by Function 2025 & 2033
- Figure 6: North America Turbine Monitoring and Controls Industry Revenue (billion), by Country 2025 & 2033
- Figure 7: North America Turbine Monitoring and Controls Industry Revenue Share (%), by Country 2025 & 2033
- Figure 8: Europe Turbine Monitoring and Controls Industry Revenue (billion), by Type 2025 & 2033
- Figure 9: Europe Turbine Monitoring and Controls Industry Revenue Share (%), by Type 2025 & 2033
- Figure 10: Europe Turbine Monitoring and Controls Industry Revenue (billion), by Function 2025 & 2033
- Figure 11: Europe Turbine Monitoring and Controls Industry Revenue Share (%), by Function 2025 & 2033
- Figure 12: Europe Turbine Monitoring and Controls Industry Revenue (billion), by Country 2025 & 2033
- Figure 13: Europe Turbine Monitoring and Controls Industry Revenue Share (%), by Country 2025 & 2033
- Figure 14: Asia Pacific Turbine Monitoring and Controls Industry Revenue (billion), by Type 2025 & 2033
- Figure 15: Asia Pacific Turbine Monitoring and Controls Industry Revenue Share (%), by Type 2025 & 2033
- Figure 16: Asia Pacific Turbine Monitoring and Controls Industry Revenue (billion), by Function 2025 & 2033
- Figure 17: Asia Pacific Turbine Monitoring and Controls Industry Revenue Share (%), by Function 2025 & 2033
- Figure 18: Asia Pacific Turbine Monitoring and Controls Industry Revenue (billion), by Country 2025 & 2033
- Figure 19: Asia Pacific Turbine Monitoring and Controls Industry Revenue Share (%), by Country 2025 & 2033
- Figure 20: South America Turbine Monitoring and Controls Industry Revenue (billion), by Type 2025 & 2033
- Figure 21: South America Turbine Monitoring and Controls Industry Revenue Share (%), by Type 2025 & 2033
- Figure 22: South America Turbine Monitoring and Controls Industry Revenue (billion), by Function 2025 & 2033
- Figure 23: South America Turbine Monitoring and Controls Industry Revenue Share (%), by Function 2025 & 2033
- Figure 24: South America Turbine Monitoring and Controls Industry Revenue (billion), by Country 2025 & 2033
- Figure 25: South America Turbine Monitoring and Controls Industry Revenue Share (%), by Country 2025 & 2033
- Figure 26: Middle East Turbine Monitoring and Controls Industry Revenue (billion), by Type 2025 & 2033
- Figure 27: Middle East Turbine Monitoring and Controls Industry Revenue Share (%), by Type 2025 & 2033
- Figure 28: Middle East Turbine Monitoring and Controls Industry Revenue (billion), by Function 2025 & 2033
- Figure 29: Middle East Turbine Monitoring and Controls Industry Revenue Share (%), by Function 2025 & 2033
- Figure 30: Middle East Turbine Monitoring and Controls Industry Revenue (billion), by Country 2025 & 2033
- Figure 31: Middle East Turbine Monitoring and Controls Industry Revenue Share (%), by Country 2025 & 2033
List of Tables
- Table 1: Global Turbine Monitoring and Controls Industry Revenue billion Forecast, by Type 2020 & 2033
- Table 2: Global Turbine Monitoring and Controls Industry Revenue billion Forecast, by Function 2020 & 2033
- Table 3: Global Turbine Monitoring and Controls Industry Revenue billion Forecast, by Region 2020 & 2033
- Table 4: Global Turbine Monitoring and Controls Industry Revenue billion Forecast, by Type 2020 & 2033
- Table 5: Global Turbine Monitoring and Controls Industry Revenue billion Forecast, by Function 2020 & 2033
- Table 6: Global Turbine Monitoring and Controls Industry Revenue billion Forecast, by Country 2020 & 2033
- Table 7: Global Turbine Monitoring and Controls Industry Revenue billion Forecast, by Type 2020 & 2033
- Table 8: Global Turbine Monitoring and Controls Industry Revenue billion Forecast, by Function 2020 & 2033
- Table 9: Global Turbine Monitoring and Controls Industry Revenue billion Forecast, by Country 2020 & 2033
- Table 10: Global Turbine Monitoring and Controls Industry Revenue billion Forecast, by Type 2020 & 2033
- Table 11: Global Turbine Monitoring and Controls Industry Revenue billion Forecast, by Function 2020 & 2033
- Table 12: Global Turbine Monitoring and Controls Industry Revenue billion Forecast, by Country 2020 & 2033
- Table 13: Global Turbine Monitoring and Controls Industry Revenue billion Forecast, by Type 2020 & 2033
- Table 14: Global Turbine Monitoring and Controls Industry Revenue billion Forecast, by Function 2020 & 2033
- Table 15: Global Turbine Monitoring and Controls Industry Revenue billion Forecast, by Country 2020 & 2033
- Table 16: Global Turbine Monitoring and Controls Industry Revenue billion Forecast, by Type 2020 & 2033
- Table 17: Global Turbine Monitoring and Controls Industry Revenue billion Forecast, by Function 2020 & 2033
- Table 18: Global Turbine Monitoring and Controls Industry Revenue billion Forecast, by Country 2020 & 2033
Frequently Asked Questions
1. What is the projected Compound Annual Growth Rate (CAGR) of the Turbine Monitoring and Controls Industry?
The projected CAGR is approximately 5.8%.
2. Which companies are prominent players in the Turbine Monitoring and Controls Industry?
Key companies in the market include Rockwell Automation, Honeywell International Inc, ABB Ltd, Emerson Electric Co, Siemens AG, Mita-Teknik AS, Mitsubishi Heavy Industries Ltd*List Not Exhaustive, Innoway-sea Group, General Electric Company, Rolls-Royce Holding PLC.
3. What are the main segments of the Turbine Monitoring and Controls Industry?
The market segments include Type, Function.
4. Can you provide details about the market size?
The market size is estimated to be USD 21.6 billion as of 2022.
5. What are some drivers contributing to market growth?
4.; Increasing Power Generation Capacity Worldwide4.; Rise In Electricity Demand Due Increase Industrial And Infrastructural Development Activities.
6. What are the notable trends driving market growth?
Wind Turbine Control Systems Expected to Witness Significant Growth.
7. Are there any restraints impacting market growth?
4.; Growth In Distributed Energy Generation.
8. Can you provide examples of recent developments in the market?
In December 2021, Emerson Electric was selected by the Municipal Electric Authority of Georgia for the modernization of the Wansley power plant. Under the agreement, the old gas and steam turbine control systems will be replaced with a unified Ovation automation platform, which is an advanced control and monitoring solution offered by the company.
9. What pricing options are available for accessing the report?
Pricing options include single-user, multi-user, and enterprise licenses priced at USD 4750, USD 5250, and USD 8750 respectively.
10. Is the market size provided in terms of value or volume?
The market size is provided in terms of value, measured in billion.
11. Are there any specific market keywords associated with the report?
Yes, the market keyword associated with the report is "Turbine Monitoring and Controls Industry," which aids in identifying and referencing the specific market segment covered.
12. How do I determine which pricing option suits my needs best?
The pricing options vary based on user requirements and access needs. Individual users may opt for single-user licenses, while businesses requiring broader access may choose multi-user or enterprise licenses for cost-effective access to the report.
13. Are there any additional resources or data provided in the Turbine Monitoring and Controls Industry report?
While the report offers comprehensive insights, it's advisable to review the specific contents or supplementary materials provided to ascertain if additional resources or data are available.
14. How can I stay updated on further developments or reports in the Turbine Monitoring and Controls Industry?
To stay informed about further developments, trends, and reports in the Turbine Monitoring and Controls Industry, consider subscribing to industry newsletters, following relevant companies and organizations, or regularly checking reputable industry news sources and publications.
Methodology
Step 1 - Identification of Relevant Samples Size from Population Database


Step 2 - Approaches for Defining Global Market Size (Value, Volume* & Price*)

Note*: In applicable scenarios
Step 3 - Data Sources
Primary Research
- Web Analytics
- Survey Reports
- Research Institute
- Latest Research Reports
- Opinion Leaders
Secondary Research
- Annual Reports
- White Paper
- Latest Press Release
- Industry Association
- Paid Database
- Investor Presentations

Step 4 - Data Triangulation
Involves using different sources of information in order to increase the validity of a study
These sources are likely to be stakeholders in a program - participants, other researchers, program staff, other community members, and so on.
Then we put all data in single framework & apply various statistical tools to find out the dynamic on the market.
During the analysis stage, feedback from the stakeholder groups would be compared to determine areas of agreement as well as areas of divergence