

Key Insights
The US engineering industry is poised for substantial growth, with an estimated market size of 388.56 billion and a projected Compound Annual Growth Rate (CAGR) of 4.5% from 2025 to 2033. This expansion is driven by significant investments in national infrastructure, particularly in transportation and utilities, coupled with the accelerating demand for renewable energy solutions. Technological advancements, including BIM and advanced analytics, are enhancing operational efficiency. Key engineering disciplines such as civil and environmental engineering are experiencing heightened demand, reflecting the critical need for infrastructure development and sustainability initiatives. Major end-user sectors include construction, oil & gas, and manufacturing, with notable growth observed in transportation and utilities.
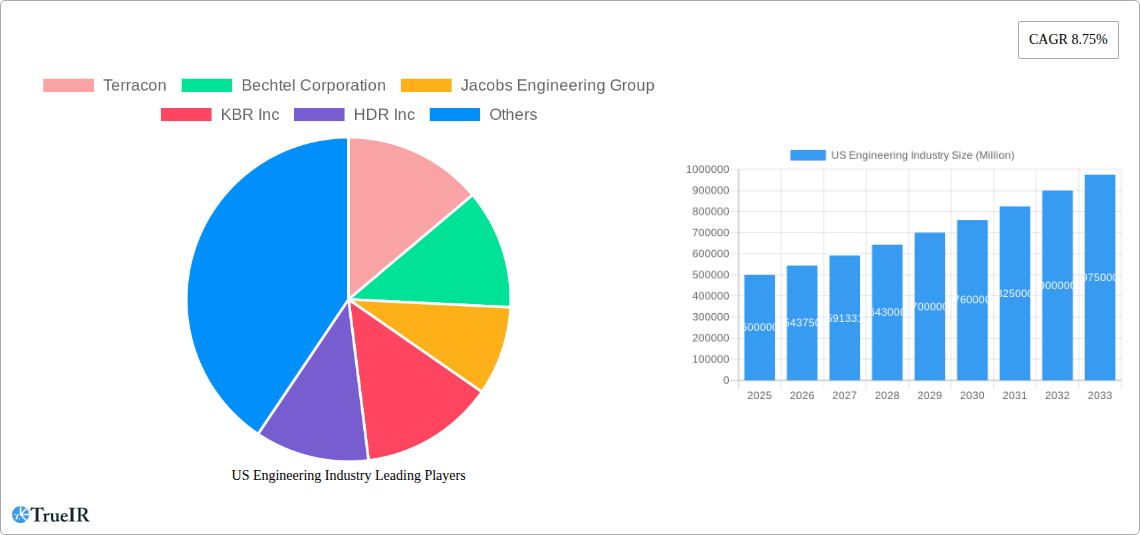
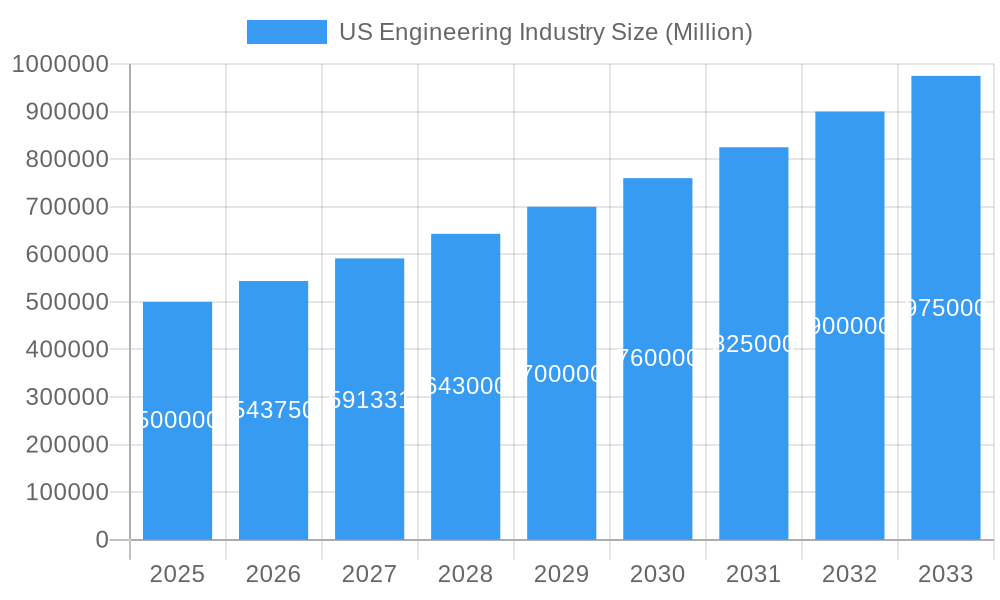
US Engineering Industry Market Size (In Billion)
Regional growth patterns indicate potential acceleration in the West and Northeast due to technological hubs and infrastructure projects, while other regions anticipate steady expansion. Despite challenges like rising material costs and skilled labor scarcity, the US engineering sector's future remains optimistic, fueled by persistent demand and continuous innovation. Segmentation analysis highlights opportunities across specialized engineering services and end-user markets. Civil, mechanical, and environmental engineering firms are expected to lead growth, aligning with infrastructure needs, sustainable energy development, and environmental stewardship. The construction and manufacturing sectors will continue to be primary demand generators. Addressing workforce challenges, adopting cutting-edge technologies, and managing cost fluctuations are crucial for sustained profitability. Adapting to regulatory changes and integrating sustainable practices will also be paramount for the ongoing success of US engineering companies. Strategic market penetration benefits from understanding regional growth dynamics.
US Engineering Industry Company Market Share
US Engineering Industry Market Report: 2019-2033
This comprehensive report provides a detailed analysis of the US Engineering industry, offering invaluable insights for businesses, investors, and stakeholders. Covering the period from 2019 to 2033, with a focus on 2025, this report leverages extensive data analysis and expert insights to forecast future market trends and opportunities. The study period (2019-2024) historical period, base year (2025) and estimated year (2025), and forecast period (2025-2033) ensures a comprehensive understanding of the industry’s evolution and potential. The report analyzes key players such as Terracon, Bechtel Corporation, Jacobs Engineering Group, KBR Inc, HDR Inc, Fluor Corporation, Jensen Hughes, AECOM, Black & Veatch Holding Company, and ECS Group of Companies, across various segments.
US Engineering Industry Market Structure & Competitive Landscape
The US engineering industry exhibits a moderately concentrated market structure, with a few large multinational corporations holding significant market share. The Herfindahl-Hirschman Index (HHI) for 2024 is estimated at xx, indicating a moderately consolidated market. However, the presence of numerous smaller specialized firms fosters competition and innovation. The industry is characterized by significant M&A activity, with xx Million in deals recorded in 2024. This is driven by a desire to expand geographical reach, gain access to new technologies, and enhance service offerings.
- Market Concentration: Moderately concentrated, with HHI estimated at xx in 2024.
- Innovation Drivers: Government funding for R&D, increasing demand for sustainable solutions, and technological advancements in areas such as Building Information Modeling (BIM) and Artificial Intelligence (AI).
- Regulatory Impacts: Stringent environmental regulations and building codes influence design and construction practices.
- Product Substitutes: Limited direct substitutes, however, alternative construction materials and methods can impact demand for specific engineering services.
- End-User Segmentation: Dominated by Construction, Oil & Gas, and Utilities, with growing demand from Transportation and Manufacturing.
- M&A Trends: Significant M&A activity observed, with an estimated xx Million in deal value in 2024, primarily driven by expansion and technological acquisition.
US Engineering Industry Market Trends & Opportunities
The US engineering industry is poised for robust growth, driven by a combination of factors. The market size is projected to reach xx Million by 2033, exhibiting a Compound Annual Growth Rate (CAGR) of xx% during the forecast period (2025-2033). This growth is fueled by increasing infrastructure investment, particularly in renewable energy and transportation, coupled with technological advancements leading to higher efficiency and productivity. The adoption of BIM and digital twins is transforming design and construction processes, while increasing awareness of sustainability is driving demand for green engineering solutions. Competitive dynamics are characterized by intense rivalry among large players and niche specialization among smaller firms. Market penetration rates for advanced technologies are expected to increase significantly, reaching xx% by 2033.
Dominant Markets & Segments in US Engineering Industry
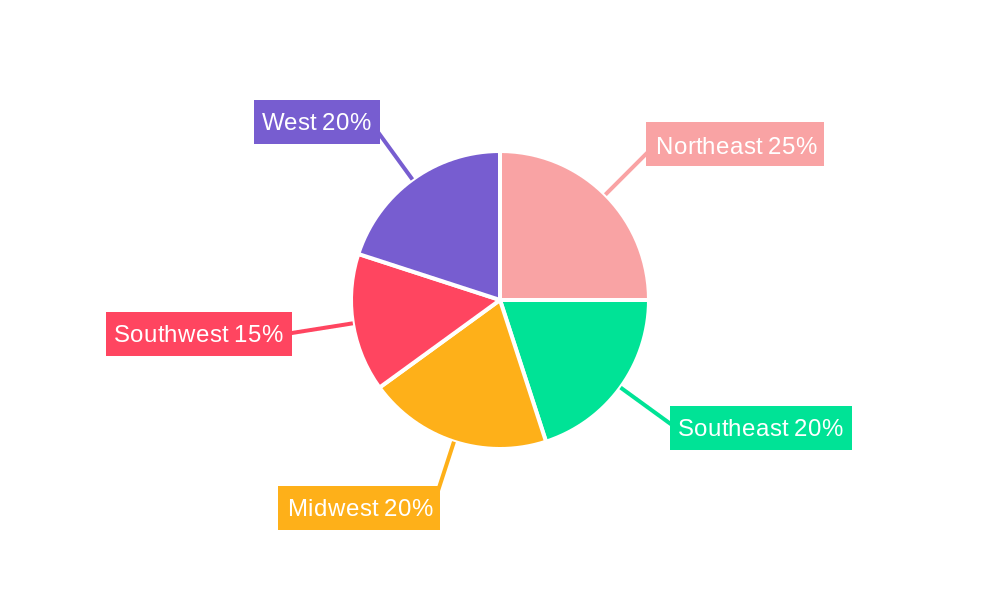
The US engineering market displays regional variations in growth, with the West region projected as the dominant market, reaching xx Million by 2033. This is largely due to significant investments in infrastructure projects, particularly in California and other western states. Within engineering disciplines, Civil engineering remains the largest segment, driven by substantial infrastructure development and demand for sustainable solutions.
Leading Region: West
Key Growth Drivers (West Region): Significant infrastructure spending, including transportation and renewable energy projects; technological hubs fostering innovation.
Leading Engineering Discipline: Civil Engineering
Key Growth Drivers (Civil Engineering): Infrastructure development, including roads, bridges, and renewable energy projects; government initiatives supporting sustainable infrastructure.
Leading End-User Industry: Construction
Key Growth Drivers (Construction): Government investment in infrastructure, increasing demand for residential and commercial construction, and growing adoption of sustainable building practices.
Midwest: Strong growth in industrial and agricultural sectors.
Northeast: High demand for infrastructure upgrades and renovations.
South: Expansion driven by population growth and commercial development.
Other Engineering Disciplines: Mechanical, Electrical, and Environmental engineering witness steady growth driven by increasing automation, energy efficiency demands, and environmental regulations.
Other End-user Industries: Manufacturing and Transportation show significant potential for growth.
US Engineering Industry Product Analysis
Technological advancements, such as BIM and AI, are revolutionizing the engineering design process, enhancing efficiency, collaboration, and accuracy. The integration of these technologies provides competitive advantages by optimizing project timelines, reducing costs, and improving the quality of deliverables. The market fit for these advanced technologies is strong, driven by increasing client demand for efficient and sustainable solutions.
Key Drivers, Barriers & Challenges in US Engineering Industry
Key Drivers: Increased government spending on infrastructure projects, rising demand for renewable energy infrastructure, technological advancements, and a growing emphasis on sustainable practices are propelling market growth.
Key Challenges: Supply chain disruptions have impacted project timelines and costs, while skilled labor shortages and stringent regulatory compliance requirements present significant hurdles. Increased competition and price pressures further add to the challenges faced by engineering firms. These challenges contribute to an estimated xx% decrease in project completion rates in 2024.
Growth Drivers in the US Engineering Industry Market
Government investments in infrastructure modernization, particularly in transportation and renewable energy, significantly fuel the market's growth. The increasing adoption of sustainable and environmentally friendly engineering solutions, driven by evolving environmental regulations, also contributes to market expansion. Technological advancements, such as BIM and AI, continue to enhance efficiency and improve project outcomes, further boosting market expansion.
Challenges Impacting US Engineering Industry Growth
The industry faces numerous challenges, including a shortage of skilled labor, leading to increased project costs and delays. Supply chain disruptions and increasing material costs are significant concerns, along with the stringent regulatory landscape and intense competition among established firms and new entrants. These factors collectively hinder industry growth and profitability.
Key Players Shaping the US Engineering Industry Market
Significant US Engineering Industry Industry Milestones
- November 2021: The US Navy selected Bechtel for a multi-year initiative to build new dry docks and shipyard infrastructure, signifying a substantial investment in naval infrastructure and bolstering the engineering market.
- May 2022: AECOM's joint venture secured a USD 400 Million contract for environmental services from NAVFAC Atlantic, highlighting growth in the environmental engineering sector and increased government spending on environmental remediation.
Future Outlook for US Engineering Industry Market
The US engineering industry is projected to experience sustained growth, driven by ongoing infrastructure investments, technological advancements, and the increasing focus on sustainability. Strategic opportunities exist for firms that embrace innovation, adapt to evolving technological landscapes, and focus on delivering efficient and sustainable solutions. The market's potential for growth remains substantial, with continued expansion anticipated across various segments and regions.
US Engineering Industry Segmentation
-
1. Engineering Disciplines
- 1.1. Civil
- 1.2. Mechanical
- 1.3. Electrical
- 1.4. Environmental
-
2. End-user Industry
- 2.1. Construction
- 2.2. Oil & Gas
- 2.3. Manufacturing
- 2.4. Utilities
- 2.5. Transportation
- 2.6. Other End-user Industries
US Engineering Industry Segmentation By Geography
-
1. North America
- 1.1. United States
- 1.2. Canada
- 1.3. Mexico
-
2. South America
- 2.1. Brazil
- 2.2. Argentina
- 2.3. Rest of South America
-
3. Europe
- 3.1. United Kingdom
- 3.2. Germany
- 3.3. France
- 3.4. Italy
- 3.5. Spain
- 3.6. Russia
- 3.7. Benelux
- 3.8. Nordics
- 3.9. Rest of Europe
-
4. Middle East & Africa
- 4.1. Turkey
- 4.2. Israel
- 4.3. GCC
- 4.4. North Africa
- 4.5. South Africa
- 4.6. Rest of Middle East & Africa
-
5. Asia Pacific
- 5.1. China
- 5.2. India
- 5.3. Japan
- 5.4. South Korea
- 5.5. ASEAN
- 5.6. Oceania
- 5.7. Rest of Asia Pacific
US Engineering Industry Regional Market Share
Geographic Coverage of US Engineering Industry
US Engineering Industry REPORT HIGHLIGHTS
| Aspects | Details |
|---|---|
| Study Period | 2020-2034 |
| Base Year | 2025 |
| Estimated Year | 2026 |
| Forecast Period | 2026-2034 |
| Historical Period | 2020-2025 |
| Growth Rate | CAGR of 4.5% from 2020-2034 |
| Segmentation |
|
Table of Contents
- 1. Introduction
- 1.1. Research Scope
- 1.2. Market Segmentation
- 1.3. Research Objective
- 1.4. Definitions and Assumptions
- 2. Executive Summary
- 2.1. Market Snapshot
- 3. Market Dynamics
- 3.1. Market Drivers
- 3.2. Market Restrains
- 3.3. Market Trends
- 3.4. Market Opportunities
- 4. Market Factor Analysis
- 4.1. Porters Five Forces
- 4.1.1. Bargaining Power of Suppliers
- 4.1.2. Bargaining Power of Buyers
- 4.1.3. Threat of New Entrants
- 4.1.4. Threat of Substitutes
- 4.1.5. Competitive Rivalry
- 4.2. PESTEL analysis
- 4.3. BCG Analysis
- 4.3.1. Stars (High Growth, High Market Share)
- 4.3.2. Cash Cows (Low Growth, High Market Share)
- 4.3.3. Question Mark (High Growth, Low Market Share)
- 4.3.4. Dogs (Low Growth, Low Market Share)
- 4.4. Ansoff Matrix Analysis
- 4.5. Supply Chain Analysis
- 4.6. Regulatory Landscape
- 4.7. Current Market Potential and Opportunity Assessment (TAM–SAM–SOM Framework)
- 4.8. TIR Analyst Note
- 4.1. Porters Five Forces
- 5. Market Analysis, Insights and Forecast 2021-2033
- 5.1. Market Analysis, Insights and Forecast - by Engineering Disciplines
- 5.1.1. Civil
- 5.1.2. Mechanical
- 5.1.3. Electrical
- 5.1.4. Environmental
- 5.2. Market Analysis, Insights and Forecast - by End-user Industry
- 5.2.1. Construction
- 5.2.2. Oil & Gas
- 5.2.3. Manufacturing
- 5.2.4. Utilities
- 5.2.5. Transportation
- 5.2.6. Other End-user Industries
- 5.3. Market Analysis, Insights and Forecast - by Region
- 5.3.1. North America
- 5.3.2. South America
- 5.3.3. Europe
- 5.3.4. Middle East & Africa
- 5.3.5. Asia Pacific
- 5.1. Market Analysis, Insights and Forecast - by Engineering Disciplines
- 6. Global US Engineering Industry Analysis, Insights and Forecast, 2021-2033
- 6.1. Market Analysis, Insights and Forecast - by Engineering Disciplines
- 6.1.1. Civil
- 6.1.2. Mechanical
- 6.1.3. Electrical
- 6.1.4. Environmental
- 6.2. Market Analysis, Insights and Forecast - by End-user Industry
- 6.2.1. Construction
- 6.2.2. Oil & Gas
- 6.2.3. Manufacturing
- 6.2.4. Utilities
- 6.2.5. Transportation
- 6.2.6. Other End-user Industries
- 6.1. Market Analysis, Insights and Forecast - by Engineering Disciplines
- 7. North America US Engineering Industry Analysis, Insights and Forecast, 2020-2032
- 7.1. Market Analysis, Insights and Forecast - by Engineering Disciplines
- 7.1.1. Civil
- 7.1.2. Mechanical
- 7.1.3. Electrical
- 7.1.4. Environmental
- 7.2. Market Analysis, Insights and Forecast - by End-user Industry
- 7.2.1. Construction
- 7.2.2. Oil & Gas
- 7.2.3. Manufacturing
- 7.2.4. Utilities
- 7.2.5. Transportation
- 7.2.6. Other End-user Industries
- 7.1. Market Analysis, Insights and Forecast - by Engineering Disciplines
- 8. South America US Engineering Industry Analysis, Insights and Forecast, 2020-2032
- 8.1. Market Analysis, Insights and Forecast - by Engineering Disciplines
- 8.1.1. Civil
- 8.1.2. Mechanical
- 8.1.3. Electrical
- 8.1.4. Environmental
- 8.2. Market Analysis, Insights and Forecast - by End-user Industry
- 8.2.1. Construction
- 8.2.2. Oil & Gas
- 8.2.3. Manufacturing
- 8.2.4. Utilities
- 8.2.5. Transportation
- 8.2.6. Other End-user Industries
- 8.1. Market Analysis, Insights and Forecast - by Engineering Disciplines
- 9. Europe US Engineering Industry Analysis, Insights and Forecast, 2020-2032
- 9.1. Market Analysis, Insights and Forecast - by Engineering Disciplines
- 9.1.1. Civil
- 9.1.2. Mechanical
- 9.1.3. Electrical
- 9.1.4. Environmental
- 9.2. Market Analysis, Insights and Forecast - by End-user Industry
- 9.2.1. Construction
- 9.2.2. Oil & Gas
- 9.2.3. Manufacturing
- 9.2.4. Utilities
- 9.2.5. Transportation
- 9.2.6. Other End-user Industries
- 9.1. Market Analysis, Insights and Forecast - by Engineering Disciplines
- 10. Middle East & Africa US Engineering Industry Analysis, Insights and Forecast, 2020-2032
- 10.1. Market Analysis, Insights and Forecast - by Engineering Disciplines
- 10.1.1. Civil
- 10.1.2. Mechanical
- 10.1.3. Electrical
- 10.1.4. Environmental
- 10.2. Market Analysis, Insights and Forecast - by End-user Industry
- 10.2.1. Construction
- 10.2.2. Oil & Gas
- 10.2.3. Manufacturing
- 10.2.4. Utilities
- 10.2.5. Transportation
- 10.2.6. Other End-user Industries
- 10.1. Market Analysis, Insights and Forecast - by Engineering Disciplines
- 11. Asia Pacific US Engineering Industry Analysis, Insights and Forecast, 2020-2032
- 11.1. Market Analysis, Insights and Forecast - by Engineering Disciplines
- 11.1.1. Civil
- 11.1.2. Mechanical
- 11.1.3. Electrical
- 11.1.4. Environmental
- 11.2. Market Analysis, Insights and Forecast - by End-user Industry
- 11.2.1. Construction
- 11.2.2. Oil & Gas
- 11.2.3. Manufacturing
- 11.2.4. Utilities
- 11.2.5. Transportation
- 11.2.6. Other End-user Industries
- 11.1. Market Analysis, Insights and Forecast - by Engineering Disciplines
- 12. Competitive Analysis
- 12.1. Company Profiles
- 12.1.1 Terracon
- 12.1.1.1. Company Overview
- 12.1.1.2. Products
- 12.1.1.3. Company Financials
- 12.1.1.4. SWOT Analysis
- 12.1.2 Bechtel Corporation
- 12.1.2.1. Company Overview
- 12.1.2.2. Products
- 12.1.2.3. Company Financials
- 12.1.2.4. SWOT Analysis
- 12.1.3 Jacobs Engineering Group
- 12.1.3.1. Company Overview
- 12.1.3.2. Products
- 12.1.3.3. Company Financials
- 12.1.3.4. SWOT Analysis
- 12.1.4 KBR Inc
- 12.1.4.1. Company Overview
- 12.1.4.2. Products
- 12.1.4.3. Company Financials
- 12.1.4.4. SWOT Analysis
- 12.1.5 HDR Inc
- 12.1.5.1. Company Overview
- 12.1.5.2. Products
- 12.1.5.3. Company Financials
- 12.1.5.4. SWOT Analysis
- 12.1.6 Fluor Corporation
- 12.1.6.1. Company Overview
- 12.1.6.2. Products
- 12.1.6.3. Company Financials
- 12.1.6.4. SWOT Analysis
- 12.1.7 Jensen Hughes
- 12.1.7.1. Company Overview
- 12.1.7.2. Products
- 12.1.7.3. Company Financials
- 12.1.7.4. SWOT Analysis
- 12.1.8 AECOM
- 12.1.8.1. Company Overview
- 12.1.8.2. Products
- 12.1.8.3. Company Financials
- 12.1.8.4. SWOT Analysis
- 12.1.9 Black & Veatch Holding Company
- 12.1.9.1. Company Overview
- 12.1.9.2. Products
- 12.1.9.3. Company Financials
- 12.1.9.4. SWOT Analysis
- 12.1.10 ECS Group of Companies
- 12.1.10.1. Company Overview
- 12.1.10.2. Products
- 12.1.10.3. Company Financials
- 12.1.10.4. SWOT Analysis
- 12.1.1 Terracon
- 12.2. Market Entropy
- 12.2.1 Company's Key Areas Served
- 12.2.2 Recent Developments
- 12.3. Company Market Share Analysis 2025
- 12.3.1 Top 5 Companies Market Share Analysis
- 12.3.2 Top 3 Companies Market Share Analysis
- 12.4. List of Potential Customers
- 13. Research Methodology
List of Figures
- Figure 1: Global US Engineering Industry Revenue Breakdown (billion, %) by Region 2025 & 2033
- Figure 2: Global US Engineering Industry Volume Breakdown (K Unit, %) by Region 2025 & 2033
- Figure 3: North America US Engineering Industry Revenue (billion), by Engineering Disciplines 2025 & 2033
- Figure 4: North America US Engineering Industry Volume (K Unit), by Engineering Disciplines 2025 & 2033
- Figure 5: North America US Engineering Industry Revenue Share (%), by Engineering Disciplines 2025 & 2033
- Figure 6: North America US Engineering Industry Volume Share (%), by Engineering Disciplines 2025 & 2033
- Figure 7: North America US Engineering Industry Revenue (billion), by End-user Industry 2025 & 2033
- Figure 8: North America US Engineering Industry Volume (K Unit), by End-user Industry 2025 & 2033
- Figure 9: North America US Engineering Industry Revenue Share (%), by End-user Industry 2025 & 2033
- Figure 10: North America US Engineering Industry Volume Share (%), by End-user Industry 2025 & 2033
- Figure 11: North America US Engineering Industry Revenue (billion), by Country 2025 & 2033
- Figure 12: North America US Engineering Industry Volume (K Unit), by Country 2025 & 2033
- Figure 13: North America US Engineering Industry Revenue Share (%), by Country 2025 & 2033
- Figure 14: North America US Engineering Industry Volume Share (%), by Country 2025 & 2033
- Figure 15: South America US Engineering Industry Revenue (billion), by Engineering Disciplines 2025 & 2033
- Figure 16: South America US Engineering Industry Volume (K Unit), by Engineering Disciplines 2025 & 2033
- Figure 17: South America US Engineering Industry Revenue Share (%), by Engineering Disciplines 2025 & 2033
- Figure 18: South America US Engineering Industry Volume Share (%), by Engineering Disciplines 2025 & 2033
- Figure 19: South America US Engineering Industry Revenue (billion), by End-user Industry 2025 & 2033
- Figure 20: South America US Engineering Industry Volume (K Unit), by End-user Industry 2025 & 2033
- Figure 21: South America US Engineering Industry Revenue Share (%), by End-user Industry 2025 & 2033
- Figure 22: South America US Engineering Industry Volume Share (%), by End-user Industry 2025 & 2033
- Figure 23: South America US Engineering Industry Revenue (billion), by Country 2025 & 2033
- Figure 24: South America US Engineering Industry Volume (K Unit), by Country 2025 & 2033
- Figure 25: South America US Engineering Industry Revenue Share (%), by Country 2025 & 2033
- Figure 26: South America US Engineering Industry Volume Share (%), by Country 2025 & 2033
- Figure 27: Europe US Engineering Industry Revenue (billion), by Engineering Disciplines 2025 & 2033
- Figure 28: Europe US Engineering Industry Volume (K Unit), by Engineering Disciplines 2025 & 2033
- Figure 29: Europe US Engineering Industry Revenue Share (%), by Engineering Disciplines 2025 & 2033
- Figure 30: Europe US Engineering Industry Volume Share (%), by Engineering Disciplines 2025 & 2033
- Figure 31: Europe US Engineering Industry Revenue (billion), by End-user Industry 2025 & 2033
- Figure 32: Europe US Engineering Industry Volume (K Unit), by End-user Industry 2025 & 2033
- Figure 33: Europe US Engineering Industry Revenue Share (%), by End-user Industry 2025 & 2033
- Figure 34: Europe US Engineering Industry Volume Share (%), by End-user Industry 2025 & 2033
- Figure 35: Europe US Engineering Industry Revenue (billion), by Country 2025 & 2033
- Figure 36: Europe US Engineering Industry Volume (K Unit), by Country 2025 & 2033
- Figure 37: Europe US Engineering Industry Revenue Share (%), by Country 2025 & 2033
- Figure 38: Europe US Engineering Industry Volume Share (%), by Country 2025 & 2033
- Figure 39: Middle East & Africa US Engineering Industry Revenue (billion), by Engineering Disciplines 2025 & 2033
- Figure 40: Middle East & Africa US Engineering Industry Volume (K Unit), by Engineering Disciplines 2025 & 2033
- Figure 41: Middle East & Africa US Engineering Industry Revenue Share (%), by Engineering Disciplines 2025 & 2033
- Figure 42: Middle East & Africa US Engineering Industry Volume Share (%), by Engineering Disciplines 2025 & 2033
- Figure 43: Middle East & Africa US Engineering Industry Revenue (billion), by End-user Industry 2025 & 2033
- Figure 44: Middle East & Africa US Engineering Industry Volume (K Unit), by End-user Industry 2025 & 2033
- Figure 45: Middle East & Africa US Engineering Industry Revenue Share (%), by End-user Industry 2025 & 2033
- Figure 46: Middle East & Africa US Engineering Industry Volume Share (%), by End-user Industry 2025 & 2033
- Figure 47: Middle East & Africa US Engineering Industry Revenue (billion), by Country 2025 & 2033
- Figure 48: Middle East & Africa US Engineering Industry Volume (K Unit), by Country 2025 & 2033
- Figure 49: Middle East & Africa US Engineering Industry Revenue Share (%), by Country 2025 & 2033
- Figure 50: Middle East & Africa US Engineering Industry Volume Share (%), by Country 2025 & 2033
- Figure 51: Asia Pacific US Engineering Industry Revenue (billion), by Engineering Disciplines 2025 & 2033
- Figure 52: Asia Pacific US Engineering Industry Volume (K Unit), by Engineering Disciplines 2025 & 2033
- Figure 53: Asia Pacific US Engineering Industry Revenue Share (%), by Engineering Disciplines 2025 & 2033
- Figure 54: Asia Pacific US Engineering Industry Volume Share (%), by Engineering Disciplines 2025 & 2033
- Figure 55: Asia Pacific US Engineering Industry Revenue (billion), by End-user Industry 2025 & 2033
- Figure 56: Asia Pacific US Engineering Industry Volume (K Unit), by End-user Industry 2025 & 2033
- Figure 57: Asia Pacific US Engineering Industry Revenue Share (%), by End-user Industry 2025 & 2033
- Figure 58: Asia Pacific US Engineering Industry Volume Share (%), by End-user Industry 2025 & 2033
- Figure 59: Asia Pacific US Engineering Industry Revenue (billion), by Country 2025 & 2033
- Figure 60: Asia Pacific US Engineering Industry Volume (K Unit), by Country 2025 & 2033
- Figure 61: Asia Pacific US Engineering Industry Revenue Share (%), by Country 2025 & 2033
- Figure 62: Asia Pacific US Engineering Industry Volume Share (%), by Country 2025 & 2033
List of Tables
- Table 1: Global US Engineering Industry Revenue billion Forecast, by Engineering Disciplines 2020 & 2033
- Table 2: Global US Engineering Industry Volume K Unit Forecast, by Engineering Disciplines 2020 & 2033
- Table 3: Global US Engineering Industry Revenue billion Forecast, by End-user Industry 2020 & 2033
- Table 4: Global US Engineering Industry Volume K Unit Forecast, by End-user Industry 2020 & 2033
- Table 5: Global US Engineering Industry Revenue billion Forecast, by Region 2020 & 2033
- Table 6: Global US Engineering Industry Volume K Unit Forecast, by Region 2020 & 2033
- Table 7: Global US Engineering Industry Revenue billion Forecast, by Engineering Disciplines 2020 & 2033
- Table 8: Global US Engineering Industry Volume K Unit Forecast, by Engineering Disciplines 2020 & 2033
- Table 9: Global US Engineering Industry Revenue billion Forecast, by End-user Industry 2020 & 2033
- Table 10: Global US Engineering Industry Volume K Unit Forecast, by End-user Industry 2020 & 2033
- Table 11: Global US Engineering Industry Revenue billion Forecast, by Country 2020 & 2033
- Table 12: Global US Engineering Industry Volume K Unit Forecast, by Country 2020 & 2033
- Table 13: United States US Engineering Industry Revenue (billion) Forecast, by Application 2020 & 2033
- Table 14: United States US Engineering Industry Volume (K Unit) Forecast, by Application 2020 & 2033
- Table 15: Canada US Engineering Industry Revenue (billion) Forecast, by Application 2020 & 2033
- Table 16: Canada US Engineering Industry Volume (K Unit) Forecast, by Application 2020 & 2033
- Table 17: Mexico US Engineering Industry Revenue (billion) Forecast, by Application 2020 & 2033
- Table 18: Mexico US Engineering Industry Volume (K Unit) Forecast, by Application 2020 & 2033
- Table 19: Global US Engineering Industry Revenue billion Forecast, by Engineering Disciplines 2020 & 2033
- Table 20: Global US Engineering Industry Volume K Unit Forecast, by Engineering Disciplines 2020 & 2033
- Table 21: Global US Engineering Industry Revenue billion Forecast, by End-user Industry 2020 & 2033
- Table 22: Global US Engineering Industry Volume K Unit Forecast, by End-user Industry 2020 & 2033
- Table 23: Global US Engineering Industry Revenue billion Forecast, by Country 2020 & 2033
- Table 24: Global US Engineering Industry Volume K Unit Forecast, by Country 2020 & 2033
- Table 25: Brazil US Engineering Industry Revenue (billion) Forecast, by Application 2020 & 2033
- Table 26: Brazil US Engineering Industry Volume (K Unit) Forecast, by Application 2020 & 2033
- Table 27: Argentina US Engineering Industry Revenue (billion) Forecast, by Application 2020 & 2033
- Table 28: Argentina US Engineering Industry Volume (K Unit) Forecast, by Application 2020 & 2033
- Table 29: Rest of South America US Engineering Industry Revenue (billion) Forecast, by Application 2020 & 2033
- Table 30: Rest of South America US Engineering Industry Volume (K Unit) Forecast, by Application 2020 & 2033
- Table 31: Global US Engineering Industry Revenue billion Forecast, by Engineering Disciplines 2020 & 2033
- Table 32: Global US Engineering Industry Volume K Unit Forecast, by Engineering Disciplines 2020 & 2033
- Table 33: Global US Engineering Industry Revenue billion Forecast, by End-user Industry 2020 & 2033
- Table 34: Global US Engineering Industry Volume K Unit Forecast, by End-user Industry 2020 & 2033
- Table 35: Global US Engineering Industry Revenue billion Forecast, by Country 2020 & 2033
- Table 36: Global US Engineering Industry Volume K Unit Forecast, by Country 2020 & 2033
- Table 37: United Kingdom US Engineering Industry Revenue (billion) Forecast, by Application 2020 & 2033
- Table 38: United Kingdom US Engineering Industry Volume (K Unit) Forecast, by Application 2020 & 2033
- Table 39: Germany US Engineering Industry Revenue (billion) Forecast, by Application 2020 & 2033
- Table 40: Germany US Engineering Industry Volume (K Unit) Forecast, by Application 2020 & 2033
- Table 41: France US Engineering Industry Revenue (billion) Forecast, by Application 2020 & 2033
- Table 42: France US Engineering Industry Volume (K Unit) Forecast, by Application 2020 & 2033
- Table 43: Italy US Engineering Industry Revenue (billion) Forecast, by Application 2020 & 2033
- Table 44: Italy US Engineering Industry Volume (K Unit) Forecast, by Application 2020 & 2033
- Table 45: Spain US Engineering Industry Revenue (billion) Forecast, by Application 2020 & 2033
- Table 46: Spain US Engineering Industry Volume (K Unit) Forecast, by Application 2020 & 2033
- Table 47: Russia US Engineering Industry Revenue (billion) Forecast, by Application 2020 & 2033
- Table 48: Russia US Engineering Industry Volume (K Unit) Forecast, by Application 2020 & 2033
- Table 49: Benelux US Engineering Industry Revenue (billion) Forecast, by Application 2020 & 2033
- Table 50: Benelux US Engineering Industry Volume (K Unit) Forecast, by Application 2020 & 2033
- Table 51: Nordics US Engineering Industry Revenue (billion) Forecast, by Application 2020 & 2033
- Table 52: Nordics US Engineering Industry Volume (K Unit) Forecast, by Application 2020 & 2033
- Table 53: Rest of Europe US Engineering Industry Revenue (billion) Forecast, by Application 2020 & 2033
- Table 54: Rest of Europe US Engineering Industry Volume (K Unit) Forecast, by Application 2020 & 2033
- Table 55: Global US Engineering Industry Revenue billion Forecast, by Engineering Disciplines 2020 & 2033
- Table 56: Global US Engineering Industry Volume K Unit Forecast, by Engineering Disciplines 2020 & 2033
- Table 57: Global US Engineering Industry Revenue billion Forecast, by End-user Industry 2020 & 2033
- Table 58: Global US Engineering Industry Volume K Unit Forecast, by End-user Industry 2020 & 2033
- Table 59: Global US Engineering Industry Revenue billion Forecast, by Country 2020 & 2033
- Table 60: Global US Engineering Industry Volume K Unit Forecast, by Country 2020 & 2033
- Table 61: Turkey US Engineering Industry Revenue (billion) Forecast, by Application 2020 & 2033
- Table 62: Turkey US Engineering Industry Volume (K Unit) Forecast, by Application 2020 & 2033
- Table 63: Israel US Engineering Industry Revenue (billion) Forecast, by Application 2020 & 2033
- Table 64: Israel US Engineering Industry Volume (K Unit) Forecast, by Application 2020 & 2033
- Table 65: GCC US Engineering Industry Revenue (billion) Forecast, by Application 2020 & 2033
- Table 66: GCC US Engineering Industry Volume (K Unit) Forecast, by Application 2020 & 2033
- Table 67: North Africa US Engineering Industry Revenue (billion) Forecast, by Application 2020 & 2033
- Table 68: North Africa US Engineering Industry Volume (K Unit) Forecast, by Application 2020 & 2033
- Table 69: South Africa US Engineering Industry Revenue (billion) Forecast, by Application 2020 & 2033
- Table 70: South Africa US Engineering Industry Volume (K Unit) Forecast, by Application 2020 & 2033
- Table 71: Rest of Middle East & Africa US Engineering Industry Revenue (billion) Forecast, by Application 2020 & 2033
- Table 72: Rest of Middle East & Africa US Engineering Industry Volume (K Unit) Forecast, by Application 2020 & 2033
- Table 73: Global US Engineering Industry Revenue billion Forecast, by Engineering Disciplines 2020 & 2033
- Table 74: Global US Engineering Industry Volume K Unit Forecast, by Engineering Disciplines 2020 & 2033
- Table 75: Global US Engineering Industry Revenue billion Forecast, by End-user Industry 2020 & 2033
- Table 76: Global US Engineering Industry Volume K Unit Forecast, by End-user Industry 2020 & 2033
- Table 77: Global US Engineering Industry Revenue billion Forecast, by Country 2020 & 2033
- Table 78: Global US Engineering Industry Volume K Unit Forecast, by Country 2020 & 2033
- Table 79: China US Engineering Industry Revenue (billion) Forecast, by Application 2020 & 2033
- Table 80: China US Engineering Industry Volume (K Unit) Forecast, by Application 2020 & 2033
- Table 81: India US Engineering Industry Revenue (billion) Forecast, by Application 2020 & 2033
- Table 82: India US Engineering Industry Volume (K Unit) Forecast, by Application 2020 & 2033
- Table 83: Japan US Engineering Industry Revenue (billion) Forecast, by Application 2020 & 2033
- Table 84: Japan US Engineering Industry Volume (K Unit) Forecast, by Application 2020 & 2033
- Table 85: South Korea US Engineering Industry Revenue (billion) Forecast, by Application 2020 & 2033
- Table 86: South Korea US Engineering Industry Volume (K Unit) Forecast, by Application 2020 & 2033
- Table 87: ASEAN US Engineering Industry Revenue (billion) Forecast, by Application 2020 & 2033
- Table 88: ASEAN US Engineering Industry Volume (K Unit) Forecast, by Application 2020 & 2033
- Table 89: Oceania US Engineering Industry Revenue (billion) Forecast, by Application 2020 & 2033
- Table 90: Oceania US Engineering Industry Volume (K Unit) Forecast, by Application 2020 & 2033
- Table 91: Rest of Asia Pacific US Engineering Industry Revenue (billion) Forecast, by Application 2020 & 2033
- Table 92: Rest of Asia Pacific US Engineering Industry Volume (K Unit) Forecast, by Application 2020 & 2033
Frequently Asked Questions
1. What is the projected Compound Annual Growth Rate (CAGR) of the US Engineering Industry?
The projected CAGR is approximately 4.5%.
2. Which companies are prominent players in the US Engineering Industry?
Key companies in the market include Terracon, Bechtel Corporation, Jacobs Engineering Group, KBR Inc, HDR Inc, Fluor Corporation, Jensen Hughes, AECOM, Black & Veatch Holding Company, ECS Group of Companies.
3. What are the main segments of the US Engineering Industry?
The market segments include Engineering Disciplines, End-user Industry.
4. Can you provide details about the market size?
The market size is estimated to be USD 388.56 billion as of 2022.
5. What are some drivers contributing to market growth?
Increasing demand due to a growing private investment in large-scale projects and recovery in natural gas and oil prices likely to propel demand from industrial customers; Technological advancements have aided in reducing lead time and resource overheads.
6. What are the notable trends driving market growth?
Civil Engineering Services is Expected to Register a Significant Growth.
7. Are there any restraints impacting market growth?
Market susceptibility to changes in macro-environment as well as regulatory landscape.
8. Can you provide examples of recent developments in the market?
May 2022 - The Naval Facilities Engineering Systems Command (NAVFAC) Atlantic has awarded AECOM's Resolution Consultants joint venture with EnSafe a solitary, indefinite-delivery, indefinite-quantity (IDIQ) contract to deliver architecture and engineering services for the Comprehensive Long-Term Environmental Action Navy (CLEAN) program. The joint venture will conduct environmental research, investigations, and designs that solve major environmental concerns under the contract, which has a USD 400 million budget.
9. What pricing options are available for accessing the report?
Pricing options include single-user, multi-user, and enterprise licenses priced at USD 3800, USD 4500, and USD 5800 respectively.
10. Is the market size provided in terms of value or volume?
The market size is provided in terms of value, measured in billion and volume, measured in K Unit.
11. Are there any specific market keywords associated with the report?
Yes, the market keyword associated with the report is "US Engineering Industry," which aids in identifying and referencing the specific market segment covered.
12. How do I determine which pricing option suits my needs best?
The pricing options vary based on user requirements and access needs. Individual users may opt for single-user licenses, while businesses requiring broader access may choose multi-user or enterprise licenses for cost-effective access to the report.
13. Are there any additional resources or data provided in the US Engineering Industry report?
While the report offers comprehensive insights, it's advisable to review the specific contents or supplementary materials provided to ascertain if additional resources or data are available.
14. How can I stay updated on further developments or reports in the US Engineering Industry?
To stay informed about further developments, trends, and reports in the US Engineering Industry, consider subscribing to industry newsletters, following relevant companies and organizations, or regularly checking reputable industry news sources and publications.
Methodology
Step 1 - Identification of Relevant Samples Size from Population Database


Step 2 - Approaches for Defining Global Market Size (Value, Volume* & Price*)

Note*: In applicable scenarios
Step 3 - Data Sources
Primary Research
- Web Analytics
- Survey Reports
- Research Institute
- Latest Research Reports
- Opinion Leaders
Secondary Research
- Annual Reports
- White Paper
- Latest Press Release
- Industry Association
- Paid Database
- Investor Presentations

Step 4 - Data Triangulation
Involves using different sources of information in order to increase the validity of a study
These sources are likely to be stakeholders in a program - participants, other researchers, program staff, other community members, and so on.
Then we put all data in single framework & apply various statistical tools to find out the dynamic on the market.
During the analysis stage, feedback from the stakeholder groups would be compared to determine areas of agreement as well as areas of divergence