

Key Insights
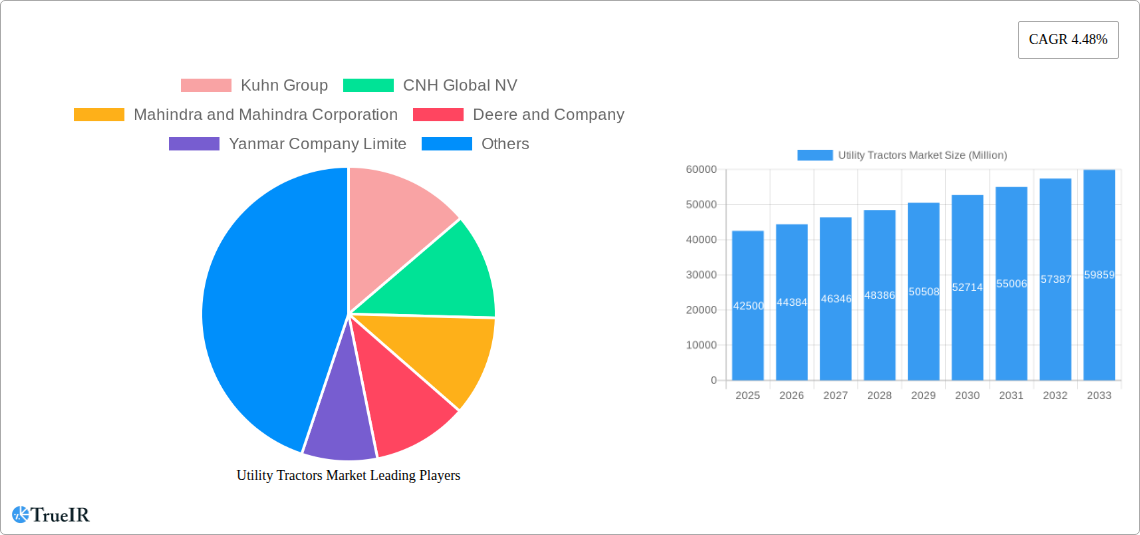
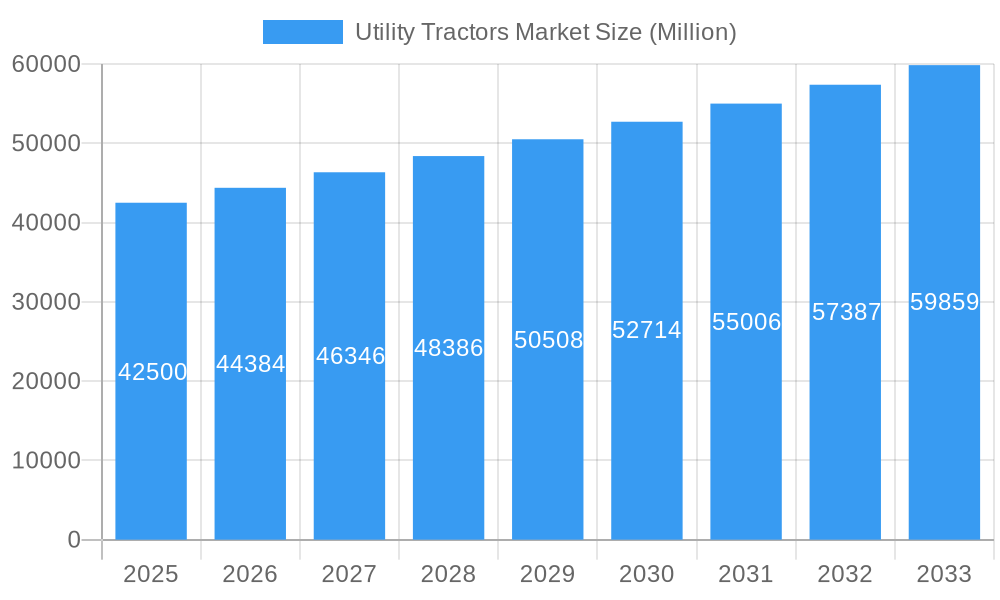
The global utility tractor market, valued at $42.50 billion in 2025, is projected to experience robust growth, driven by a compound annual growth rate (CAGR) of 4.48% from 2025 to 2033. This expansion is fueled by several key factors. Increasing demand for efficient agricultural practices, particularly in developing economies with burgeoning populations, is a significant driver. The rising adoption of precision farming technologies, including GPS-guided systems and automated features, enhances productivity and reduces labor costs, further stimulating market growth. Moreover, the expansion of the construction and landscaping sectors, particularly in urbanizing regions, contributes significantly to the demand for versatile utility tractors. Government initiatives promoting sustainable agriculture and infrastructure development also provide a favorable environment for market expansion. Segmentation analysis reveals that on-highway utility tractors currently hold a larger market share compared to off-highway counterparts, although the latter segment is anticipated to experience faster growth due to its applications in specialized agricultural and construction tasks. Within the horsepower segments, the 51-100 HP range holds a considerable share, reflecting the preference for tractors offering a balance between power and maneuverability. Geographically, North America and Europe are currently major markets, but the Asia-Pacific region, driven by robust agricultural growth and infrastructure development in countries like India and China, is poised for significant expansion in the coming years.
Utility Tractors Market Market Size (In Billion)
The market faces certain restraints, including fluctuations in commodity prices, particularly fuel costs, which can impact the overall affordability and operational expenses of utility tractors. Furthermore, stringent emission regulations in developed markets necessitate investments in cleaner technologies, potentially influencing the cost of production and ultimately the market price. However, advancements in engine technology and the availability of alternative fuels are expected to mitigate these challenges. Competitive landscape analysis indicates that major players, including Kuhn Group, CNH Global NV, Mahindra and Mahindra Corporation, Deere & Company, and Kubota Corporation, are actively engaged in product innovation, strategic partnerships, and geographic expansion to solidify their market positions. The continued development of advanced features, such as improved fuel efficiency, enhanced safety systems, and integrated telematics, will further shape market dynamics and drive future growth in the utility tractor sector.
Utility Tractors Market Company Market Share
This in-depth report provides a comprehensive analysis of the global Utility Tractors Market, offering invaluable insights for stakeholders seeking to navigate this dynamic landscape. From market size and segmentation to competitive dynamics and future outlook, this report delivers a 360-degree view of the industry, covering the period 2019-2033, with 2025 as the base year. The report leverages extensive data analysis and industry expertise to provide actionable intelligence. The market is expected to reach xx Million by 2033, exhibiting a robust CAGR of xx%.
Utility Tractors Market Market Structure & Competitive Landscape
The Utility Tractors Market is characterized by a moderately consolidated structure, with key players such as Deere & Company, Kubota Corporation, and Mahindra & Mahindra holding significant market share. The market concentration ratio (CR4) is estimated at xx%, indicating a competitive yet concentrated landscape. Innovation is a crucial driver, with companies continuously investing in technological advancements like automation, precision farming capabilities, and electric powertrains. Stringent emission regulations are impacting the industry, forcing manufacturers to adopt cleaner technologies. Product substitutes, primarily encompassing smaller agricultural machinery and manual labor, pose a limited threat. The market is primarily segmented by end-users, namely the agriculture, construction, and landscaping sectors. Mergers and acquisitions (M&A) activity is moderate, with strategic acquisitions aimed at expanding product portfolios and geographical reach. In the period 2019-2024, the volume of M&A transactions was recorded at xx deals.
- Market Concentration: CR4 estimated at xx%.
- Innovation Drivers: Automation, precision farming, electric powertrains.
- Regulatory Impacts: Stringent emission standards driving technological advancements.
- Product Substitutes: Limited threat from smaller machinery and manual labor.
- End-User Segmentation: Agriculture, Construction, Landscaping sectors dominate.
- M&A Trends: Moderate activity focused on portfolio expansion and geographical reach.
Utility Tractors Market Market Trends & Opportunities
The global Utility Tractors Market is experiencing significant growth, driven by rising demand from the agricultural sector, infrastructure development, and landscaping projects. The market size is projected to reach xx Million by 2025 and further expand to xx Million by 2033. Technological advancements, such as the integration of GPS and sensor technology, are enhancing efficiency and productivity. Consumer preferences are shifting toward fuel-efficient, technologically advanced tractors with enhanced safety features. The market exhibits strong competitive dynamics, with established players and new entrants vying for market share. The CAGR for the forecast period (2025-2033) is projected to be xx%, driven by increasing demand from developing economies and advancements in autonomous technology. Market penetration rates vary across regions and segments, with higher penetration observed in developed countries and agricultural-intensive regions.
Dominant Markets & Segments in Utility Tractors Market
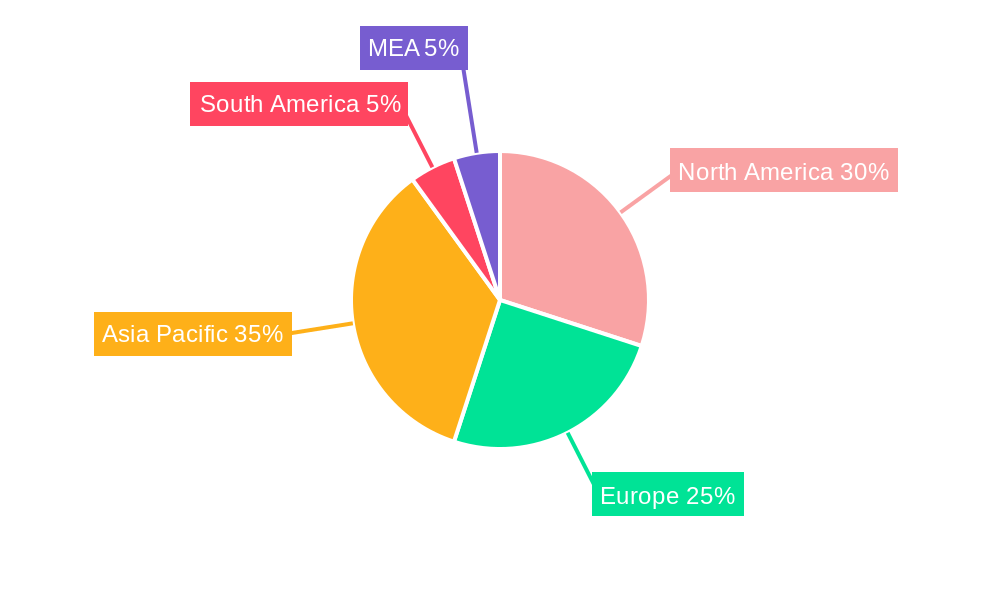
The North American market currently holds the largest share of the global Utility Tractors Market, followed by Europe and Asia-Pacific. Within the segments, the Agriculture application sector dominates due to its widespread use in farming operations. The 51-100 HP horsepower segment holds a significant share, catering to a wide range of tasks. The Off-highway type of utility tractors commands a higher market share due to the greater need for robust and versatile machines in demanding agricultural and construction environments.
- Key Growth Drivers (North America): Robust agricultural sector, government support for farm mechanization, infrastructure development projects.
- Key Growth Drivers (Europe): Increasing demand for efficient and environmentally friendly machinery, government subsidies for agricultural modernization.
- Key Growth Drivers (Asia-Pacific): Rapid economic growth, rising agricultural output, increasing urbanization.
Utility Tractors Market Product Analysis
Recent product innovations have centered on enhanced fuel efficiency, precision farming capabilities (GPS integration, auto-steering), and improved operator comfort. Electric and hybrid models are gaining traction, driven by sustainability concerns and government regulations. These advancements provide significant competitive advantages, attracting environmentally-conscious customers and improving operational efficiencies. Market fit is strong for technologically advanced and fuel-efficient tractors, especially in developed markets.
Key Drivers, Barriers & Challenges in Utility Tractors Market
Key Drivers: Increased agricultural output demand, rising infrastructure spending, technological advancements (automation, precision farming), supportive government policies promoting farm mechanization.
Challenges: Supply chain disruptions impacting component availability and lead times (estimated impact: xx% increase in production costs), stringent emission regulations increasing manufacturing costs, intense competition leading to price pressures.
Growth Drivers in the Utility Tractors Market Market
Technological advancements, particularly in automation and precision farming, are significantly driving market growth. Economic growth in developing countries is boosting demand, while supportive government policies (e.g., farm subsidies) further fuel expansion.
Challenges Impacting Utility Tractors Market Growth
Supply chain vulnerabilities (e.g., chip shortages) constrain production and increase costs. Stringent emission regulations necessitate costly technological upgrades. Intense competition from established players and new entrants leads to pricing pressures and reduced profitability.
Key Players Shaping the Utility Tractors Market Market
- Kuhn Group
- CNH Global NV
- Mahindra and Mahindra Corporation
- Deere and Company
- Yanmar Company Limite
- Kubota Corporation
- CLAAS KGaA mbH
- Tractors and Farm Equipment Limited (TAFE)
- Escorts Group
- AGCO Corporation
Significant Utility Tractors Market Industry Milestones
- December 2021: John Deere acquired Kreisel Electric Company, expanding its electric vehicle utility tractor lineup. This move signals a significant shift towards sustainable and technologically advanced products.
- April 2022: Kubota invested over USD 85 Million in a new 280-acre R&D facility in Georgia, demonstrating a commitment to meeting the needs of North American customers and expanding its production capacity.
Future Outlook for Utility Tractors Market Market
The Utility Tractors Market is poised for continued growth, driven by technological innovation, increasing demand from developing economies, and supportive government policies. Strategic investments in research and development, expansion into new markets, and the adoption of sustainable technologies will be crucial for success. The market presents significant opportunities for players who can adapt to changing consumer preferences and technological advancements.
Utility Tractors Market Segmentation
- 1. Production Analysis
- 2. Consumption Analysis
- 3. Import Market Analysis (Value & Volume)
- 4. Export Market Analysis (Value & Volume)
- 5. Price Trend Analysis
Utility Tractors Market Segmentation By Geography
-
1. North America
- 1.1. United States
- 1.2. Canada
- 1.3. Mexico
-
2. South America
- 2.1. Brazil
- 2.2. Argentina
- 2.3. Rest of South America
-
3. Europe
- 3.1. United Kingdom
- 3.2. Germany
- 3.3. France
- 3.4. Italy
- 3.5. Spain
- 3.6. Russia
- 3.7. Benelux
- 3.8. Nordics
- 3.9. Rest of Europe
-
4. Middle East & Africa
- 4.1. Turkey
- 4.2. Israel
- 4.3. GCC
- 4.4. North Africa
- 4.5. South Africa
- 4.6. Rest of Middle East & Africa
-
5. Asia Pacific
- 5.1. China
- 5.2. India
- 5.3. Japan
- 5.4. South Korea
- 5.5. ASEAN
- 5.6. Oceania
- 5.7. Rest of Asia Pacific
Utility Tractors Market Regional Market Share
Geographic Coverage of Utility Tractors Market
Utility Tractors Market REPORT HIGHLIGHTS
| Aspects | Details |
|---|---|
| Study Period | 2020-2034 |
| Base Year | 2025 |
| Estimated Year | 2026 |
| Forecast Period | 2026-2034 |
| Historical Period | 2020-2025 |
| Growth Rate | CAGR of 4.48% from 2020-2034 |
| Segmentation |
|
Table of Contents
- 1. Introduction
- 1.1. Research Scope
- 1.2. Market Segmentation
- 1.3. Research Objective
- 1.4. Definitions and Assumptions
- 2. Executive Summary
- 2.1. Market Snapshot
- 3. Market Dynamics
- 3.1. Market Drivers
- 3.2. Market Restrains
- 3.3. Market Trends
- 3.4. Market Opportunities
- 4. Market Factor Analysis
- 4.1. Porters Five Forces
- 4.1.1. Bargaining Power of Suppliers
- 4.1.2. Bargaining Power of Buyers
- 4.1.3. Threat of New Entrants
- 4.1.4. Threat of Substitutes
- 4.1.5. Competitive Rivalry
- 4.2. PESTEL analysis
- 4.3. BCG Analysis
- 4.3.1. Stars (High Growth, High Market Share)
- 4.3.2. Cash Cows (Low Growth, High Market Share)
- 4.3.3. Question Mark (High Growth, Low Market Share)
- 4.3.4. Dogs (Low Growth, Low Market Share)
- 4.4. Ansoff Matrix Analysis
- 4.5. Supply Chain Analysis
- 4.6. Regulatory Landscape
- 4.7. Current Market Potential and Opportunity Assessment (TAM–SAM–SOM Framework)
- 4.8. TIR Analyst Note
- 4.1. Porters Five Forces
- 5. Market Analysis, Insights and Forecast 2021-2033
- 5.1. Market Analysis, Insights and Forecast - by Production Analysis
- 5.2. Market Analysis, Insights and Forecast - by Consumption Analysis
- 5.3. Market Analysis, Insights and Forecast - by Import Market Analysis (Value & Volume)
- 5.4. Market Analysis, Insights and Forecast - by Export Market Analysis (Value & Volume)
- 5.5. Market Analysis, Insights and Forecast - by Price Trend Analysis
- 5.6. Market Analysis, Insights and Forecast - by Region
- 5.6.1. North America
- 5.6.2. South America
- 5.6.3. Europe
- 5.6.4. Middle East & Africa
- 5.6.5. Asia Pacific
- 6. Global Utility Tractors Market Analysis, Insights and Forecast, 2021-2033
- 6.1. Market Analysis, Insights and Forecast - by Production Analysis
- 6.2. Market Analysis, Insights and Forecast - by Consumption Analysis
- 6.3. Market Analysis, Insights and Forecast - by Import Market Analysis (Value & Volume)
- 6.4. Market Analysis, Insights and Forecast - by Export Market Analysis (Value & Volume)
- 6.5. Market Analysis, Insights and Forecast - by Price Trend Analysis
- 7. North America Utility Tractors Market Analysis, Insights and Forecast, 2020-2032
- 7.1. Market Analysis, Insights and Forecast - by Production Analysis
- 7.2. Market Analysis, Insights and Forecast - by Consumption Analysis
- 7.3. Market Analysis, Insights and Forecast - by Import Market Analysis (Value & Volume)
- 7.4. Market Analysis, Insights and Forecast - by Export Market Analysis (Value & Volume)
- 7.5. Market Analysis, Insights and Forecast - by Price Trend Analysis
- 8. South America Utility Tractors Market Analysis, Insights and Forecast, 2020-2032
- 8.1. Market Analysis, Insights and Forecast - by Production Analysis
- 8.2. Market Analysis, Insights and Forecast - by Consumption Analysis
- 8.3. Market Analysis, Insights and Forecast - by Import Market Analysis (Value & Volume)
- 8.4. Market Analysis, Insights and Forecast - by Export Market Analysis (Value & Volume)
- 8.5. Market Analysis, Insights and Forecast - by Price Trend Analysis
- 9. Europe Utility Tractors Market Analysis, Insights and Forecast, 2020-2032
- 9.1. Market Analysis, Insights and Forecast - by Production Analysis
- 9.2. Market Analysis, Insights and Forecast - by Consumption Analysis
- 9.3. Market Analysis, Insights and Forecast - by Import Market Analysis (Value & Volume)
- 9.4. Market Analysis, Insights and Forecast - by Export Market Analysis (Value & Volume)
- 9.5. Market Analysis, Insights and Forecast - by Price Trend Analysis
- 10. Middle East & Africa Utility Tractors Market Analysis, Insights and Forecast, 2020-2032
- 10.1. Market Analysis, Insights and Forecast - by Production Analysis
- 10.2. Market Analysis, Insights and Forecast - by Consumption Analysis
- 10.3. Market Analysis, Insights and Forecast - by Import Market Analysis (Value & Volume)
- 10.4. Market Analysis, Insights and Forecast - by Export Market Analysis (Value & Volume)
- 10.5. Market Analysis, Insights and Forecast - by Price Trend Analysis
- 11. Asia Pacific Utility Tractors Market Analysis, Insights and Forecast, 2020-2032
- 11.1. Market Analysis, Insights and Forecast - by Production Analysis
- 11.2. Market Analysis, Insights and Forecast - by Consumption Analysis
- 11.3. Market Analysis, Insights and Forecast - by Import Market Analysis (Value & Volume)
- 11.4. Market Analysis, Insights and Forecast - by Export Market Analysis (Value & Volume)
- 11.5. Market Analysis, Insights and Forecast - by Price Trend Analysis
- 12. Competitive Analysis
- 12.1. Company Profiles
- 12.1.1 Kuhn Group
- 12.1.1.1. Company Overview
- 12.1.1.2. Products
- 12.1.1.3. Company Financials
- 12.1.1.4. SWOT Analysis
- 12.1.2 CNH Global NV
- 12.1.2.1. Company Overview
- 12.1.2.2. Products
- 12.1.2.3. Company Financials
- 12.1.2.4. SWOT Analysis
- 12.1.3 Mahindra and Mahindra Corporation
- 12.1.3.1. Company Overview
- 12.1.3.2. Products
- 12.1.3.3. Company Financials
- 12.1.3.4. SWOT Analysis
- 12.1.4 Deere and Company
- 12.1.4.1. Company Overview
- 12.1.4.2. Products
- 12.1.4.3. Company Financials
- 12.1.4.4. SWOT Analysis
- 12.1.5 Yanmar Company Limite
- 12.1.5.1. Company Overview
- 12.1.5.2. Products
- 12.1.5.3. Company Financials
- 12.1.5.4. SWOT Analysis
- 12.1.6 Kubota Corporation
- 12.1.6.1. Company Overview
- 12.1.6.2. Products
- 12.1.6.3. Company Financials
- 12.1.6.4. SWOT Analysis
- 12.1.7 CLAAS KGaA mbH
- 12.1.7.1. Company Overview
- 12.1.7.2. Products
- 12.1.7.3. Company Financials
- 12.1.7.4. SWOT Analysis
- 12.1.8 Tractors and Farm Equipment Limited (TAFE)
- 12.1.8.1. Company Overview
- 12.1.8.2. Products
- 12.1.8.3. Company Financials
- 12.1.8.4. SWOT Analysis
- 12.1.9 Escorts Group
- 12.1.9.1. Company Overview
- 12.1.9.2. Products
- 12.1.9.3. Company Financials
- 12.1.9.4. SWOT Analysis
- 12.1.10 AGCO Corporation
- 12.1.10.1. Company Overview
- 12.1.10.2. Products
- 12.1.10.3. Company Financials
- 12.1.10.4. SWOT Analysis
- 12.1.1 Kuhn Group
- 12.2. Market Entropy
- 12.2.1 Company's Key Areas Served
- 12.2.2 Recent Developments
- 12.3. Company Market Share Analysis 2025
- 12.3.1 Top 5 Companies Market Share Analysis
- 12.3.2 Top 3 Companies Market Share Analysis
- 12.4. List of Potential Customers
- 13. Research Methodology
List of Figures
- Figure 1: Global Utility Tractors Market Revenue Breakdown (Million, %) by Region 2025 & 2033
- Figure 2: Global Utility Tractors Market Volume Breakdown (Kiloton, %) by Region 2025 & 2033
- Figure 3: North America Utility Tractors Market Revenue (Million), by Production Analysis 2025 & 2033
- Figure 4: North America Utility Tractors Market Volume (Kiloton), by Production Analysis 2025 & 2033
- Figure 5: North America Utility Tractors Market Revenue Share (%), by Production Analysis 2025 & 2033
- Figure 6: North America Utility Tractors Market Volume Share (%), by Production Analysis 2025 & 2033
- Figure 7: North America Utility Tractors Market Revenue (Million), by Consumption Analysis 2025 & 2033
- Figure 8: North America Utility Tractors Market Volume (Kiloton), by Consumption Analysis 2025 & 2033
- Figure 9: North America Utility Tractors Market Revenue Share (%), by Consumption Analysis 2025 & 2033
- Figure 10: North America Utility Tractors Market Volume Share (%), by Consumption Analysis 2025 & 2033
- Figure 11: North America Utility Tractors Market Revenue (Million), by Import Market Analysis (Value & Volume) 2025 & 2033
- Figure 12: North America Utility Tractors Market Volume (Kiloton), by Import Market Analysis (Value & Volume) 2025 & 2033
- Figure 13: North America Utility Tractors Market Revenue Share (%), by Import Market Analysis (Value & Volume) 2025 & 2033
- Figure 14: North America Utility Tractors Market Volume Share (%), by Import Market Analysis (Value & Volume) 2025 & 2033
- Figure 15: North America Utility Tractors Market Revenue (Million), by Export Market Analysis (Value & Volume) 2025 & 2033
- Figure 16: North America Utility Tractors Market Volume (Kiloton), by Export Market Analysis (Value & Volume) 2025 & 2033
- Figure 17: North America Utility Tractors Market Revenue Share (%), by Export Market Analysis (Value & Volume) 2025 & 2033
- Figure 18: North America Utility Tractors Market Volume Share (%), by Export Market Analysis (Value & Volume) 2025 & 2033
- Figure 19: North America Utility Tractors Market Revenue (Million), by Price Trend Analysis 2025 & 2033
- Figure 20: North America Utility Tractors Market Volume (Kiloton), by Price Trend Analysis 2025 & 2033
- Figure 21: North America Utility Tractors Market Revenue Share (%), by Price Trend Analysis 2025 & 2033
- Figure 22: North America Utility Tractors Market Volume Share (%), by Price Trend Analysis 2025 & 2033
- Figure 23: North America Utility Tractors Market Revenue (Million), by Country 2025 & 2033
- Figure 24: North America Utility Tractors Market Volume (Kiloton), by Country 2025 & 2033
- Figure 25: North America Utility Tractors Market Revenue Share (%), by Country 2025 & 2033
- Figure 26: North America Utility Tractors Market Volume Share (%), by Country 2025 & 2033
- Figure 27: South America Utility Tractors Market Revenue (Million), by Production Analysis 2025 & 2033
- Figure 28: South America Utility Tractors Market Volume (Kiloton), by Production Analysis 2025 & 2033
- Figure 29: South America Utility Tractors Market Revenue Share (%), by Production Analysis 2025 & 2033
- Figure 30: South America Utility Tractors Market Volume Share (%), by Production Analysis 2025 & 2033
- Figure 31: South America Utility Tractors Market Revenue (Million), by Consumption Analysis 2025 & 2033
- Figure 32: South America Utility Tractors Market Volume (Kiloton), by Consumption Analysis 2025 & 2033
- Figure 33: South America Utility Tractors Market Revenue Share (%), by Consumption Analysis 2025 & 2033
- Figure 34: South America Utility Tractors Market Volume Share (%), by Consumption Analysis 2025 & 2033
- Figure 35: South America Utility Tractors Market Revenue (Million), by Import Market Analysis (Value & Volume) 2025 & 2033
- Figure 36: South America Utility Tractors Market Volume (Kiloton), by Import Market Analysis (Value & Volume) 2025 & 2033
- Figure 37: South America Utility Tractors Market Revenue Share (%), by Import Market Analysis (Value & Volume) 2025 & 2033
- Figure 38: South America Utility Tractors Market Volume Share (%), by Import Market Analysis (Value & Volume) 2025 & 2033
- Figure 39: South America Utility Tractors Market Revenue (Million), by Export Market Analysis (Value & Volume) 2025 & 2033
- Figure 40: South America Utility Tractors Market Volume (Kiloton), by Export Market Analysis (Value & Volume) 2025 & 2033
- Figure 41: South America Utility Tractors Market Revenue Share (%), by Export Market Analysis (Value & Volume) 2025 & 2033
- Figure 42: South America Utility Tractors Market Volume Share (%), by Export Market Analysis (Value & Volume) 2025 & 2033
- Figure 43: South America Utility Tractors Market Revenue (Million), by Price Trend Analysis 2025 & 2033
- Figure 44: South America Utility Tractors Market Volume (Kiloton), by Price Trend Analysis 2025 & 2033
- Figure 45: South America Utility Tractors Market Revenue Share (%), by Price Trend Analysis 2025 & 2033
- Figure 46: South America Utility Tractors Market Volume Share (%), by Price Trend Analysis 2025 & 2033
- Figure 47: South America Utility Tractors Market Revenue (Million), by Country 2025 & 2033
- Figure 48: South America Utility Tractors Market Volume (Kiloton), by Country 2025 & 2033
- Figure 49: South America Utility Tractors Market Revenue Share (%), by Country 2025 & 2033
- Figure 50: South America Utility Tractors Market Volume Share (%), by Country 2025 & 2033
- Figure 51: Europe Utility Tractors Market Revenue (Million), by Production Analysis 2025 & 2033
- Figure 52: Europe Utility Tractors Market Volume (Kiloton), by Production Analysis 2025 & 2033
- Figure 53: Europe Utility Tractors Market Revenue Share (%), by Production Analysis 2025 & 2033
- Figure 54: Europe Utility Tractors Market Volume Share (%), by Production Analysis 2025 & 2033
- Figure 55: Europe Utility Tractors Market Revenue (Million), by Consumption Analysis 2025 & 2033
- Figure 56: Europe Utility Tractors Market Volume (Kiloton), by Consumption Analysis 2025 & 2033
- Figure 57: Europe Utility Tractors Market Revenue Share (%), by Consumption Analysis 2025 & 2033
- Figure 58: Europe Utility Tractors Market Volume Share (%), by Consumption Analysis 2025 & 2033
- Figure 59: Europe Utility Tractors Market Revenue (Million), by Import Market Analysis (Value & Volume) 2025 & 2033
- Figure 60: Europe Utility Tractors Market Volume (Kiloton), by Import Market Analysis (Value & Volume) 2025 & 2033
- Figure 61: Europe Utility Tractors Market Revenue Share (%), by Import Market Analysis (Value & Volume) 2025 & 2033
- Figure 62: Europe Utility Tractors Market Volume Share (%), by Import Market Analysis (Value & Volume) 2025 & 2033
- Figure 63: Europe Utility Tractors Market Revenue (Million), by Export Market Analysis (Value & Volume) 2025 & 2033
- Figure 64: Europe Utility Tractors Market Volume (Kiloton), by Export Market Analysis (Value & Volume) 2025 & 2033
- Figure 65: Europe Utility Tractors Market Revenue Share (%), by Export Market Analysis (Value & Volume) 2025 & 2033
- Figure 66: Europe Utility Tractors Market Volume Share (%), by Export Market Analysis (Value & Volume) 2025 & 2033
- Figure 67: Europe Utility Tractors Market Revenue (Million), by Price Trend Analysis 2025 & 2033
- Figure 68: Europe Utility Tractors Market Volume (Kiloton), by Price Trend Analysis 2025 & 2033
- Figure 69: Europe Utility Tractors Market Revenue Share (%), by Price Trend Analysis 2025 & 2033
- Figure 70: Europe Utility Tractors Market Volume Share (%), by Price Trend Analysis 2025 & 2033
- Figure 71: Europe Utility Tractors Market Revenue (Million), by Country 2025 & 2033
- Figure 72: Europe Utility Tractors Market Volume (Kiloton), by Country 2025 & 2033
- Figure 73: Europe Utility Tractors Market Revenue Share (%), by Country 2025 & 2033
- Figure 74: Europe Utility Tractors Market Volume Share (%), by Country 2025 & 2033
- Figure 75: Middle East & Africa Utility Tractors Market Revenue (Million), by Production Analysis 2025 & 2033
- Figure 76: Middle East & Africa Utility Tractors Market Volume (Kiloton), by Production Analysis 2025 & 2033
- Figure 77: Middle East & Africa Utility Tractors Market Revenue Share (%), by Production Analysis 2025 & 2033
- Figure 78: Middle East & Africa Utility Tractors Market Volume Share (%), by Production Analysis 2025 & 2033
- Figure 79: Middle East & Africa Utility Tractors Market Revenue (Million), by Consumption Analysis 2025 & 2033
- Figure 80: Middle East & Africa Utility Tractors Market Volume (Kiloton), by Consumption Analysis 2025 & 2033
- Figure 81: Middle East & Africa Utility Tractors Market Revenue Share (%), by Consumption Analysis 2025 & 2033
- Figure 82: Middle East & Africa Utility Tractors Market Volume Share (%), by Consumption Analysis 2025 & 2033
- Figure 83: Middle East & Africa Utility Tractors Market Revenue (Million), by Import Market Analysis (Value & Volume) 2025 & 2033
- Figure 84: Middle East & Africa Utility Tractors Market Volume (Kiloton), by Import Market Analysis (Value & Volume) 2025 & 2033
- Figure 85: Middle East & Africa Utility Tractors Market Revenue Share (%), by Import Market Analysis (Value & Volume) 2025 & 2033
- Figure 86: Middle East & Africa Utility Tractors Market Volume Share (%), by Import Market Analysis (Value & Volume) 2025 & 2033
- Figure 87: Middle East & Africa Utility Tractors Market Revenue (Million), by Export Market Analysis (Value & Volume) 2025 & 2033
- Figure 88: Middle East & Africa Utility Tractors Market Volume (Kiloton), by Export Market Analysis (Value & Volume) 2025 & 2033
- Figure 89: Middle East & Africa Utility Tractors Market Revenue Share (%), by Export Market Analysis (Value & Volume) 2025 & 2033
- Figure 90: Middle East & Africa Utility Tractors Market Volume Share (%), by Export Market Analysis (Value & Volume) 2025 & 2033
- Figure 91: Middle East & Africa Utility Tractors Market Revenue (Million), by Price Trend Analysis 2025 & 2033
- Figure 92: Middle East & Africa Utility Tractors Market Volume (Kiloton), by Price Trend Analysis 2025 & 2033
- Figure 93: Middle East & Africa Utility Tractors Market Revenue Share (%), by Price Trend Analysis 2025 & 2033
- Figure 94: Middle East & Africa Utility Tractors Market Volume Share (%), by Price Trend Analysis 2025 & 2033
- Figure 95: Middle East & Africa Utility Tractors Market Revenue (Million), by Country 2025 & 2033
- Figure 96: Middle East & Africa Utility Tractors Market Volume (Kiloton), by Country 2025 & 2033
- Figure 97: Middle East & Africa Utility Tractors Market Revenue Share (%), by Country 2025 & 2033
- Figure 98: Middle East & Africa Utility Tractors Market Volume Share (%), by Country 2025 & 2033
- Figure 99: Asia Pacific Utility Tractors Market Revenue (Million), by Production Analysis 2025 & 2033
- Figure 100: Asia Pacific Utility Tractors Market Volume (Kiloton), by Production Analysis 2025 & 2033
- Figure 101: Asia Pacific Utility Tractors Market Revenue Share (%), by Production Analysis 2025 & 2033
- Figure 102: Asia Pacific Utility Tractors Market Volume Share (%), by Production Analysis 2025 & 2033
- Figure 103: Asia Pacific Utility Tractors Market Revenue (Million), by Consumption Analysis 2025 & 2033
- Figure 104: Asia Pacific Utility Tractors Market Volume (Kiloton), by Consumption Analysis 2025 & 2033
- Figure 105: Asia Pacific Utility Tractors Market Revenue Share (%), by Consumption Analysis 2025 & 2033
- Figure 106: Asia Pacific Utility Tractors Market Volume Share (%), by Consumption Analysis 2025 & 2033
- Figure 107: Asia Pacific Utility Tractors Market Revenue (Million), by Import Market Analysis (Value & Volume) 2025 & 2033
- Figure 108: Asia Pacific Utility Tractors Market Volume (Kiloton), by Import Market Analysis (Value & Volume) 2025 & 2033
- Figure 109: Asia Pacific Utility Tractors Market Revenue Share (%), by Import Market Analysis (Value & Volume) 2025 & 2033
- Figure 110: Asia Pacific Utility Tractors Market Volume Share (%), by Import Market Analysis (Value & Volume) 2025 & 2033
- Figure 111: Asia Pacific Utility Tractors Market Revenue (Million), by Export Market Analysis (Value & Volume) 2025 & 2033
- Figure 112: Asia Pacific Utility Tractors Market Volume (Kiloton), by Export Market Analysis (Value & Volume) 2025 & 2033
- Figure 113: Asia Pacific Utility Tractors Market Revenue Share (%), by Export Market Analysis (Value & Volume) 2025 & 2033
- Figure 114: Asia Pacific Utility Tractors Market Volume Share (%), by Export Market Analysis (Value & Volume) 2025 & 2033
- Figure 115: Asia Pacific Utility Tractors Market Revenue (Million), by Price Trend Analysis 2025 & 2033
- Figure 116: Asia Pacific Utility Tractors Market Volume (Kiloton), by Price Trend Analysis 2025 & 2033
- Figure 117: Asia Pacific Utility Tractors Market Revenue Share (%), by Price Trend Analysis 2025 & 2033
- Figure 118: Asia Pacific Utility Tractors Market Volume Share (%), by Price Trend Analysis 2025 & 2033
- Figure 119: Asia Pacific Utility Tractors Market Revenue (Million), by Country 2025 & 2033
- Figure 120: Asia Pacific Utility Tractors Market Volume (Kiloton), by Country 2025 & 2033
- Figure 121: Asia Pacific Utility Tractors Market Revenue Share (%), by Country 2025 & 2033
- Figure 122: Asia Pacific Utility Tractors Market Volume Share (%), by Country 2025 & 2033
List of Tables
- Table 1: Global Utility Tractors Market Revenue Million Forecast, by Production Analysis 2020 & 2033
- Table 2: Global Utility Tractors Market Volume Kiloton Forecast, by Production Analysis 2020 & 2033
- Table 3: Global Utility Tractors Market Revenue Million Forecast, by Consumption Analysis 2020 & 2033
- Table 4: Global Utility Tractors Market Volume Kiloton Forecast, by Consumption Analysis 2020 & 2033
- Table 5: Global Utility Tractors Market Revenue Million Forecast, by Import Market Analysis (Value & Volume) 2020 & 2033
- Table 6: Global Utility Tractors Market Volume Kiloton Forecast, by Import Market Analysis (Value & Volume) 2020 & 2033
- Table 7: Global Utility Tractors Market Revenue Million Forecast, by Export Market Analysis (Value & Volume) 2020 & 2033
- Table 8: Global Utility Tractors Market Volume Kiloton Forecast, by Export Market Analysis (Value & Volume) 2020 & 2033
- Table 9: Global Utility Tractors Market Revenue Million Forecast, by Price Trend Analysis 2020 & 2033
- Table 10: Global Utility Tractors Market Volume Kiloton Forecast, by Price Trend Analysis 2020 & 2033
- Table 11: Global Utility Tractors Market Revenue Million Forecast, by Region 2020 & 2033
- Table 12: Global Utility Tractors Market Volume Kiloton Forecast, by Region 2020 & 2033
- Table 13: Global Utility Tractors Market Revenue Million Forecast, by Production Analysis 2020 & 2033
- Table 14: Global Utility Tractors Market Volume Kiloton Forecast, by Production Analysis 2020 & 2033
- Table 15: Global Utility Tractors Market Revenue Million Forecast, by Consumption Analysis 2020 & 2033
- Table 16: Global Utility Tractors Market Volume Kiloton Forecast, by Consumption Analysis 2020 & 2033
- Table 17: Global Utility Tractors Market Revenue Million Forecast, by Import Market Analysis (Value & Volume) 2020 & 2033
- Table 18: Global Utility Tractors Market Volume Kiloton Forecast, by Import Market Analysis (Value & Volume) 2020 & 2033
- Table 19: Global Utility Tractors Market Revenue Million Forecast, by Export Market Analysis (Value & Volume) 2020 & 2033
- Table 20: Global Utility Tractors Market Volume Kiloton Forecast, by Export Market Analysis (Value & Volume) 2020 & 2033
- Table 21: Global Utility Tractors Market Revenue Million Forecast, by Price Trend Analysis 2020 & 2033
- Table 22: Global Utility Tractors Market Volume Kiloton Forecast, by Price Trend Analysis 2020 & 2033
- Table 23: Global Utility Tractors Market Revenue Million Forecast, by Country 2020 & 2033
- Table 24: Global Utility Tractors Market Volume Kiloton Forecast, by Country 2020 & 2033
- Table 25: United States Utility Tractors Market Revenue (Million) Forecast, by Application 2020 & 2033
- Table 26: United States Utility Tractors Market Volume (Kiloton) Forecast, by Application 2020 & 2033
- Table 27: Canada Utility Tractors Market Revenue (Million) Forecast, by Application 2020 & 2033
- Table 28: Canada Utility Tractors Market Volume (Kiloton) Forecast, by Application 2020 & 2033
- Table 29: Mexico Utility Tractors Market Revenue (Million) Forecast, by Application 2020 & 2033
- Table 30: Mexico Utility Tractors Market Volume (Kiloton) Forecast, by Application 2020 & 2033
- Table 31: Global Utility Tractors Market Revenue Million Forecast, by Production Analysis 2020 & 2033
- Table 32: Global Utility Tractors Market Volume Kiloton Forecast, by Production Analysis 2020 & 2033
- Table 33: Global Utility Tractors Market Revenue Million Forecast, by Consumption Analysis 2020 & 2033
- Table 34: Global Utility Tractors Market Volume Kiloton Forecast, by Consumption Analysis 2020 & 2033
- Table 35: Global Utility Tractors Market Revenue Million Forecast, by Import Market Analysis (Value & Volume) 2020 & 2033
- Table 36: Global Utility Tractors Market Volume Kiloton Forecast, by Import Market Analysis (Value & Volume) 2020 & 2033
- Table 37: Global Utility Tractors Market Revenue Million Forecast, by Export Market Analysis (Value & Volume) 2020 & 2033
- Table 38: Global Utility Tractors Market Volume Kiloton Forecast, by Export Market Analysis (Value & Volume) 2020 & 2033
- Table 39: Global Utility Tractors Market Revenue Million Forecast, by Price Trend Analysis 2020 & 2033
- Table 40: Global Utility Tractors Market Volume Kiloton Forecast, by Price Trend Analysis 2020 & 2033
- Table 41: Global Utility Tractors Market Revenue Million Forecast, by Country 2020 & 2033
- Table 42: Global Utility Tractors Market Volume Kiloton Forecast, by Country 2020 & 2033
- Table 43: Brazil Utility Tractors Market Revenue (Million) Forecast, by Application 2020 & 2033
- Table 44: Brazil Utility Tractors Market Volume (Kiloton) Forecast, by Application 2020 & 2033
- Table 45: Argentina Utility Tractors Market Revenue (Million) Forecast, by Application 2020 & 2033
- Table 46: Argentina Utility Tractors Market Volume (Kiloton) Forecast, by Application 2020 & 2033
- Table 47: Rest of South America Utility Tractors Market Revenue (Million) Forecast, by Application 2020 & 2033
- Table 48: Rest of South America Utility Tractors Market Volume (Kiloton) Forecast, by Application 2020 & 2033
- Table 49: Global Utility Tractors Market Revenue Million Forecast, by Production Analysis 2020 & 2033
- Table 50: Global Utility Tractors Market Volume Kiloton Forecast, by Production Analysis 2020 & 2033
- Table 51: Global Utility Tractors Market Revenue Million Forecast, by Consumption Analysis 2020 & 2033
- Table 52: Global Utility Tractors Market Volume Kiloton Forecast, by Consumption Analysis 2020 & 2033
- Table 53: Global Utility Tractors Market Revenue Million Forecast, by Import Market Analysis (Value & Volume) 2020 & 2033
- Table 54: Global Utility Tractors Market Volume Kiloton Forecast, by Import Market Analysis (Value & Volume) 2020 & 2033
- Table 55: Global Utility Tractors Market Revenue Million Forecast, by Export Market Analysis (Value & Volume) 2020 & 2033
- Table 56: Global Utility Tractors Market Volume Kiloton Forecast, by Export Market Analysis (Value & Volume) 2020 & 2033
- Table 57: Global Utility Tractors Market Revenue Million Forecast, by Price Trend Analysis 2020 & 2033
- Table 58: Global Utility Tractors Market Volume Kiloton Forecast, by Price Trend Analysis 2020 & 2033
- Table 59: Global Utility Tractors Market Revenue Million Forecast, by Country 2020 & 2033
- Table 60: Global Utility Tractors Market Volume Kiloton Forecast, by Country 2020 & 2033
- Table 61: United Kingdom Utility Tractors Market Revenue (Million) Forecast, by Application 2020 & 2033
- Table 62: United Kingdom Utility Tractors Market Volume (Kiloton) Forecast, by Application 2020 & 2033
- Table 63: Germany Utility Tractors Market Revenue (Million) Forecast, by Application 2020 & 2033
- Table 64: Germany Utility Tractors Market Volume (Kiloton) Forecast, by Application 2020 & 2033
- Table 65: France Utility Tractors Market Revenue (Million) Forecast, by Application 2020 & 2033
- Table 66: France Utility Tractors Market Volume (Kiloton) Forecast, by Application 2020 & 2033
- Table 67: Italy Utility Tractors Market Revenue (Million) Forecast, by Application 2020 & 2033
- Table 68: Italy Utility Tractors Market Volume (Kiloton) Forecast, by Application 2020 & 2033
- Table 69: Spain Utility Tractors Market Revenue (Million) Forecast, by Application 2020 & 2033
- Table 70: Spain Utility Tractors Market Volume (Kiloton) Forecast, by Application 2020 & 2033
- Table 71: Russia Utility Tractors Market Revenue (Million) Forecast, by Application 2020 & 2033
- Table 72: Russia Utility Tractors Market Volume (Kiloton) Forecast, by Application 2020 & 2033
- Table 73: Benelux Utility Tractors Market Revenue (Million) Forecast, by Application 2020 & 2033
- Table 74: Benelux Utility Tractors Market Volume (Kiloton) Forecast, by Application 2020 & 2033
- Table 75: Nordics Utility Tractors Market Revenue (Million) Forecast, by Application 2020 & 2033
- Table 76: Nordics Utility Tractors Market Volume (Kiloton) Forecast, by Application 2020 & 2033
- Table 77: Rest of Europe Utility Tractors Market Revenue (Million) Forecast, by Application 2020 & 2033
- Table 78: Rest of Europe Utility Tractors Market Volume (Kiloton) Forecast, by Application 2020 & 2033
- Table 79: Global Utility Tractors Market Revenue Million Forecast, by Production Analysis 2020 & 2033
- Table 80: Global Utility Tractors Market Volume Kiloton Forecast, by Production Analysis 2020 & 2033
- Table 81: Global Utility Tractors Market Revenue Million Forecast, by Consumption Analysis 2020 & 2033
- Table 82: Global Utility Tractors Market Volume Kiloton Forecast, by Consumption Analysis 2020 & 2033
- Table 83: Global Utility Tractors Market Revenue Million Forecast, by Import Market Analysis (Value & Volume) 2020 & 2033
- Table 84: Global Utility Tractors Market Volume Kiloton Forecast, by Import Market Analysis (Value & Volume) 2020 & 2033
- Table 85: Global Utility Tractors Market Revenue Million Forecast, by Export Market Analysis (Value & Volume) 2020 & 2033
- Table 86: Global Utility Tractors Market Volume Kiloton Forecast, by Export Market Analysis (Value & Volume) 2020 & 2033
- Table 87: Global Utility Tractors Market Revenue Million Forecast, by Price Trend Analysis 2020 & 2033
- Table 88: Global Utility Tractors Market Volume Kiloton Forecast, by Price Trend Analysis 2020 & 2033
- Table 89: Global Utility Tractors Market Revenue Million Forecast, by Country 2020 & 2033
- Table 90: Global Utility Tractors Market Volume Kiloton Forecast, by Country 2020 & 2033
- Table 91: Turkey Utility Tractors Market Revenue (Million) Forecast, by Application 2020 & 2033
- Table 92: Turkey Utility Tractors Market Volume (Kiloton) Forecast, by Application 2020 & 2033
- Table 93: Israel Utility Tractors Market Revenue (Million) Forecast, by Application 2020 & 2033
- Table 94: Israel Utility Tractors Market Volume (Kiloton) Forecast, by Application 2020 & 2033
- Table 95: GCC Utility Tractors Market Revenue (Million) Forecast, by Application 2020 & 2033
- Table 96: GCC Utility Tractors Market Volume (Kiloton) Forecast, by Application 2020 & 2033
- Table 97: North Africa Utility Tractors Market Revenue (Million) Forecast, by Application 2020 & 2033
- Table 98: North Africa Utility Tractors Market Volume (Kiloton) Forecast, by Application 2020 & 2033
- Table 99: South Africa Utility Tractors Market Revenue (Million) Forecast, by Application 2020 & 2033
- Table 100: South Africa Utility Tractors Market Volume (Kiloton) Forecast, by Application 2020 & 2033
- Table 101: Rest of Middle East & Africa Utility Tractors Market Revenue (Million) Forecast, by Application 2020 & 2033
- Table 102: Rest of Middle East & Africa Utility Tractors Market Volume (Kiloton) Forecast, by Application 2020 & 2033
- Table 103: Global Utility Tractors Market Revenue Million Forecast, by Production Analysis 2020 & 2033
- Table 104: Global Utility Tractors Market Volume Kiloton Forecast, by Production Analysis 2020 & 2033
- Table 105: Global Utility Tractors Market Revenue Million Forecast, by Consumption Analysis 2020 & 2033
- Table 106: Global Utility Tractors Market Volume Kiloton Forecast, by Consumption Analysis 2020 & 2033
- Table 107: Global Utility Tractors Market Revenue Million Forecast, by Import Market Analysis (Value & Volume) 2020 & 2033
- Table 108: Global Utility Tractors Market Volume Kiloton Forecast, by Import Market Analysis (Value & Volume) 2020 & 2033
- Table 109: Global Utility Tractors Market Revenue Million Forecast, by Export Market Analysis (Value & Volume) 2020 & 2033
- Table 110: Global Utility Tractors Market Volume Kiloton Forecast, by Export Market Analysis (Value & Volume) 2020 & 2033
- Table 111: Global Utility Tractors Market Revenue Million Forecast, by Price Trend Analysis 2020 & 2033
- Table 112: Global Utility Tractors Market Volume Kiloton Forecast, by Price Trend Analysis 2020 & 2033
- Table 113: Global Utility Tractors Market Revenue Million Forecast, by Country 2020 & 2033
- Table 114: Global Utility Tractors Market Volume Kiloton Forecast, by Country 2020 & 2033
- Table 115: China Utility Tractors Market Revenue (Million) Forecast, by Application 2020 & 2033
- Table 116: China Utility Tractors Market Volume (Kiloton) Forecast, by Application 2020 & 2033
- Table 117: India Utility Tractors Market Revenue (Million) Forecast, by Application 2020 & 2033
- Table 118: India Utility Tractors Market Volume (Kiloton) Forecast, by Application 2020 & 2033
- Table 119: Japan Utility Tractors Market Revenue (Million) Forecast, by Application 2020 & 2033
- Table 120: Japan Utility Tractors Market Volume (Kiloton) Forecast, by Application 2020 & 2033
- Table 121: South Korea Utility Tractors Market Revenue (Million) Forecast, by Application 2020 & 2033
- Table 122: South Korea Utility Tractors Market Volume (Kiloton) Forecast, by Application 2020 & 2033
- Table 123: ASEAN Utility Tractors Market Revenue (Million) Forecast, by Application 2020 & 2033
- Table 124: ASEAN Utility Tractors Market Volume (Kiloton) Forecast, by Application 2020 & 2033
- Table 125: Oceania Utility Tractors Market Revenue (Million) Forecast, by Application 2020 & 2033
- Table 126: Oceania Utility Tractors Market Volume (Kiloton) Forecast, by Application 2020 & 2033
- Table 127: Rest of Asia Pacific Utility Tractors Market Revenue (Million) Forecast, by Application 2020 & 2033
- Table 128: Rest of Asia Pacific Utility Tractors Market Volume (Kiloton) Forecast, by Application 2020 & 2033
Frequently Asked Questions
1. What is the projected Compound Annual Growth Rate (CAGR) of the Utility Tractors Market?
The projected CAGR is approximately 4.48%.
2. Which companies are prominent players in the Utility Tractors Market?
Key companies in the market include Kuhn Group, CNH Global NV, Mahindra and Mahindra Corporation, Deere and Company, Yanmar Company Limite, Kubota Corporation, CLAAS KGaA mbH, Tractors and Farm Equipment Limited (TAFE), Escorts Group, AGCO Corporation.
3. What are the main segments of the Utility Tractors Market?
The market segments include Production Analysis, Consumption Analysis, Import Market Analysis (Value & Volume), Export Market Analysis (Value & Volume), Price Trend Analysis.
4. Can you provide details about the market size?
The market size is estimated to be USD 42.50 Million as of 2022.
5. What are some drivers contributing to market growth?
Brazilian Farm Structure and Consolidation of Smaller Farms; Technological Advancements.
6. What are the notable trends driving market growth?
Growing Preference For Farm Mechanization.
7. Are there any restraints impacting market growth?
High Cost of Equipment and Price Sensitivity; Data Privacy Concerns.
8. Can you provide examples of recent developments in the market?
April 2022: Kubota expanded its R&D sector in a new 280-acre land in Georgia to meet North American customers' tractor needs. Kubota invested more than USD 85 million in bringing the new facility to an online platform.
9. What pricing options are available for accessing the report?
Pricing options include single-user, multi-user, and enterprise licenses priced at USD 4750, USD 5250, and USD 8750 respectively.
10. Is the market size provided in terms of value or volume?
The market size is provided in terms of value, measured in Million and volume, measured in Kiloton.
11. Are there any specific market keywords associated with the report?
Yes, the market keyword associated with the report is "Utility Tractors Market," which aids in identifying and referencing the specific market segment covered.
12. How do I determine which pricing option suits my needs best?
The pricing options vary based on user requirements and access needs. Individual users may opt for single-user licenses, while businesses requiring broader access may choose multi-user or enterprise licenses for cost-effective access to the report.
13. Are there any additional resources or data provided in the Utility Tractors Market report?
While the report offers comprehensive insights, it's advisable to review the specific contents or supplementary materials provided to ascertain if additional resources or data are available.
14. How can I stay updated on further developments or reports in the Utility Tractors Market?
To stay informed about further developments, trends, and reports in the Utility Tractors Market, consider subscribing to industry newsletters, following relevant companies and organizations, or regularly checking reputable industry news sources and publications.
Methodology
Step 1 - Identification of Relevant Samples Size from Population Database


Step 2 - Approaches for Defining Global Market Size (Value, Volume* & Price*)

Note*: In applicable scenarios
Step 3 - Data Sources
Primary Research
- Web Analytics
- Survey Reports
- Research Institute
- Latest Research Reports
- Opinion Leaders
Secondary Research
- Annual Reports
- White Paper
- Latest Press Release
- Industry Association
- Paid Database
- Investor Presentations

Step 4 - Data Triangulation
Involves using different sources of information in order to increase the validity of a study
These sources are likely to be stakeholders in a program - participants, other researchers, program staff, other community members, and so on.
Then we put all data in single framework & apply various statistical tools to find out the dynamic on the market.
During the analysis stage, feedback from the stakeholder groups would be compared to determine areas of agreement as well as areas of divergence