

Key Insights
The global wafer-used Chemical Vapor Deposition (CVD) equipment market is experiencing substantial growth, driven by the escalating demand for sophisticated semiconductor devices across diverse sectors such as smartphones, automotive, and high-performance computing. The market, projected to reach $18.03 billion by the base year 2025, is anticipated to expand at a Compound Annual Growth Rate (CAGR) of 5.95% through 2033. This robust expansion is attributed to several pivotal factors. Firstly, the continuous drive for semiconductor miniaturization necessitates advanced CVD techniques for precise thin-film deposition, thereby fueling demand for high-performance equipment. Secondly, the widespread adoption of 5G technology, artificial intelligence (AI), and the Internet of Things (IoT) is significantly increasing the requirement for advanced semiconductors, consequently boosting the need for CVD equipment. Thirdly, governmental support and considerable R&D investments globally are accelerating market development. Leading companies, including Applied Materials, Lam Research, and Tokyo Electron, are actively pursuing innovation to enhance equipment efficiency, precision, and throughput, while diversifying product offerings to meet evolving market demands.
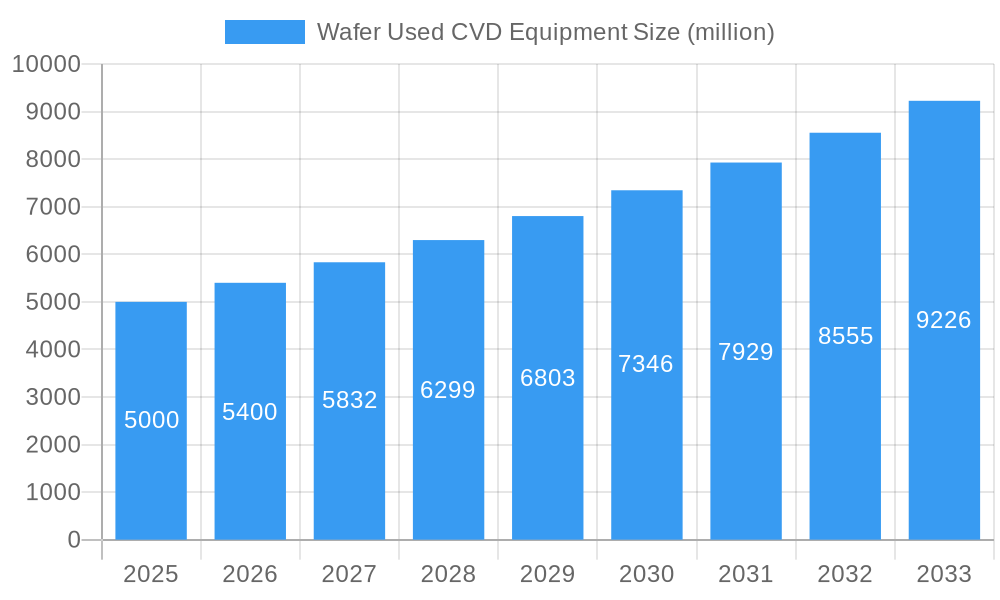
Wafer Used CVD Equipment Market Size (In Billion)
Despite positive trends, the market faces certain constraints. The substantial capital expenditure for acquiring and maintaining advanced CVD equipment presents a barrier, especially for smaller enterprises. Additionally, the inherent cyclicality of the semiconductor industry, susceptible to economic fluctuations, can affect market expansion. Intense competition among established and emerging players further necessitates continuous innovation and strategic alliances to sustain a competitive advantage. Nevertheless, the long-term outlook for the wafer-used CVD equipment market remains optimistic, supported by the persistent demand for smaller, faster, and more energy-efficient semiconductor components. Technological advancements, such as the development of Atomic Layer Deposition (ALD) and other cutting-edge CVD methods, are poised to further drive market growth in the future. Market segmentation by equipment type, wafer size, and application will continue to define the industry's trajectory.
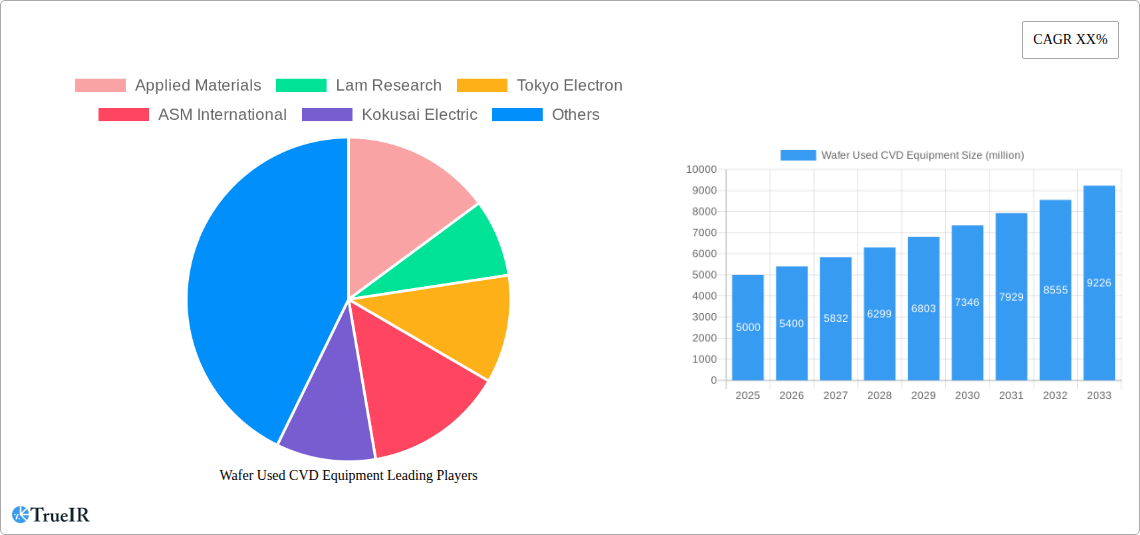
Wafer Used CVD Equipment Company Market Share
Dynamic Wafer Used CVD Equipment Market Report: 2019-2033
This comprehensive report provides an in-depth analysis of the global wafer used CVD equipment market, offering invaluable insights for industry stakeholders, investors, and researchers. With a meticulous examination spanning the period from 2019 to 2033, including a detailed forecast from 2025 to 2033, this report unveils the market's current state, future trajectory, and key players shaping its evolution. The base year for this analysis is 2025, and the estimated year is also 2025. The market is projected to reach a value of $XX million by 2033.
Wafer Used CVD Equipment Market Structure & Competitive Landscape
This section delves into the competitive dynamics of the wafer used CVD equipment market. The market exhibits a moderately concentrated structure, with key players like Applied Materials, Lam Research, and Tokyo Electron holding significant market share. The Herfindahl-Hirschman Index (HHI) for 2025 is estimated at xx, indicating a moderately concentrated market.
Innovation Drivers: Continuous advancements in semiconductor technology, particularly in areas like 3D NAND and advanced logic nodes, are driving demand for more sophisticated CVD equipment. This leads to ongoing innovation in deposition techniques, materials, and process control.
Regulatory Impacts: Stringent environmental regulations related to hazardous gas emissions are impacting the design and operation of CVD equipment. Companies are investing heavily in cleaner and more efficient technologies to comply.
Product Substitutes: While CVD remains a dominant thin-film deposition technique, alternative methods like atomic layer deposition (ALD) are emerging as potential substitutes for specific applications. Competition from ALD technologies is gradually increasing.
End-User Segmentation: The primary end-users are semiconductor manufacturers across various segments, including memory (DRAM, NAND), logic, and microelectronics. The growth in the memory sector significantly impacts overall market demand.
M&A Trends: The market has witnessed a moderate level of mergers and acquisitions (M&A) activity in the past five years, with approximately xx deals completed, primarily focused on strengthening technological capabilities and expanding market reach. The total value of these transactions is estimated at $xx million.
Wafer Used CVD Equipment Market Trends & Opportunities
The global wafer used CVD equipment market is experiencing robust growth, driven by the increasing demand for advanced semiconductor devices. The market size was valued at $xx million in 2024 and is projected to reach $xx million by 2033, exhibiting a CAGR of xx% during the forecast period (2025-2033). This growth is fueled by several key trends:
Technological Advancements: The continuous miniaturization of semiconductor devices necessitates the development of more precise and efficient CVD systems. Advanced features like higher throughput, improved uniformity, and reduced defect rates are driving market expansion.
Consumer Preferences: The rising demand for high-performance computing, mobile devices, and internet of things (IoT) applications fuels the growth of the semiconductor industry, and thus the demand for wafer used CVD equipment.
Competitive Dynamics: The market is characterized by intense competition among established players and emerging entrants. This competition is driving innovation and pushing prices down, benefiting end-users.
Market Penetration Rate: The market penetration rate of advanced CVD equipment is steadily increasing, especially in emerging economies with growing semiconductor manufacturing capabilities. This indicates a significant untapped market potential.
Dominant Markets & Segments in Wafer Used CVD Equipment
The dominant market for wafer used CVD equipment is currently in Asia, particularly in countries like South Korea, Taiwan, and China, owing to their robust semiconductor manufacturing industries. The North American and European markets also hold substantial shares, though the growth rate is projected to be relatively lower compared to the Asian market.
- Key Growth Drivers in Asia:
- Extensive Semiconductor Manufacturing Infrastructure: The presence of major semiconductor fabrication plants (fabs) provides a large and established market for CVD equipment.
- Government Support and Investment: Government initiatives focused on promoting technological innovation and semiconductor industry growth have stimulated demand for advanced CVD equipment.
- Growing Demand for Consumer Electronics: The high demand for smartphones, computers, and other consumer electronics from the rapidly growing Asian population fuels the need for advanced semiconductor technologies.
Wafer Used CVD Equipment Product Analysis
Recent product innovations in wafer used CVD equipment focus on improving deposition precision, throughput, and process control. This includes advancements in plasma sources, gas delivery systems, and process monitoring technologies. The key competitive advantages lie in superior process control, higher throughput, and reduced operating costs. These advancements enable the production of high-quality semiconductor devices, ensuring market fit for the ever-evolving needs of the semiconductor industry.
Key Drivers, Barriers & Challenges in Wafer Used CVD Equipment
Key Drivers:
Technological advancements driving miniaturization, increasing demand for high-performance semiconductors, and government support for the semiconductor industry are major growth drivers. The shift towards advanced node technologies like 3D NAND and EUV lithography significantly boosts demand for advanced CVD equipment.
Challenges:
- Supply Chain Disruptions: Geopolitical uncertainties and global supply chain bottlenecks can disrupt the availability of critical components for CVD equipment manufacturing, leading to delays and increased costs. Estimated impact on market growth: xx%.
- Regulatory Hurdles: Stringent environmental regulations related to gas emissions and waste disposal impose significant compliance costs on manufacturers, potentially impacting market expansion.
- Intense Competition: The presence of numerous established and emerging players leads to intense price competition and necessitates continuous innovation to maintain market share.
Growth Drivers in the Wafer Used CVD Equipment Market
Increased demand for sophisticated chips in various applications and the continuous miniaturization of semiconductor devices are primary drivers. Government incentives and investments in the semiconductor industry further boost growth.
Challenges Impacting Wafer Used CVD Equipment Growth
Supply chain disruptions, stringent environmental regulations, and intense competition pose significant challenges. These factors can influence production costs, timelines, and market profitability.
Key Players Shaping the Wafer Used CVD Equipment Market
- Applied Materials
- Lam Research
- Tokyo Electron
- ASM International
- Kokusai Electric
- Wonik IPS
- Eugene Technology
- Jusung Engineering
- TES
- SPTS Technologies (KLA)
- Veeco
- CVD Equipment
- Piotech
- NAURA Technology
Significant Wafer Used CVD Equipment Industry Milestones
- 2021-Q3: Applied Materials launches its next-generation CVD system with enhanced process control capabilities.
- 2022-Q1: Lam Research and Tokyo Electron announce a joint venture to develop advanced CVD technologies.
- 2023-Q2: New environmental regulations on gas emissions come into effect, prompting manufacturers to invest in greener technologies. (Specific dates and details will need to be sourced from relevant industry publications).
Future Outlook for Wafer Used CVD Equipment Market
The market is poised for continued growth, driven by the persistent demand for advanced semiconductor devices in diverse applications like 5G, AI, and autonomous vehicles. Opportunities exist for companies that can deliver innovative CVD solutions addressing emerging challenges in process control, throughput, and sustainability. The market is expected to maintain a robust growth trajectory throughout the forecast period.
Wafer Used CVD Equipment Segmentation
-
1. Application
- 1.1. IDM
- 1.2. Foundry
-
2. Types
- 2.1. PECVD
- 2.2. LPCVD
- 2.3. ALD
- 2.4. Others
Wafer Used CVD Equipment Segmentation By Geography
-
1. North America
- 1.1. United States
- 1.2. Canada
- 1.3. Mexico
-
2. South America
- 2.1. Brazil
- 2.2. Argentina
- 2.3. Rest of South America
-
3. Europe
- 3.1. United Kingdom
- 3.2. Germany
- 3.3. France
- 3.4. Italy
- 3.5. Spain
- 3.6. Russia
- 3.7. Benelux
- 3.8. Nordics
- 3.9. Rest of Europe
-
4. Middle East & Africa
- 4.1. Turkey
- 4.2. Israel
- 4.3. GCC
- 4.4. North Africa
- 4.5. South Africa
- 4.6. Rest of Middle East & Africa
-
5. Asia Pacific
- 5.1. China
- 5.2. India
- 5.3. Japan
- 5.4. South Korea
- 5.5. ASEAN
- 5.6. Oceania
- 5.7. Rest of Asia Pacific
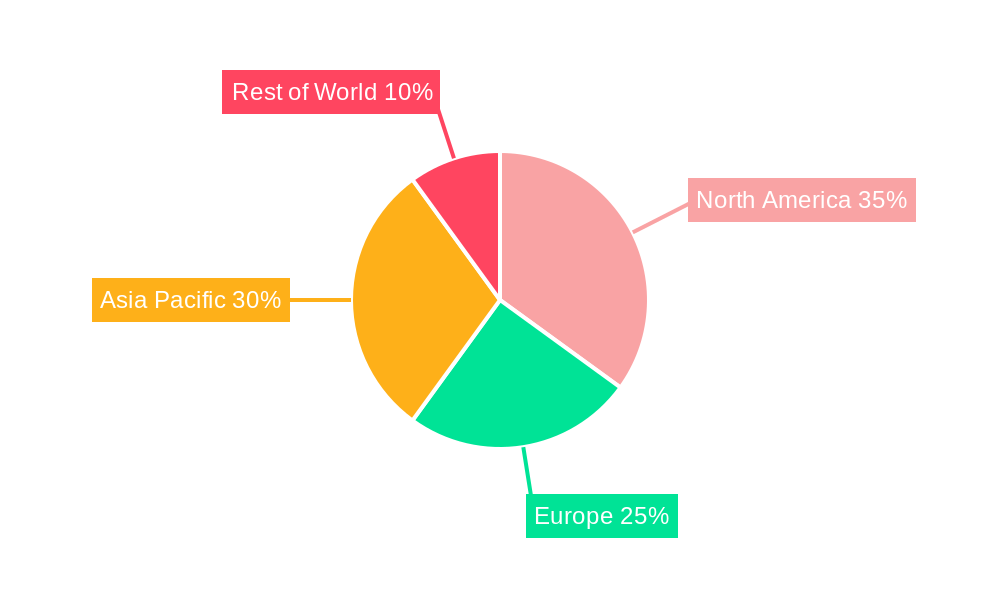
Wafer Used CVD Equipment Regional Market Share
Geographic Coverage of Wafer Used CVD Equipment
Wafer Used CVD Equipment REPORT HIGHLIGHTS
| Aspects | Details |
|---|---|
| Study Period | 2020-2034 |
| Base Year | 2025 |
| Estimated Year | 2026 |
| Forecast Period | 2026-2034 |
| Historical Period | 2020-2025 |
| Growth Rate | CAGR of 5.95% from 2020-2034 |
| Segmentation |
|
Table of Contents
- 1. Introduction
- 1.1. Research Scope
- 1.2. Market Segmentation
- 1.3. Research Objective
- 1.4. Definitions and Assumptions
- 2. Executive Summary
- 2.1. Market Snapshot
- 3. Market Dynamics
- 3.1. Market Drivers
- 3.2. Market Restrains
- 3.3. Market Trends
- 3.4. Market Opportunities
- 4. Market Factor Analysis
- 4.1. Porters Five Forces
- 4.1.1. Bargaining Power of Suppliers
- 4.1.2. Bargaining Power of Buyers
- 4.1.3. Threat of New Entrants
- 4.1.4. Threat of Substitutes
- 4.1.5. Competitive Rivalry
- 4.2. PESTEL analysis
- 4.3. BCG Analysis
- 4.3.1. Stars (High Growth, High Market Share)
- 4.3.2. Cash Cows (Low Growth, High Market Share)
- 4.3.3. Question Mark (High Growth, Low Market Share)
- 4.3.4. Dogs (Low Growth, Low Market Share)
- 4.4. Ansoff Matrix Analysis
- 4.5. Supply Chain Analysis
- 4.6. Regulatory Landscape
- 4.7. Current Market Potential and Opportunity Assessment (TAM–SAM–SOM Framework)
- 4.8. TIR Analyst Note
- 4.1. Porters Five Forces
- 5. Market Analysis, Insights and Forecast 2021-2033
- 5.1. Market Analysis, Insights and Forecast - by Application
- 5.1.1. IDM
- 5.1.2. Foundry
- 5.2. Market Analysis, Insights and Forecast - by Types
- 5.2.1. PECVD
- 5.2.2. LPCVD
- 5.2.3. ALD
- 5.2.4. Others
- 5.3. Market Analysis, Insights and Forecast - by Region
- 5.3.1. North America
- 5.3.2. South America
- 5.3.3. Europe
- 5.3.4. Middle East & Africa
- 5.3.5. Asia Pacific
- 5.1. Market Analysis, Insights and Forecast - by Application
- 6. Global Wafer Used CVD Equipment Analysis, Insights and Forecast, 2021-2033
- 6.1. Market Analysis, Insights and Forecast - by Application
- 6.1.1. IDM
- 6.1.2. Foundry
- 6.2. Market Analysis, Insights and Forecast - by Types
- 6.2.1. PECVD
- 6.2.2. LPCVD
- 6.2.3. ALD
- 6.2.4. Others
- 6.1. Market Analysis, Insights and Forecast - by Application
- 7. North America Wafer Used CVD Equipment Analysis, Insights and Forecast, 2020-2032
- 7.1. Market Analysis, Insights and Forecast - by Application
- 7.1.1. IDM
- 7.1.2. Foundry
- 7.2. Market Analysis, Insights and Forecast - by Types
- 7.2.1. PECVD
- 7.2.2. LPCVD
- 7.2.3. ALD
- 7.2.4. Others
- 7.1. Market Analysis, Insights and Forecast - by Application
- 8. South America Wafer Used CVD Equipment Analysis, Insights and Forecast, 2020-2032
- 8.1. Market Analysis, Insights and Forecast - by Application
- 8.1.1. IDM
- 8.1.2. Foundry
- 8.2. Market Analysis, Insights and Forecast - by Types
- 8.2.1. PECVD
- 8.2.2. LPCVD
- 8.2.3. ALD
- 8.2.4. Others
- 8.1. Market Analysis, Insights and Forecast - by Application
- 9. Europe Wafer Used CVD Equipment Analysis, Insights and Forecast, 2020-2032
- 9.1. Market Analysis, Insights and Forecast - by Application
- 9.1.1. IDM
- 9.1.2. Foundry
- 9.2. Market Analysis, Insights and Forecast - by Types
- 9.2.1. PECVD
- 9.2.2. LPCVD
- 9.2.3. ALD
- 9.2.4. Others
- 9.1. Market Analysis, Insights and Forecast - by Application
- 10. Middle East & Africa Wafer Used CVD Equipment Analysis, Insights and Forecast, 2020-2032
- 10.1. Market Analysis, Insights and Forecast - by Application
- 10.1.1. IDM
- 10.1.2. Foundry
- 10.2. Market Analysis, Insights and Forecast - by Types
- 10.2.1. PECVD
- 10.2.2. LPCVD
- 10.2.3. ALD
- 10.2.4. Others
- 10.1. Market Analysis, Insights and Forecast - by Application
- 11. Asia Pacific Wafer Used CVD Equipment Analysis, Insights and Forecast, 2020-2032
- 11.1. Market Analysis, Insights and Forecast - by Application
- 11.1.1. IDM
- 11.1.2. Foundry
- 11.2. Market Analysis, Insights and Forecast - by Types
- 11.2.1. PECVD
- 11.2.2. LPCVD
- 11.2.3. ALD
- 11.2.4. Others
- 11.1. Market Analysis, Insights and Forecast - by Application
- 12. Competitive Analysis
- 12.1. Company Profiles
- 12.1.1 Applied Materials
- 12.1.1.1. Company Overview
- 12.1.1.2. Products
- 12.1.1.3. Company Financials
- 12.1.1.4. SWOT Analysis
- 12.1.2 Lam Research
- 12.1.2.1. Company Overview
- 12.1.2.2. Products
- 12.1.2.3. Company Financials
- 12.1.2.4. SWOT Analysis
- 12.1.3 Tokyo Electron
- 12.1.3.1. Company Overview
- 12.1.3.2. Products
- 12.1.3.3. Company Financials
- 12.1.3.4. SWOT Analysis
- 12.1.4 ASM International
- 12.1.4.1. Company Overview
- 12.1.4.2. Products
- 12.1.4.3. Company Financials
- 12.1.4.4. SWOT Analysis
- 12.1.5 Kokusai Electric
- 12.1.5.1. Company Overview
- 12.1.5.2. Products
- 12.1.5.3. Company Financials
- 12.1.5.4. SWOT Analysis
- 12.1.6 Wonik IPS
- 12.1.6.1. Company Overview
- 12.1.6.2. Products
- 12.1.6.3. Company Financials
- 12.1.6.4. SWOT Analysis
- 12.1.7 Eugene Technology
- 12.1.7.1. Company Overview
- 12.1.7.2. Products
- 12.1.7.3. Company Financials
- 12.1.7.4. SWOT Analysis
- 12.1.8 Jusung Engineering
- 12.1.8.1. Company Overview
- 12.1.8.2. Products
- 12.1.8.3. Company Financials
- 12.1.8.4. SWOT Analysis
- 12.1.9 TES
- 12.1.9.1. Company Overview
- 12.1.9.2. Products
- 12.1.9.3. Company Financials
- 12.1.9.4. SWOT Analysis
- 12.1.10 SPTS Technologies (KLA)
- 12.1.10.1. Company Overview
- 12.1.10.2. Products
- 12.1.10.3. Company Financials
- 12.1.10.4. SWOT Analysis
- 12.1.11 Veeco
- 12.1.11.1. Company Overview
- 12.1.11.2. Products
- 12.1.11.3. Company Financials
- 12.1.11.4. SWOT Analysis
- 12.1.12 CVD Equipment
- 12.1.12.1. Company Overview
- 12.1.12.2. Products
- 12.1.12.3. Company Financials
- 12.1.12.4. SWOT Analysis
- 12.1.13 Piotech
- 12.1.13.1. Company Overview
- 12.1.13.2. Products
- 12.1.13.3. Company Financials
- 12.1.13.4. SWOT Analysis
- 12.1.14 NAURA Technology
- 12.1.14.1. Company Overview
- 12.1.14.2. Products
- 12.1.14.3. Company Financials
- 12.1.14.4. SWOT Analysis
- 12.1.1 Applied Materials
- 12.2. Market Entropy
- 12.2.1 Company's Key Areas Served
- 12.2.2 Recent Developments
- 12.3. Company Market Share Analysis 2025
- 12.3.1 Top 5 Companies Market Share Analysis
- 12.3.2 Top 3 Companies Market Share Analysis
- 12.4. List of Potential Customers
- 13. Research Methodology
List of Figures
- Figure 1: Global Wafer Used CVD Equipment Revenue Breakdown (billion, %) by Region 2025 & 2033
- Figure 2: North America Wafer Used CVD Equipment Revenue (billion), by Application 2025 & 2033
- Figure 3: North America Wafer Used CVD Equipment Revenue Share (%), by Application 2025 & 2033
- Figure 4: North America Wafer Used CVD Equipment Revenue (billion), by Types 2025 & 2033
- Figure 5: North America Wafer Used CVD Equipment Revenue Share (%), by Types 2025 & 2033
- Figure 6: North America Wafer Used CVD Equipment Revenue (billion), by Country 2025 & 2033
- Figure 7: North America Wafer Used CVD Equipment Revenue Share (%), by Country 2025 & 2033
- Figure 8: South America Wafer Used CVD Equipment Revenue (billion), by Application 2025 & 2033
- Figure 9: South America Wafer Used CVD Equipment Revenue Share (%), by Application 2025 & 2033
- Figure 10: South America Wafer Used CVD Equipment Revenue (billion), by Types 2025 & 2033
- Figure 11: South America Wafer Used CVD Equipment Revenue Share (%), by Types 2025 & 2033
- Figure 12: South America Wafer Used CVD Equipment Revenue (billion), by Country 2025 & 2033
- Figure 13: South America Wafer Used CVD Equipment Revenue Share (%), by Country 2025 & 2033
- Figure 14: Europe Wafer Used CVD Equipment Revenue (billion), by Application 2025 & 2033
- Figure 15: Europe Wafer Used CVD Equipment Revenue Share (%), by Application 2025 & 2033
- Figure 16: Europe Wafer Used CVD Equipment Revenue (billion), by Types 2025 & 2033
- Figure 17: Europe Wafer Used CVD Equipment Revenue Share (%), by Types 2025 & 2033
- Figure 18: Europe Wafer Used CVD Equipment Revenue (billion), by Country 2025 & 2033
- Figure 19: Europe Wafer Used CVD Equipment Revenue Share (%), by Country 2025 & 2033
- Figure 20: Middle East & Africa Wafer Used CVD Equipment Revenue (billion), by Application 2025 & 2033
- Figure 21: Middle East & Africa Wafer Used CVD Equipment Revenue Share (%), by Application 2025 & 2033
- Figure 22: Middle East & Africa Wafer Used CVD Equipment Revenue (billion), by Types 2025 & 2033
- Figure 23: Middle East & Africa Wafer Used CVD Equipment Revenue Share (%), by Types 2025 & 2033
- Figure 24: Middle East & Africa Wafer Used CVD Equipment Revenue (billion), by Country 2025 & 2033
- Figure 25: Middle East & Africa Wafer Used CVD Equipment Revenue Share (%), by Country 2025 & 2033
- Figure 26: Asia Pacific Wafer Used CVD Equipment Revenue (billion), by Application 2025 & 2033
- Figure 27: Asia Pacific Wafer Used CVD Equipment Revenue Share (%), by Application 2025 & 2033
- Figure 28: Asia Pacific Wafer Used CVD Equipment Revenue (billion), by Types 2025 & 2033
- Figure 29: Asia Pacific Wafer Used CVD Equipment Revenue Share (%), by Types 2025 & 2033
- Figure 30: Asia Pacific Wafer Used CVD Equipment Revenue (billion), by Country 2025 & 2033
- Figure 31: Asia Pacific Wafer Used CVD Equipment Revenue Share (%), by Country 2025 & 2033
List of Tables
- Table 1: Global Wafer Used CVD Equipment Revenue billion Forecast, by Application 2020 & 2033
- Table 2: Global Wafer Used CVD Equipment Revenue billion Forecast, by Types 2020 & 2033
- Table 3: Global Wafer Used CVD Equipment Revenue billion Forecast, by Region 2020 & 2033
- Table 4: Global Wafer Used CVD Equipment Revenue billion Forecast, by Application 2020 & 2033
- Table 5: Global Wafer Used CVD Equipment Revenue billion Forecast, by Types 2020 & 2033
- Table 6: Global Wafer Used CVD Equipment Revenue billion Forecast, by Country 2020 & 2033
- Table 7: United States Wafer Used CVD Equipment Revenue (billion) Forecast, by Application 2020 & 2033
- Table 8: Canada Wafer Used CVD Equipment Revenue (billion) Forecast, by Application 2020 & 2033
- Table 9: Mexico Wafer Used CVD Equipment Revenue (billion) Forecast, by Application 2020 & 2033
- Table 10: Global Wafer Used CVD Equipment Revenue billion Forecast, by Application 2020 & 2033
- Table 11: Global Wafer Used CVD Equipment Revenue billion Forecast, by Types 2020 & 2033
- Table 12: Global Wafer Used CVD Equipment Revenue billion Forecast, by Country 2020 & 2033
- Table 13: Brazil Wafer Used CVD Equipment Revenue (billion) Forecast, by Application 2020 & 2033
- Table 14: Argentina Wafer Used CVD Equipment Revenue (billion) Forecast, by Application 2020 & 2033
- Table 15: Rest of South America Wafer Used CVD Equipment Revenue (billion) Forecast, by Application 2020 & 2033
- Table 16: Global Wafer Used CVD Equipment Revenue billion Forecast, by Application 2020 & 2033
- Table 17: Global Wafer Used CVD Equipment Revenue billion Forecast, by Types 2020 & 2033
- Table 18: Global Wafer Used CVD Equipment Revenue billion Forecast, by Country 2020 & 2033
- Table 19: United Kingdom Wafer Used CVD Equipment Revenue (billion) Forecast, by Application 2020 & 2033
- Table 20: Germany Wafer Used CVD Equipment Revenue (billion) Forecast, by Application 2020 & 2033
- Table 21: France Wafer Used CVD Equipment Revenue (billion) Forecast, by Application 2020 & 2033
- Table 22: Italy Wafer Used CVD Equipment Revenue (billion) Forecast, by Application 2020 & 2033
- Table 23: Spain Wafer Used CVD Equipment Revenue (billion) Forecast, by Application 2020 & 2033
- Table 24: Russia Wafer Used CVD Equipment Revenue (billion) Forecast, by Application 2020 & 2033
- Table 25: Benelux Wafer Used CVD Equipment Revenue (billion) Forecast, by Application 2020 & 2033
- Table 26: Nordics Wafer Used CVD Equipment Revenue (billion) Forecast, by Application 2020 & 2033
- Table 27: Rest of Europe Wafer Used CVD Equipment Revenue (billion) Forecast, by Application 2020 & 2033
- Table 28: Global Wafer Used CVD Equipment Revenue billion Forecast, by Application 2020 & 2033
- Table 29: Global Wafer Used CVD Equipment Revenue billion Forecast, by Types 2020 & 2033
- Table 30: Global Wafer Used CVD Equipment Revenue billion Forecast, by Country 2020 & 2033
- Table 31: Turkey Wafer Used CVD Equipment Revenue (billion) Forecast, by Application 2020 & 2033
- Table 32: Israel Wafer Used CVD Equipment Revenue (billion) Forecast, by Application 2020 & 2033
- Table 33: GCC Wafer Used CVD Equipment Revenue (billion) Forecast, by Application 2020 & 2033
- Table 34: North Africa Wafer Used CVD Equipment Revenue (billion) Forecast, by Application 2020 & 2033
- Table 35: South Africa Wafer Used CVD Equipment Revenue (billion) Forecast, by Application 2020 & 2033
- Table 36: Rest of Middle East & Africa Wafer Used CVD Equipment Revenue (billion) Forecast, by Application 2020 & 2033
- Table 37: Global Wafer Used CVD Equipment Revenue billion Forecast, by Application 2020 & 2033
- Table 38: Global Wafer Used CVD Equipment Revenue billion Forecast, by Types 2020 & 2033
- Table 39: Global Wafer Used CVD Equipment Revenue billion Forecast, by Country 2020 & 2033
- Table 40: China Wafer Used CVD Equipment Revenue (billion) Forecast, by Application 2020 & 2033
- Table 41: India Wafer Used CVD Equipment Revenue (billion) Forecast, by Application 2020 & 2033
- Table 42: Japan Wafer Used CVD Equipment Revenue (billion) Forecast, by Application 2020 & 2033
- Table 43: South Korea Wafer Used CVD Equipment Revenue (billion) Forecast, by Application 2020 & 2033
- Table 44: ASEAN Wafer Used CVD Equipment Revenue (billion) Forecast, by Application 2020 & 2033
- Table 45: Oceania Wafer Used CVD Equipment Revenue (billion) Forecast, by Application 2020 & 2033
- Table 46: Rest of Asia Pacific Wafer Used CVD Equipment Revenue (billion) Forecast, by Application 2020 & 2033
Frequently Asked Questions
1. What is the projected Compound Annual Growth Rate (CAGR) of the Wafer Used CVD Equipment?
The projected CAGR is approximately 5.95%.
2. Which companies are prominent players in the Wafer Used CVD Equipment?
Key companies in the market include Applied Materials, Lam Research, Tokyo Electron, ASM International, Kokusai Electric, Wonik IPS, Eugene Technology, Jusung Engineering, TES, SPTS Technologies (KLA), Veeco, CVD Equipment, Piotech, NAURA Technology.
3. What are the main segments of the Wafer Used CVD Equipment?
The market segments include Application, Types.
4. Can you provide details about the market size?
The market size is estimated to be USD 18.03 billion as of 2022.
5. What are some drivers contributing to market growth?
N/A
6. What are the notable trends driving market growth?
N/A
7. Are there any restraints impacting market growth?
N/A
8. Can you provide examples of recent developments in the market?
N/A
9. What pricing options are available for accessing the report?
Pricing options include single-user, multi-user, and enterprise licenses priced at USD 2900.00, USD 4350.00, and USD 5800.00 respectively.
10. Is the market size provided in terms of value or volume?
The market size is provided in terms of value, measured in billion.
11. Are there any specific market keywords associated with the report?
Yes, the market keyword associated with the report is "Wafer Used CVD Equipment," which aids in identifying and referencing the specific market segment covered.
12. How do I determine which pricing option suits my needs best?
The pricing options vary based on user requirements and access needs. Individual users may opt for single-user licenses, while businesses requiring broader access may choose multi-user or enterprise licenses for cost-effective access to the report.
13. Are there any additional resources or data provided in the Wafer Used CVD Equipment report?
While the report offers comprehensive insights, it's advisable to review the specific contents or supplementary materials provided to ascertain if additional resources or data are available.
14. How can I stay updated on further developments or reports in the Wafer Used CVD Equipment?
To stay informed about further developments, trends, and reports in the Wafer Used CVD Equipment, consider subscribing to industry newsletters, following relevant companies and organizations, or regularly checking reputable industry news sources and publications.
Methodology
Step 1 - Identification of Relevant Samples Size from Population Database


Step 2 - Approaches for Defining Global Market Size (Value, Volume* & Price*)

Note*: In applicable scenarios
Step 3 - Data Sources
Primary Research
- Web Analytics
- Survey Reports
- Research Institute
- Latest Research Reports
- Opinion Leaders
Secondary Research
- Annual Reports
- White Paper
- Latest Press Release
- Industry Association
- Paid Database
- Investor Presentations

Step 4 - Data Triangulation
Involves using different sources of information in order to increase the validity of a study
These sources are likely to be stakeholders in a program - participants, other researchers, program staff, other community members, and so on.
Then we put all data in single framework & apply various statistical tools to find out the dynamic on the market.
During the analysis stage, feedback from the stakeholder groups would be compared to determine areas of agreement as well as areas of divergence