

Key Insights
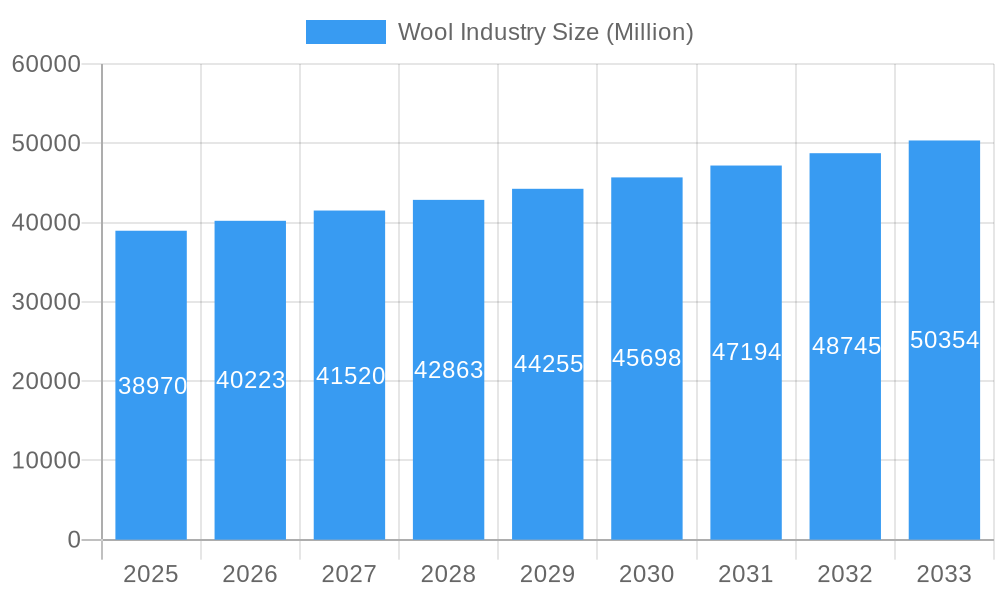
The global wool industry, valued at $38.97 billion in 2025, is projected to experience steady growth, with a compound annual growth rate (CAGR) of 3.20% from 2025 to 2033. This growth is driven by several factors. The increasing demand for sustainable and natural fibers is fueling consumer preference for wool products in apparel, home furnishings, and even industrial applications. The unique properties of wool – its breathability, temperature regulation, and inherent flame retardancy – make it a desirable material across various sectors. Furthermore, advancements in wool processing technologies are leading to the development of innovative wool blends and fabrics with enhanced performance characteristics, further expanding the market. While fluctuating raw material prices and competition from synthetic alternatives pose challenges, ongoing initiatives by organizations like The Woolmark Company and Australian Wool Innovation in promoting wool's sustainability and versatility are mitigating these restraints. The industry's segmentation across knitwear yarn, woven fabrics, and end-use industries (textile and apparel, home furnishings, industrial) provides diversification and resilience against market fluctuations. Growth is expected to be particularly strong in Asia-Pacific, driven by rising disposable incomes and growing demand for premium apparel and home textiles. North America and Europe will continue to be significant markets, albeit with more moderate growth rates.
Wool Industry Market Size (In Billion)
The forecast period of 2025-2033 promises continued expansion for the wool industry, largely dependent on successful marketing efforts that highlight wool's superior qualities and sustainability credentials. Regional variations will exist, influenced by economic growth, consumer preferences, and government policies related to sustainable materials. The industry's continued focus on innovation, particularly in blending wool with other fibers to create high-performance materials, will be crucial for maintaining its competitive edge against synthetic alternatives. Furthermore, proactive engagement with brands and retailers to showcase the versatility and benefits of wool will be key in driving market penetration and achieving the projected growth trajectory. Continued investment in sustainable farming practices and processing technologies will be vital for enhancing the industry's environmental image and overall long-term sustainability.
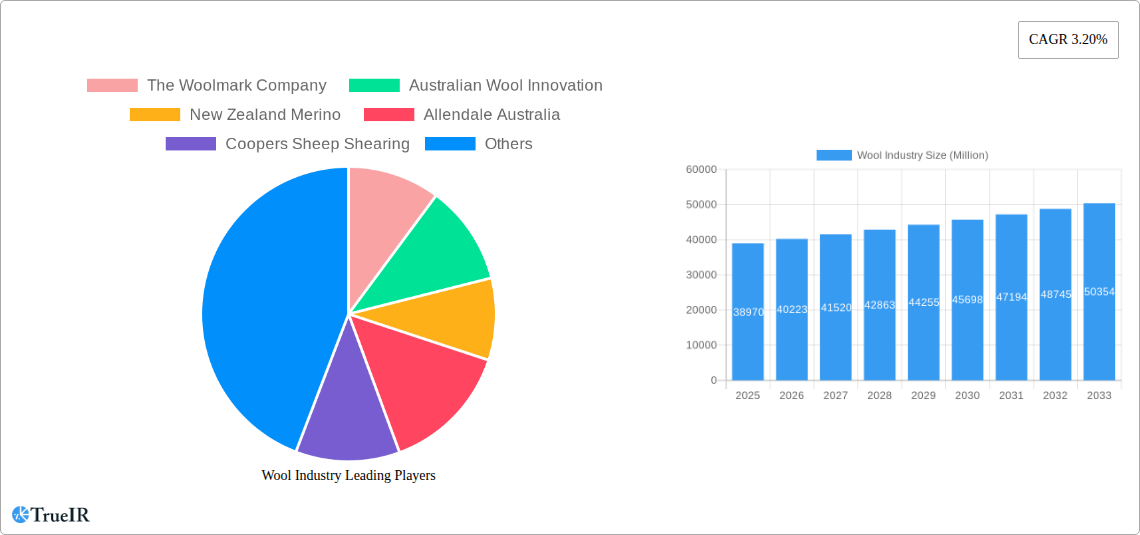
Wool Industry Company Market Share
Dynamic Wool Industry Market Report: 2019-2033
This comprehensive report provides a detailed analysis of the global wool industry, projecting a market value exceeding $XX Million by 2033. It offers invaluable insights for businesses, investors, and policymakers seeking to navigate this dynamic sector. Leveraging extensive data from 2019-2024 (historical period), with 2025 as the base year, this report forecasts market trends until 2033. Key players like The Woolmark Company, Australian Wool Innovation, and New Zealand Merino are thoroughly examined.
Wool Industry Market Structure & Competitive Landscape
The global wool industry exhibits a moderately concentrated market structure, with a few dominant players capturing significant market share. The Herfindahl-Hirschman Index (HHI) for the industry in 2025 is estimated at xx, indicating a moderately concentrated market. Innovation within the industry is primarily driven by improvements in shearing technology, advancements in yarn production, and the development of sustainable practices. Regulatory impacts, such as those related to animal welfare and environmental sustainability, are significant and vary across regions. Competition from synthetic fibers such as polyester and acrylic continues to put pressure on wool demand, particularly in price-sensitive segments. The end-user segmentation is diverse, encompassing textile and apparel, home furnishings, and industrial applications. M&A activity in the sector has been relatively moderate in recent years, with a total transaction value of approximately $xx Million between 2019 and 2024. Future M&A activity is likely to focus on consolidation within the supply chain, particularly in the processing and manufacturing segments.
- Market Concentration: HHI (2025): xx
- Innovation Drivers: Shearing technology, yarn production, sustainable practices.
- Regulatory Impacts: Animal welfare, environmental sustainability.
- Product Substitutes: Polyester, acrylic, other synthetic fibers.
- End-User Segmentation: Textile & Apparel, Home Furnishings, Industrial.
- M&A Activity (2019-2024): ~$xx Million
Wool Industry Market Trends & Opportunities
The global wool market is projected to experience a Compound Annual Growth Rate (CAGR) of xx% during the forecast period (2025-2033), reaching a value exceeding $xx Million by 2033. This growth is fueled by several key trends. Technological advancements in fiber processing and manufacturing are enhancing the quality and performance of wool products. Consumer preferences are shifting towards sustainable and ethically sourced materials, benefiting wool’s natural and renewable attributes. Rising disposable incomes in developing economies are boosting demand for premium apparel and home furnishings. However, competitive pressures from synthetic fibers and fluctuating raw material prices remain significant challenges. Market penetration rates vary widely by segment and region, with the highest penetration observed in established markets with a strong tradition of wool consumption. Specific opportunities exist in developing sustainable and traceable supply chains, leveraging digital technologies to increase efficiency and transparency, and innovating in new wool applications.
Dominant Markets & Segments in Wool Industry
The report identifies [Country/Region X] as the dominant market for wool, driven by strong domestic demand and established supply chains. Other key regional markets include Australia, New Zealand, and China. Within the product type segments, knitwear yarn enjoys significant demand due to its versatility and comfort. In terms of end-use industries, textile and apparel remain the largest consumer of wool, though the home furnishings sector is witnessing growth.
Key Growth Drivers:
- [Country/Region X]: Strong domestic demand, established supply chains, favorable government policies (elaborate on specific policies if available).
- Australia: Extensive sheep farming, established wool processing infrastructure.
- New Zealand: High-quality merino wool production, focus on sustainable practices.
- China: Large consumer base, growing demand for premium wool products.
Market Dominance Analysis: (Paragraph elaborating on the reasons for the dominance of the identified region/country and segments – e.g., infrastructure, consumer preferences, government support, established industry players etc).
Wool Industry Product Analysis
Technological advancements are leading to innovations in wool processing, resulting in improved fiber quality, enhanced performance characteristics, and more sustainable production methods. New applications of wool, particularly in niche markets like technical textiles and sportswear, are driving growth. Wool's inherent properties—such as breathability, moisture-wicking, and thermal regulation—provide a competitive advantage over synthetic materials, particularly in premium segments.
Key Drivers, Barriers & Challenges in Wool Industry
Key Drivers:
- Growing demand for sustainable and natural fibers.
- Technological advancements in fiber processing and manufacturing.
- Rising disposable incomes and consumer preference for premium materials.
Challenges:
- Fluctuating raw material prices and supply chain vulnerabilities.
- Competition from synthetic fibers with lower production costs.
- Environmental concerns related to sheep farming practices. The impact of these challenges is estimated to reduce market growth by approximately xx% by 2033.
Growth Drivers in the Wool Industry Market
The wool industry's growth is primarily driven by increasing demand for sustainable materials, technological advancements leading to higher quality and performance products, and growth in the apparel, home furnishings, and industrial sectors. Government initiatives promoting sustainable practices and supporting wool production further contribute to the sector's expansion.
Challenges Impacting Wool Industry Growth
Significant challenges include competition from synthetic alternatives, price volatility in raw materials, and environmental concerns associated with sheep farming. These factors affect production costs, product pricing, and consumer demand. Supply chain disruptions and regulatory hurdles also contribute to market instability.
Key Players Shaping the Wool Industry Market
- The Woolmark Company
- Australian Wool Innovation
- New Zealand Merino
- Allendale Australia
- Coopers Sheep Shearing
Significant Wool Industry Milestones
- 2020: Launch of a new sustainable wool certification program by [Organization Name].
- 2022: Major investment in wool processing technology by [Company Name].
- 2023: Merger of two key wool producers, resulting in increased market share for the combined entity. (Include further milestones with specific dates and impacts if available)
Future Outlook for Wool Industry Market
The wool industry is poised for continued growth, driven by a renewed focus on sustainability, innovation in product applications, and the growing demand for natural fibers. Strategic opportunities exist in developing high-performance wool products for niche markets, expanding into emerging economies, and strengthening supply chain resilience. The market's long-term potential is considerable, with continued growth expected throughout the forecast period.
Wool Industry Segmentation
- 1. Production Analysis
- 2. Consumption Analysis
- 3. Import Market Analysis (Value & Volume)
- 4. Export Market Analysis (Value & Volume)
- 5. Price Trend Analysis
Wool Industry Segmentation By Geography
-
1. North America
- 1.1. United States
- 1.2. Mexico
-
2. Europe
- 2.1. Germany
- 2.2. Belgium
- 2.3. United Kingdom
- 2.4. Italy
- 2.5. Netherlands
- 2.6. Turkey
-
3. Asia Pacific
- 3.1. China
- 3.2. India
- 3.3. Japan
- 3.4. Australia
- 3.5. New Zealand
-
4. South America
- 4.1. Brazil
- 4.2. Argentina
-
5. Middle East and Africa
- 5.1. UAE
- 5.2. Saudi Arabia
- 5.3. Oman
- 5.4. Morocco
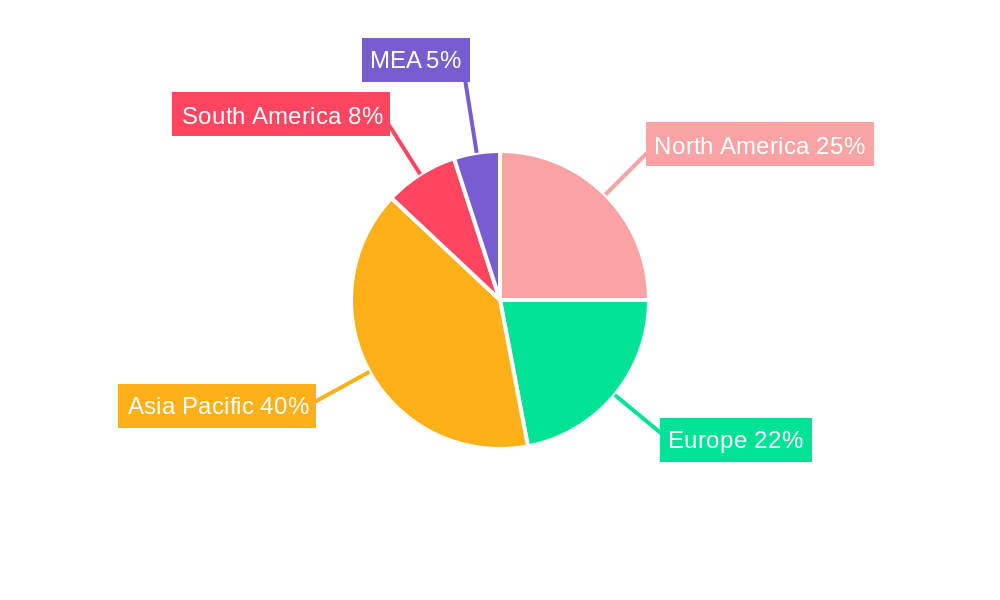
Wool Industry Regional Market Share
Geographic Coverage of Wool Industry
Wool Industry REPORT HIGHLIGHTS
| Aspects | Details |
|---|---|
| Study Period | 2020-2034 |
| Base Year | 2025 |
| Estimated Year | 2026 |
| Forecast Period | 2026-2034 |
| Historical Period | 2020-2025 |
| Growth Rate | CAGR of 3.20% from 2020-2034 |
| Segmentation |
|
Table of Contents
- 1. Introduction
- 1.1. Research Scope
- 1.2. Market Segmentation
- 1.3. Research Objective
- 1.4. Definitions and Assumptions
- 2. Executive Summary
- 2.1. Market Snapshot
- 3. Market Dynamics
- 3.1. Market Drivers
- 3.2. Market Restrains
- 3.3. Market Trends
- 3.4. Market Opportunities
- 4. Market Factor Analysis
- 4.1. Porters Five Forces
- 4.1.1. Bargaining Power of Suppliers
- 4.1.2. Bargaining Power of Buyers
- 4.1.3. Threat of New Entrants
- 4.1.4. Threat of Substitutes
- 4.1.5. Competitive Rivalry
- 4.2. PESTEL analysis
- 4.3. BCG Analysis
- 4.3.1. Stars (High Growth, High Market Share)
- 4.3.2. Cash Cows (Low Growth, High Market Share)
- 4.3.3. Question Mark (High Growth, Low Market Share)
- 4.3.4. Dogs (Low Growth, Low Market Share)
- 4.4. Ansoff Matrix Analysis
- 4.5. Supply Chain Analysis
- 4.6. Regulatory Landscape
- 4.7. Current Market Potential and Opportunity Assessment (TAM–SAM–SOM Framework)
- 4.8. TIR Analyst Note
- 4.1. Porters Five Forces
- 5. Market Analysis, Insights and Forecast 2021-2033
- 5.1. Market Analysis, Insights and Forecast - by Production Analysis
- 5.2. Market Analysis, Insights and Forecast - by Consumption Analysis
- 5.3. Market Analysis, Insights and Forecast - by Import Market Analysis (Value & Volume)
- 5.4. Market Analysis, Insights and Forecast - by Export Market Analysis (Value & Volume)
- 5.5. Market Analysis, Insights and Forecast - by Price Trend Analysis
- 5.6. Market Analysis, Insights and Forecast - by Region
- 5.6.1. North America
- 5.6.2. Europe
- 5.6.3. Asia Pacific
- 5.6.4. South America
- 5.6.5. Middle East and Africa
- 6. Global Wool Industry Analysis, Insights and Forecast, 2021-2033
- 6.1. Market Analysis, Insights and Forecast - by Production Analysis
- 6.2. Market Analysis, Insights and Forecast - by Consumption Analysis
- 6.3. Market Analysis, Insights and Forecast - by Import Market Analysis (Value & Volume)
- 6.4. Market Analysis, Insights and Forecast - by Export Market Analysis (Value & Volume)
- 6.5. Market Analysis, Insights and Forecast - by Price Trend Analysis
- 7. North America Wool Industry Analysis, Insights and Forecast, 2020-2032
- 7.1. Market Analysis, Insights and Forecast - by Production Analysis
- 7.2. Market Analysis, Insights and Forecast - by Consumption Analysis
- 7.3. Market Analysis, Insights and Forecast - by Import Market Analysis (Value & Volume)
- 7.4. Market Analysis, Insights and Forecast - by Export Market Analysis (Value & Volume)
- 7.5. Market Analysis, Insights and Forecast - by Price Trend Analysis
- 8. Europe Wool Industry Analysis, Insights and Forecast, 2020-2032
- 8.1. Market Analysis, Insights and Forecast - by Production Analysis
- 8.2. Market Analysis, Insights and Forecast - by Consumption Analysis
- 8.3. Market Analysis, Insights and Forecast - by Import Market Analysis (Value & Volume)
- 8.4. Market Analysis, Insights and Forecast - by Export Market Analysis (Value & Volume)
- 8.5. Market Analysis, Insights and Forecast - by Price Trend Analysis
- 9. Asia Pacific Wool Industry Analysis, Insights and Forecast, 2020-2032
- 9.1. Market Analysis, Insights and Forecast - by Production Analysis
- 9.2. Market Analysis, Insights and Forecast - by Consumption Analysis
- 9.3. Market Analysis, Insights and Forecast - by Import Market Analysis (Value & Volume)
- 9.4. Market Analysis, Insights and Forecast - by Export Market Analysis (Value & Volume)
- 9.5. Market Analysis, Insights and Forecast - by Price Trend Analysis
- 10. South America Wool Industry Analysis, Insights and Forecast, 2020-2032
- 10.1. Market Analysis, Insights and Forecast - by Production Analysis
- 10.2. Market Analysis, Insights and Forecast - by Consumption Analysis
- 10.3. Market Analysis, Insights and Forecast - by Import Market Analysis (Value & Volume)
- 10.4. Market Analysis, Insights and Forecast - by Export Market Analysis (Value & Volume)
- 10.5. Market Analysis, Insights and Forecast - by Price Trend Analysis
- 11. Middle East and Africa Wool Industry Analysis, Insights and Forecast, 2020-2032
- 11.1. Market Analysis, Insights and Forecast - by Production Analysis
- 11.2. Market Analysis, Insights and Forecast - by Consumption Analysis
- 11.3. Market Analysis, Insights and Forecast - by Import Market Analysis (Value & Volume)
- 11.4. Market Analysis, Insights and Forecast - by Export Market Analysis (Value & Volume)
- 11.5. Market Analysis, Insights and Forecast - by Price Trend Analysis
- 12. Competitive Analysis
- 12.1. Company Profiles
- 12.1.1 The Woolmark Company
- 12.1.1.1. Company Overview
- 12.1.1.2. Products
- 12.1.1.3. Company Financials
- 12.1.1.4. SWOT Analysis
- 12.1.2 Australian Wool Innovation
- 12.1.2.1. Company Overview
- 12.1.2.2. Products
- 12.1.2.3. Company Financials
- 12.1.2.4. SWOT Analysis
- 12.1.3 New Zealand Merino
- 12.1.3.1. Company Overview
- 12.1.3.2. Products
- 12.1.3.3. Company Financials
- 12.1.3.4. SWOT Analysis
- 12.1.4 Allendale Australia
- 12.1.4.1. Company Overview
- 12.1.4.2. Products
- 12.1.4.3. Company Financials
- 12.1.4.4. SWOT Analysis
- 12.1.5 Coopers Sheep Shearing
- 12.1.5.1. Company Overview
- 12.1.5.2. Products
- 12.1.5.3. Company Financials
- 12.1.5.4. SWOT Analysis
- 12.1.1 The Woolmark Company
- 12.2. Market Entropy
- 12.2.1 Company's Key Areas Served
- 12.2.2 Recent Developments
- 12.3. Company Market Share Analysis 2025
- 12.3.1 Top 5 Companies Market Share Analysis
- 12.3.2 Top 3 Companies Market Share Analysis
- 12.4. List of Potential Customers
- 13. Research Methodology
List of Figures
- Figure 1: Global Wool Industry Revenue Breakdown (Million, %) by Region 2025 & 2033
- Figure 2: North America Wool Industry Revenue (Million), by Production Analysis 2025 & 2033
- Figure 3: North America Wool Industry Revenue Share (%), by Production Analysis 2025 & 2033
- Figure 4: North America Wool Industry Revenue (Million), by Consumption Analysis 2025 & 2033
- Figure 5: North America Wool Industry Revenue Share (%), by Consumption Analysis 2025 & 2033
- Figure 6: North America Wool Industry Revenue (Million), by Import Market Analysis (Value & Volume) 2025 & 2033
- Figure 7: North America Wool Industry Revenue Share (%), by Import Market Analysis (Value & Volume) 2025 & 2033
- Figure 8: North America Wool Industry Revenue (Million), by Export Market Analysis (Value & Volume) 2025 & 2033
- Figure 9: North America Wool Industry Revenue Share (%), by Export Market Analysis (Value & Volume) 2025 & 2033
- Figure 10: North America Wool Industry Revenue (Million), by Price Trend Analysis 2025 & 2033
- Figure 11: North America Wool Industry Revenue Share (%), by Price Trend Analysis 2025 & 2033
- Figure 12: North America Wool Industry Revenue (Million), by Country 2025 & 2033
- Figure 13: North America Wool Industry Revenue Share (%), by Country 2025 & 2033
- Figure 14: Europe Wool Industry Revenue (Million), by Production Analysis 2025 & 2033
- Figure 15: Europe Wool Industry Revenue Share (%), by Production Analysis 2025 & 2033
- Figure 16: Europe Wool Industry Revenue (Million), by Consumption Analysis 2025 & 2033
- Figure 17: Europe Wool Industry Revenue Share (%), by Consumption Analysis 2025 & 2033
- Figure 18: Europe Wool Industry Revenue (Million), by Import Market Analysis (Value & Volume) 2025 & 2033
- Figure 19: Europe Wool Industry Revenue Share (%), by Import Market Analysis (Value & Volume) 2025 & 2033
- Figure 20: Europe Wool Industry Revenue (Million), by Export Market Analysis (Value & Volume) 2025 & 2033
- Figure 21: Europe Wool Industry Revenue Share (%), by Export Market Analysis (Value & Volume) 2025 & 2033
- Figure 22: Europe Wool Industry Revenue (Million), by Price Trend Analysis 2025 & 2033
- Figure 23: Europe Wool Industry Revenue Share (%), by Price Trend Analysis 2025 & 2033
- Figure 24: Europe Wool Industry Revenue (Million), by Country 2025 & 2033
- Figure 25: Europe Wool Industry Revenue Share (%), by Country 2025 & 2033
- Figure 26: Asia Pacific Wool Industry Revenue (Million), by Production Analysis 2025 & 2033
- Figure 27: Asia Pacific Wool Industry Revenue Share (%), by Production Analysis 2025 & 2033
- Figure 28: Asia Pacific Wool Industry Revenue (Million), by Consumption Analysis 2025 & 2033
- Figure 29: Asia Pacific Wool Industry Revenue Share (%), by Consumption Analysis 2025 & 2033
- Figure 30: Asia Pacific Wool Industry Revenue (Million), by Import Market Analysis (Value & Volume) 2025 & 2033
- Figure 31: Asia Pacific Wool Industry Revenue Share (%), by Import Market Analysis (Value & Volume) 2025 & 2033
- Figure 32: Asia Pacific Wool Industry Revenue (Million), by Export Market Analysis (Value & Volume) 2025 & 2033
- Figure 33: Asia Pacific Wool Industry Revenue Share (%), by Export Market Analysis (Value & Volume) 2025 & 2033
- Figure 34: Asia Pacific Wool Industry Revenue (Million), by Price Trend Analysis 2025 & 2033
- Figure 35: Asia Pacific Wool Industry Revenue Share (%), by Price Trend Analysis 2025 & 2033
- Figure 36: Asia Pacific Wool Industry Revenue (Million), by Country 2025 & 2033
- Figure 37: Asia Pacific Wool Industry Revenue Share (%), by Country 2025 & 2033
- Figure 38: South America Wool Industry Revenue (Million), by Production Analysis 2025 & 2033
- Figure 39: South America Wool Industry Revenue Share (%), by Production Analysis 2025 & 2033
- Figure 40: South America Wool Industry Revenue (Million), by Consumption Analysis 2025 & 2033
- Figure 41: South America Wool Industry Revenue Share (%), by Consumption Analysis 2025 & 2033
- Figure 42: South America Wool Industry Revenue (Million), by Import Market Analysis (Value & Volume) 2025 & 2033
- Figure 43: South America Wool Industry Revenue Share (%), by Import Market Analysis (Value & Volume) 2025 & 2033
- Figure 44: South America Wool Industry Revenue (Million), by Export Market Analysis (Value & Volume) 2025 & 2033
- Figure 45: South America Wool Industry Revenue Share (%), by Export Market Analysis (Value & Volume) 2025 & 2033
- Figure 46: South America Wool Industry Revenue (Million), by Price Trend Analysis 2025 & 2033
- Figure 47: South America Wool Industry Revenue Share (%), by Price Trend Analysis 2025 & 2033
- Figure 48: South America Wool Industry Revenue (Million), by Country 2025 & 2033
- Figure 49: South America Wool Industry Revenue Share (%), by Country 2025 & 2033
- Figure 50: Middle East and Africa Wool Industry Revenue (Million), by Production Analysis 2025 & 2033
- Figure 51: Middle East and Africa Wool Industry Revenue Share (%), by Production Analysis 2025 & 2033
- Figure 52: Middle East and Africa Wool Industry Revenue (Million), by Consumption Analysis 2025 & 2033
- Figure 53: Middle East and Africa Wool Industry Revenue Share (%), by Consumption Analysis 2025 & 2033
- Figure 54: Middle East and Africa Wool Industry Revenue (Million), by Import Market Analysis (Value & Volume) 2025 & 2033
- Figure 55: Middle East and Africa Wool Industry Revenue Share (%), by Import Market Analysis (Value & Volume) 2025 & 2033
- Figure 56: Middle East and Africa Wool Industry Revenue (Million), by Export Market Analysis (Value & Volume) 2025 & 2033
- Figure 57: Middle East and Africa Wool Industry Revenue Share (%), by Export Market Analysis (Value & Volume) 2025 & 2033
- Figure 58: Middle East and Africa Wool Industry Revenue (Million), by Price Trend Analysis 2025 & 2033
- Figure 59: Middle East and Africa Wool Industry Revenue Share (%), by Price Trend Analysis 2025 & 2033
- Figure 60: Middle East and Africa Wool Industry Revenue (Million), by Country 2025 & 2033
- Figure 61: Middle East and Africa Wool Industry Revenue Share (%), by Country 2025 & 2033
List of Tables
- Table 1: Global Wool Industry Revenue Million Forecast, by Production Analysis 2020 & 2033
- Table 2: Global Wool Industry Revenue Million Forecast, by Consumption Analysis 2020 & 2033
- Table 3: Global Wool Industry Revenue Million Forecast, by Import Market Analysis (Value & Volume) 2020 & 2033
- Table 4: Global Wool Industry Revenue Million Forecast, by Export Market Analysis (Value & Volume) 2020 & 2033
- Table 5: Global Wool Industry Revenue Million Forecast, by Price Trend Analysis 2020 & 2033
- Table 6: Global Wool Industry Revenue Million Forecast, by Region 2020 & 2033
- Table 7: Global Wool Industry Revenue Million Forecast, by Production Analysis 2020 & 2033
- Table 8: Global Wool Industry Revenue Million Forecast, by Consumption Analysis 2020 & 2033
- Table 9: Global Wool Industry Revenue Million Forecast, by Import Market Analysis (Value & Volume) 2020 & 2033
- Table 10: Global Wool Industry Revenue Million Forecast, by Export Market Analysis (Value & Volume) 2020 & 2033
- Table 11: Global Wool Industry Revenue Million Forecast, by Price Trend Analysis 2020 & 2033
- Table 12: Global Wool Industry Revenue Million Forecast, by Country 2020 & 2033
- Table 13: United States Wool Industry Revenue (Million) Forecast, by Application 2020 & 2033
- Table 14: Mexico Wool Industry Revenue (Million) Forecast, by Application 2020 & 2033
- Table 15: Global Wool Industry Revenue Million Forecast, by Production Analysis 2020 & 2033
- Table 16: Global Wool Industry Revenue Million Forecast, by Consumption Analysis 2020 & 2033
- Table 17: Global Wool Industry Revenue Million Forecast, by Import Market Analysis (Value & Volume) 2020 & 2033
- Table 18: Global Wool Industry Revenue Million Forecast, by Export Market Analysis (Value & Volume) 2020 & 2033
- Table 19: Global Wool Industry Revenue Million Forecast, by Price Trend Analysis 2020 & 2033
- Table 20: Global Wool Industry Revenue Million Forecast, by Country 2020 & 2033
- Table 21: Germany Wool Industry Revenue (Million) Forecast, by Application 2020 & 2033
- Table 22: Belgium Wool Industry Revenue (Million) Forecast, by Application 2020 & 2033
- Table 23: United Kingdom Wool Industry Revenue (Million) Forecast, by Application 2020 & 2033
- Table 24: Italy Wool Industry Revenue (Million) Forecast, by Application 2020 & 2033
- Table 25: Netherlands Wool Industry Revenue (Million) Forecast, by Application 2020 & 2033
- Table 26: Turkey Wool Industry Revenue (Million) Forecast, by Application 2020 & 2033
- Table 27: Global Wool Industry Revenue Million Forecast, by Production Analysis 2020 & 2033
- Table 28: Global Wool Industry Revenue Million Forecast, by Consumption Analysis 2020 & 2033
- Table 29: Global Wool Industry Revenue Million Forecast, by Import Market Analysis (Value & Volume) 2020 & 2033
- Table 30: Global Wool Industry Revenue Million Forecast, by Export Market Analysis (Value & Volume) 2020 & 2033
- Table 31: Global Wool Industry Revenue Million Forecast, by Price Trend Analysis 2020 & 2033
- Table 32: Global Wool Industry Revenue Million Forecast, by Country 2020 & 2033
- Table 33: China Wool Industry Revenue (Million) Forecast, by Application 2020 & 2033
- Table 34: India Wool Industry Revenue (Million) Forecast, by Application 2020 & 2033
- Table 35: Japan Wool Industry Revenue (Million) Forecast, by Application 2020 & 2033
- Table 36: Australia Wool Industry Revenue (Million) Forecast, by Application 2020 & 2033
- Table 37: New Zealand Wool Industry Revenue (Million) Forecast, by Application 2020 & 2033
- Table 38: Global Wool Industry Revenue Million Forecast, by Production Analysis 2020 & 2033
- Table 39: Global Wool Industry Revenue Million Forecast, by Consumption Analysis 2020 & 2033
- Table 40: Global Wool Industry Revenue Million Forecast, by Import Market Analysis (Value & Volume) 2020 & 2033
- Table 41: Global Wool Industry Revenue Million Forecast, by Export Market Analysis (Value & Volume) 2020 & 2033
- Table 42: Global Wool Industry Revenue Million Forecast, by Price Trend Analysis 2020 & 2033
- Table 43: Global Wool Industry Revenue Million Forecast, by Country 2020 & 2033
- Table 44: Brazil Wool Industry Revenue (Million) Forecast, by Application 2020 & 2033
- Table 45: Argentina Wool Industry Revenue (Million) Forecast, by Application 2020 & 2033
- Table 46: Global Wool Industry Revenue Million Forecast, by Production Analysis 2020 & 2033
- Table 47: Global Wool Industry Revenue Million Forecast, by Consumption Analysis 2020 & 2033
- Table 48: Global Wool Industry Revenue Million Forecast, by Import Market Analysis (Value & Volume) 2020 & 2033
- Table 49: Global Wool Industry Revenue Million Forecast, by Export Market Analysis (Value & Volume) 2020 & 2033
- Table 50: Global Wool Industry Revenue Million Forecast, by Price Trend Analysis 2020 & 2033
- Table 51: Global Wool Industry Revenue Million Forecast, by Country 2020 & 2033
- Table 52: UAE Wool Industry Revenue (Million) Forecast, by Application 2020 & 2033
- Table 53: Saudi Arabia Wool Industry Revenue (Million) Forecast, by Application 2020 & 2033
- Table 54: Oman Wool Industry Revenue (Million) Forecast, by Application 2020 & 2033
- Table 55: Morocco Wool Industry Revenue (Million) Forecast, by Application 2020 & 2033
Frequently Asked Questions
1. What is the projected Compound Annual Growth Rate (CAGR) of the Wool Industry?
The projected CAGR is approximately 3.20%.
2. Which companies are prominent players in the Wool Industry?
Key companies in the market include The Woolmark Company , Australian Wool Innovation , New Zealand Merino , Allendale Australia , Coopers Sheep Shearing.
3. What are the main segments of the Wool Industry?
The market segments include Production Analysis, Consumption Analysis, Import Market Analysis (Value & Volume), Export Market Analysis (Value & Volume), Price Trend Analysis.
4. Can you provide details about the market size?
The market size is estimated to be USD 38.97 Million as of 2022.
5. What are some drivers contributing to market growth?
; Awareness About Health Benefits Associated With Pecan Consumption; Wide Application of Pecan.
6. What are the notable trends driving market growth?
Institutional Initiatives Ensuring the Quality is Driving the Production.
7. Are there any restraints impacting market growth?
; Volatility in the Prices; Adverse Weather Conditions Affecting Yield.
8. Can you provide examples of recent developments in the market?
N/A
9. What pricing options are available for accessing the report?
Pricing options include single-user, multi-user, and enterprise licenses priced at USD 4750, USD 5250, and USD 8750 respectively.
10. Is the market size provided in terms of value or volume?
The market size is provided in terms of value, measured in Million.
11. Are there any specific market keywords associated with the report?
Yes, the market keyword associated with the report is "Wool Industry," which aids in identifying and referencing the specific market segment covered.
12. How do I determine which pricing option suits my needs best?
The pricing options vary based on user requirements and access needs. Individual users may opt for single-user licenses, while businesses requiring broader access may choose multi-user or enterprise licenses for cost-effective access to the report.
13. Are there any additional resources or data provided in the Wool Industry report?
While the report offers comprehensive insights, it's advisable to review the specific contents or supplementary materials provided to ascertain if additional resources or data are available.
14. How can I stay updated on further developments or reports in the Wool Industry?
To stay informed about further developments, trends, and reports in the Wool Industry, consider subscribing to industry newsletters, following relevant companies and organizations, or regularly checking reputable industry news sources and publications.
Methodology
Step 1 - Identification of Relevant Samples Size from Population Database


Step 2 - Approaches for Defining Global Market Size (Value, Volume* & Price*)

Note*: In applicable scenarios
Step 3 - Data Sources
Primary Research
- Web Analytics
- Survey Reports
- Research Institute
- Latest Research Reports
- Opinion Leaders
Secondary Research
- Annual Reports
- White Paper
- Latest Press Release
- Industry Association
- Paid Database
- Investor Presentations

Step 4 - Data Triangulation
Involves using different sources of information in order to increase the validity of a study
These sources are likely to be stakeholders in a program - participants, other researchers, program staff, other community members, and so on.
Then we put all data in single framework & apply various statistical tools to find out the dynamic on the market.
During the analysis stage, feedback from the stakeholder groups would be compared to determine areas of agreement as well as areas of divergence