

Key Insights
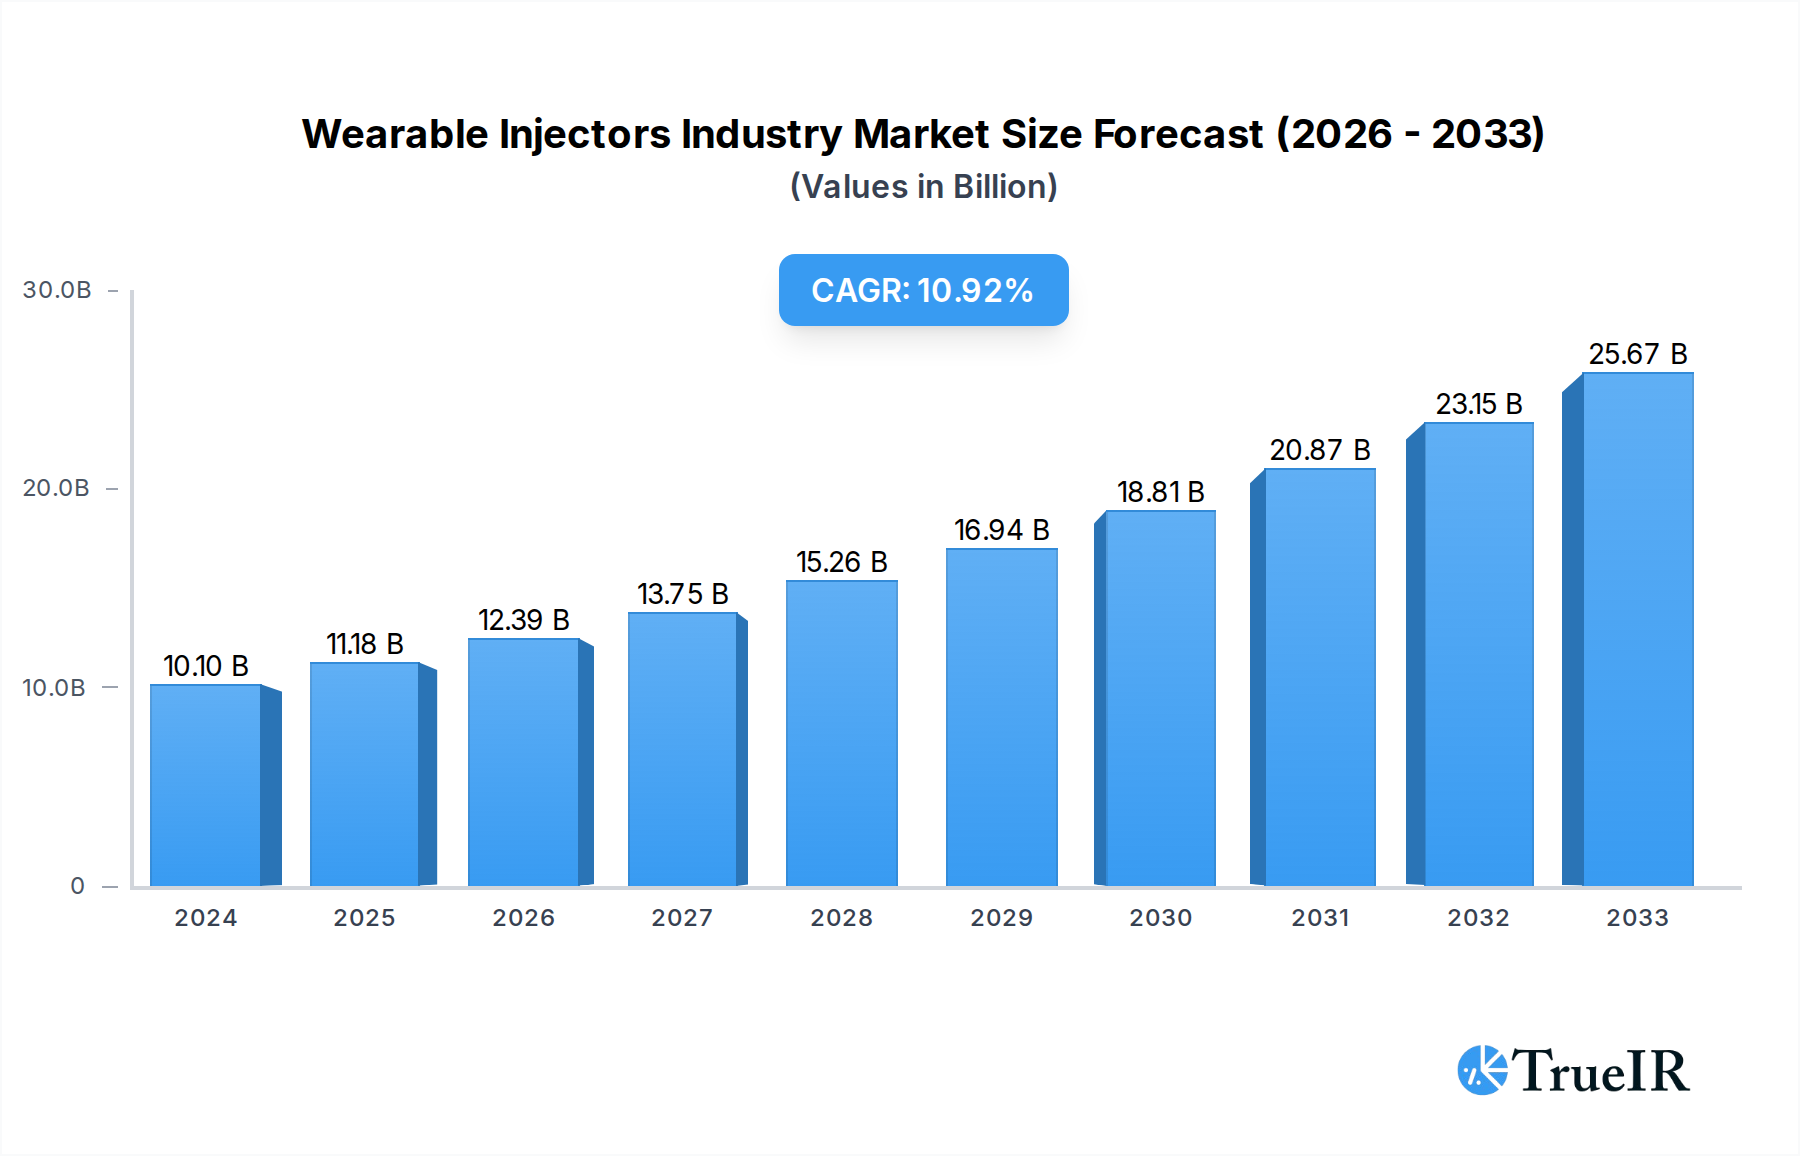
The global Wearable Injectors market is poised for significant expansion, projected to reach an estimated $10.1 billion in 2024, with a robust Compound Annual Growth Rate (CAGR) of 10.6% during the forecast period of 2025-2033. This impressive growth trajectory is fueled by a confluence of escalating chronic disease prevalence, particularly in oncology, autoimmune disorders, and diabetes, alongside a growing patient preference for convenient, at-home treatment solutions. The increasing adoption of advanced drug delivery systems, such as on-body injectors that offer enhanced patient comfort and adherence, and the continuous innovation in device technology, are further propelling market momentum. Major market players are actively investing in research and development to expand their product portfolios and cater to a wider range of therapeutic areas, underscoring the dynamic nature of this sector.

Wearable Injectors Industry Market Size (In Billion)
Despite the promising outlook, the market faces certain restraints, including the high cost of advanced wearable injector devices and the stringent regulatory hurdles associated with drug delivery systems. However, these challenges are increasingly being offset by supportive government initiatives aimed at improving healthcare access and the growing emphasis on personalized medicine, which necessitates sophisticated and patient-friendly drug administration methods. The market is segmented across on-body and off-body injectors, catering to diverse therapeutic needs like oncology, autoimmune diseases, diabetes, and cardiovascular conditions. The end-user landscape is dominated by hospitals and clinics, with a burgeoning segment in home care, reflecting the shift towards decentralized healthcare delivery. Geographically, North America and Europe currently lead the market, but the Asia Pacific region is anticipated to witness substantial growth due to its expanding healthcare infrastructure and increasing disposable incomes.
Wearable Injectors Industry Company Market Share
This in-depth report offers a definitive analysis of the global Wearable Injectors market, a rapidly expanding sector within the pharmaceutical and medical device industries. With a study period spanning from 2019 to 2033, encompassing a historical analysis from 2019-2024, a base and estimated year of 2025, and a detailed forecast for 2025-2033, this report provides unparalleled insights into market dynamics, growth drivers, competitive landscapes, and future opportunities. Expected to surpass billions in value by 2033, the wearable injectors market is revolutionizing drug delivery for chronic and acute conditions, enhancing patient convenience, adherence, and therapeutic outcomes.
The report delves into the intricacies of this dynamic market, leveraging high-volume keywords such as "wearable drug delivery devices," "subcutaneous injection systems," "on-body injectors," "diabetes management devices," "oncology drug delivery," "autoimmune disease treatment," and "biologics administration" to ensure maximum SEO optimization and audience engagement.
Wearable Injectors Industry Market Structure & Competitive Landscape
The global wearable injectors market exhibits a moderately concentrated structure, characterized by the presence of both established multinational corporations and emerging innovative players. Key innovation drivers stem from the relentless pursuit of enhanced patient convenience, reduced injection frequency, and improved therapeutic efficacy for chronic diseases like diabetes, autoimmune disorders, and oncology. Regulatory landscapes, particularly FDA and EMA approvals, significantly impact market entry and product development, fostering a need for robust clinical trial data and stringent quality control. Product substitutes, such as pre-filled syringes and traditional auto-injectors, are gradually being displaced by the superior benefits offered by wearable solutions, including discreetness and ease of use. End-user segmentation reveals a strong shift towards home care settings, driven by the desire for greater patient autonomy and reduced healthcare facility visits. Mergers and acquisitions (M&A) activity is a notable trend, with larger companies acquiring innovative startups to expand their product portfolios and technological capabilities. For instance, M&A volumes have shown a consistent upward trend in the last five years, with an estimated XX billion in deals. Concentration ratios (CR4) are projected to be around XX%, indicating a competitive yet consolidated market.
- Market Concentration: Moderately concentrated with key players holding significant market share.
- Innovation Drivers: Patient convenience, improved adherence, enhanced therapeutic outcomes, miniaturization, and smart features.
- Regulatory Impacts: Stringent approval processes by global health authorities (e.g., FDA, EMA) influencing product development cycles and market access.
- Product Substitutes: Gradual replacement by wearable devices due to superior ease of use and discreetness compared to traditional syringes and auto-injectors.
- End-User Segmentation: Growing dominance of home care settings, driven by patient preference for self-administration.
- M&A Trends: Active M&A landscape as companies seek to acquire innovative technologies and expand market reach.
Wearable Injectors Industry Market Trends & Opportunities
The global wearable injectors market is poised for substantial growth, projected to expand at a Compound Annual Growth Rate (CAGR) of XX% from 2025 to 2033, reaching an estimated market size of billions. This robust expansion is fueled by an escalating prevalence of chronic diseases such as diabetes, autoimmune conditions, and certain cancers, necessitating more convenient and effective drug delivery methods. Technological advancements are at the forefront of this trend, with a significant shift towards miniaturized, connected, and intelligent wearable devices. These innovations include smart sensors for real-time monitoring of drug delivery, personalized dosing capabilities, and seamless integration with digital health platforms, enhancing patient engagement and treatment adherence. Consumer preferences are increasingly leaning towards self-administered solutions that offer greater autonomy and reduce the burden of frequent clinic visits. The rise of biologics and biosimilars, which often require subcutaneous administration, further bolsters the demand for advanced wearable injection technologies. Opportunities abound for companies focusing on the development of user-friendly interfaces, extended wear times, and adaptable delivery systems for a wide range of therapeutic molecules. The market penetration rate for wearable injectors, currently at an estimated XX%, is expected to witness significant augmentation as awareness and adoption grow.
Dominant Markets & Segments in Wearable Injectors Industry
North America currently holds the dominant position in the global wearable injectors market, driven by a well-established healthcare infrastructure, high prevalence of chronic diseases, and early adoption of advanced medical technologies. The United States, in particular, represents a significant market share owing to robust reimbursement policies and a strong presence of key industry players. Among the various segments, On-Body Injectors are leading the market due to their ability to deliver larger volumes of medication and provide extended infusion times, crucial for therapies like oncology and autoimmune diseases.
- Leading Region: North America, specifically the United States, owing to advanced healthcare infrastructure and high adoption of medical technology.
- Dominant Segment (Type): On-Body Injectors are experiencing the highest demand due to their suitability for chronic disease management and delivery of larger drug volumes.
- Key Growth Drivers:
- Technological advancements enabling continuous drug delivery for complex therapies.
- Increasing demand for patient-friendly and discreet drug administration solutions.
- Growing pipeline of biologics requiring subcutaneous administration.
- Key Growth Drivers:
- Dominant Segment (Therapy): Diabetes remains a cornerstone therapy driving the wearable injectors market, given the widespread need for continuous insulin delivery. However, Autoimmune Disease and Oncology are rapidly emerging as significant growth areas.
- Key Growth Drivers:
- Rising incidence of autoimmune disorders like rheumatoid arthritis and inflammatory bowel disease.
- Advancements in targeted cancer therapies requiring precise subcutaneous administration.
- Development of novel biologics for a wide range of chronic conditions.
- Key Growth Drivers:
- Dominant Segment (End User): Home Care settings are increasingly becoming the primary end-user of wearable injectors, reflecting a global trend towards decentralized healthcare and patient empowerment.
- Key Growth Drivers:
- Patient preference for convenience, comfort, and independence.
- Reduced healthcare costs associated with hospitalizations and clinic visits.
- Technological advancements enabling safe and effective self-administration.
- Key Growth Drivers:
Wearable Injectors Industry Product Analysis
Product innovations in the wearable injectors market are characterized by a strong focus on enhancing user experience and therapeutic efficacy. Companies are developing sophisticated on-body and off-body injector systems that offer discreet, painless, and convenient drug delivery. Key advancements include miniaturization, improved drug compatibility, extended wear times, and integration with smart connectivity features for data logging and remote monitoring. These products are crucial for administering biologics, complex molecules, and therapies requiring frequent or continuous subcutaneous administration, thereby offering competitive advantages through improved patient adherence and treatment outcomes.
Key Drivers, Barriers & Challenges in Wearable Injectors Industry
The wearable injectors industry is propelled by several key drivers, including the increasing prevalence of chronic diseases, advancements in drug delivery technologies, a growing demand for patient-centric solutions, and the rising adoption of biologics. Technological innovation, such as smart connected devices and miniaturization, is a significant economic factor. Supportive regulatory frameworks and favorable reimbursement policies also contribute to market growth.
However, the industry faces substantial challenges. High development and manufacturing costs can pose a barrier to entry. Stringent regulatory hurdles and the need for extensive clinical trials for novel drug delivery systems create significant time and financial constraints. Reimbursement complexities and the need for physician and patient education regarding the benefits and proper usage of these advanced devices also present hurdles.
Growth Drivers in the Wearable Injectors Industry Market
The growth of the wearable injectors market is significantly influenced by the increasing global burden of chronic diseases such as diabetes, autoimmune disorders, and oncology, which necessitate convenient and effective drug administration. Technological advancements, including miniaturization, smart connectivity for real-time monitoring, and improved drug compatibility, are pivotal in driving innovation and adoption. The rising preference for patient-centric, at-home treatment solutions further fuels demand. Furthermore, the expansion of the biologics and biosimilars market, which often requires subcutaneous administration, creates substantial opportunities for wearable injector manufacturers.
Challenges Impacting Wearable Injectors Industry Growth
Despite the promising outlook, the wearable injectors industry faces several challenges. The high cost associated with the research, development, and manufacturing of these sophisticated medical devices can be a significant barrier, impacting affordability. Navigating complex and evolving regulatory landscapes across different geographies requires substantial investment and time. Supply chain disruptions, particularly for specialized components, can impede production and timely market delivery. Intense competitive pressures from established pharmaceutical and medical device companies, as well as emerging innovators, necessitate continuous product differentiation and market penetration strategies.
Key Players Shaping the Wearable Injectors Industry Market
- Becton Dickinson and Company
- West Pharmaceutical Services inc
- Ypsomed
- Buhler motor gmbh
- Amgen Inc
- Sensile Medical
- Dexcom Inc
- Insulet Corporation
- Tandem Diabetes Care Inc
- Eitan Medical
- Stevanato Group
- Enable Injections
- United Therapeutics (Steadymed Therapeutics)
Significant Wearable Injectors Industry Industry Milestones
- June 2022: AbbVie received US FDA approval for SKYRIZI (risankizumab-rzaa) as the first and only specific interleukin-23 (IL-23) inhibitor for the treatment of adults with moderately to severely active Crohn's disease (CD). It can be self-administered by Subcutaneous Injection (SC) with an On-Body Injector (OBI), showcasing the growing utility of wearable devices in advanced therapy delivery.
- February 2022: Enable Injections raised a USD 215 million round to fund work on the subcutaneous drug delivery system enFuse. The device consists of a wearable delivery disc and a system for transferring the drug from its original vessel, highlighting significant investment and progress in wearable drug delivery technology.
Future Outlook for Wearable Injectors Industry Market
The future of the wearable injectors market is exceptionally bright, driven by ongoing technological advancements and an increasing demand for personalized, convenient drug delivery. Strategic opportunities lie in the development of integrated digital health solutions that offer enhanced patient monitoring and data analytics, as well as in expanding the therapeutic applications of wearable injectors to cover a broader spectrum of chronic and acute conditions. The market potential is immense, as wearable devices are set to redefine patient care by improving adherence, reducing healthcare burdens, and ultimately enhancing the quality of life for millions globally.
Wearable Injectors Industry Segmentation
-
1. Type
- 1.1. On-Body Injectors
- 1.2. Off-Body Injectors
-
2. Therapy
- 2.1. Oncology
- 2.2. Autoimmune Disease
- 2.3. Diabetes
- 2.4. Cardiovascular Disease
- 2.5. Others
-
3. End User
- 3.1. Hospitals and Clinics
- 3.2. Home Care
- 3.3. Others
Wearable Injectors Industry Segmentation By Geography
-
1. North America
- 1.1. United States
- 1.2. Canada
- 1.3. Mexico
-
2. Europe
- 2.1. Germany
- 2.2. United Kingdom
- 2.3. France
- 2.4. Italy
- 2.5. Spain
- 2.6. Rest of Europe
-
3. Asia Pacific
- 3.1. China
- 3.2. Japan
- 3.3. India
- 3.4. Australia
- 3.5. South Korea
- 3.6. Rest of Asia Pacific
-
4. Middle East and Africa
- 4.1. GCC
- 4.2. South Africa
- 4.3. Rest of Middle East and Africa
-
5. South America
- 5.1. Brazil
- 5.2. Argentina
- 5.3. Rest of South America

Wearable Injectors Industry Regional Market Share
Geographic Coverage of Wearable Injectors Industry
Wearable Injectors Industry REPORT HIGHLIGHTS
| Aspects | Details |
|---|---|
| Study Period | 2020-2034 |
| Base Year | 2025 |
| Estimated Year | 2026 |
| Forecast Period | 2026-2034 |
| Historical Period | 2020-2025 |
| Growth Rate | CAGR of 10.6% from 2020-2034 |
| Segmentation |
|
Table of Contents
- 1. Introduction
- 1.1. Research Scope
- 1.2. Market Segmentation
- 1.3. Research Objective
- 1.4. Definitions and Assumptions
- 2. Executive Summary
- 2.1. Market Snapshot
- 3. Market Dynamics
- 3.1. Market Drivers
- 3.2. Market Restrains
- 3.3. Market Trends
- 3.4. Market Opportunities
- 4. Market Factor Analysis
- 4.1. Porters Five Forces
- 4.1.1. Bargaining Power of Suppliers
- 4.1.2. Bargaining Power of Buyers
- 4.1.3. Threat of New Entrants
- 4.1.4. Threat of Substitutes
- 4.1.5. Competitive Rivalry
- 4.2. PESTEL analysis
- 4.3. BCG Analysis
- 4.3.1. Stars (High Growth, High Market Share)
- 4.3.2. Cash Cows (Low Growth, High Market Share)
- 4.3.3. Question Mark (High Growth, Low Market Share)
- 4.3.4. Dogs (Low Growth, Low Market Share)
- 4.4. Ansoff Matrix Analysis
- 4.5. Supply Chain Analysis
- 4.6. Regulatory Landscape
- 4.7. Current Market Potential and Opportunity Assessment (TAM–SAM–SOM Framework)
- 4.8. TIR Analyst Note
- 4.1. Porters Five Forces
- 5. Market Analysis, Insights and Forecast 2021-2033
- 5.1. Market Analysis, Insights and Forecast - by Type
- 5.1.1. On-Body Injectors
- 5.1.2. Off-Body Injectors
- 5.2. Market Analysis, Insights and Forecast - by Therapy
- 5.2.1. Oncology
- 5.2.2. Autoimmune Disease
- 5.2.3. Diabetes
- 5.2.4. Cardiovascular Disease
- 5.2.5. Others
- 5.3. Market Analysis, Insights and Forecast - by End User
- 5.3.1. Hospitals and Clinics
- 5.3.2. Home Care
- 5.3.3. Others
- 5.4. Market Analysis, Insights and Forecast - by Region
- 5.4.1. North America
- 5.4.2. Europe
- 5.4.3. Asia Pacific
- 5.4.4. Middle East and Africa
- 5.4.5. South America
- 5.1. Market Analysis, Insights and Forecast - by Type
- 6. Global Wearable Injectors Industry Analysis, Insights and Forecast, 2021-2033
- 6.1. Market Analysis, Insights and Forecast - by Type
- 6.1.1. On-Body Injectors
- 6.1.2. Off-Body Injectors
- 6.2. Market Analysis, Insights and Forecast - by Therapy
- 6.2.1. Oncology
- 6.2.2. Autoimmune Disease
- 6.2.3. Diabetes
- 6.2.4. Cardiovascular Disease
- 6.2.5. Others
- 6.3. Market Analysis, Insights and Forecast - by End User
- 6.3.1. Hospitals and Clinics
- 6.3.2. Home Care
- 6.3.3. Others
- 6.1. Market Analysis, Insights and Forecast - by Type
- 7. North America Wearable Injectors Industry Analysis, Insights and Forecast, 2020-2032
- 7.1. Market Analysis, Insights and Forecast - by Type
- 7.1.1. On-Body Injectors
- 7.1.2. Off-Body Injectors
- 7.2. Market Analysis, Insights and Forecast - by Therapy
- 7.2.1. Oncology
- 7.2.2. Autoimmune Disease
- 7.2.3. Diabetes
- 7.2.4. Cardiovascular Disease
- 7.2.5. Others
- 7.3. Market Analysis, Insights and Forecast - by End User
- 7.3.1. Hospitals and Clinics
- 7.3.2. Home Care
- 7.3.3. Others
- 7.1. Market Analysis, Insights and Forecast - by Type
- 8. Europe Wearable Injectors Industry Analysis, Insights and Forecast, 2020-2032
- 8.1. Market Analysis, Insights and Forecast - by Type
- 8.1.1. On-Body Injectors
- 8.1.2. Off-Body Injectors
- 8.2. Market Analysis, Insights and Forecast - by Therapy
- 8.2.1. Oncology
- 8.2.2. Autoimmune Disease
- 8.2.3. Diabetes
- 8.2.4. Cardiovascular Disease
- 8.2.5. Others
- 8.3. Market Analysis, Insights and Forecast - by End User
- 8.3.1. Hospitals and Clinics
- 8.3.2. Home Care
- 8.3.3. Others
- 8.1. Market Analysis, Insights and Forecast - by Type
- 9. Asia Pacific Wearable Injectors Industry Analysis, Insights and Forecast, 2020-2032
- 9.1. Market Analysis, Insights and Forecast - by Type
- 9.1.1. On-Body Injectors
- 9.1.2. Off-Body Injectors
- 9.2. Market Analysis, Insights and Forecast - by Therapy
- 9.2.1. Oncology
- 9.2.2. Autoimmune Disease
- 9.2.3. Diabetes
- 9.2.4. Cardiovascular Disease
- 9.2.5. Others
- 9.3. Market Analysis, Insights and Forecast - by End User
- 9.3.1. Hospitals and Clinics
- 9.3.2. Home Care
- 9.3.3. Others
- 9.1. Market Analysis, Insights and Forecast - by Type
- 10. Middle East and Africa Wearable Injectors Industry Analysis, Insights and Forecast, 2020-2032
- 10.1. Market Analysis, Insights and Forecast - by Type
- 10.1.1. On-Body Injectors
- 10.1.2. Off-Body Injectors
- 10.2. Market Analysis, Insights and Forecast - by Therapy
- 10.2.1. Oncology
- 10.2.2. Autoimmune Disease
- 10.2.3. Diabetes
- 10.2.4. Cardiovascular Disease
- 10.2.5. Others
- 10.3. Market Analysis, Insights and Forecast - by End User
- 10.3.1. Hospitals and Clinics
- 10.3.2. Home Care
- 10.3.3. Others
- 10.1. Market Analysis, Insights and Forecast - by Type
- 11. South America Wearable Injectors Industry Analysis, Insights and Forecast, 2020-2032
- 11.1. Market Analysis, Insights and Forecast - by Type
- 11.1.1. On-Body Injectors
- 11.1.2. Off-Body Injectors
- 11.2. Market Analysis, Insights and Forecast - by Therapy
- 11.2.1. Oncology
- 11.2.2. Autoimmune Disease
- 11.2.3. Diabetes
- 11.2.4. Cardiovascular Disease
- 11.2.5. Others
- 11.3. Market Analysis, Insights and Forecast - by End User
- 11.3.1. Hospitals and Clinics
- 11.3.2. Home Care
- 11.3.3. Others
- 11.1. Market Analysis, Insights and Forecast - by Type
- 12. Competitive Analysis
- 12.1. Company Profiles
- 12.1.1 Becton Dickinson and Company
- 12.1.1.1. Company Overview
- 12.1.1.2. Products
- 12.1.1.3. Company Financials
- 12.1.1.4. SWOT Analysis
- 12.1.2 West Pharmaceutical Services inc
- 12.1.2.1. Company Overview
- 12.1.2.2. Products
- 12.1.2.3. Company Financials
- 12.1.2.4. SWOT Analysis
- 12.1.3 Ypsomed
- 12.1.3.1. Company Overview
- 12.1.3.2. Products
- 12.1.3.3. Company Financials
- 12.1.3.4. SWOT Analysis
- 12.1.4 Buhler motor gmbh
- 12.1.4.1. Company Overview
- 12.1.4.2. Products
- 12.1.4.3. Company Financials
- 12.1.4.4. SWOT Analysis
- 12.1.5 Amgen Inc
- 12.1.5.1. Company Overview
- 12.1.5.2. Products
- 12.1.5.3. Company Financials
- 12.1.5.4. SWOT Analysis
- 12.1.6 Sensile Medical
- 12.1.6.1. Company Overview
- 12.1.6.2. Products
- 12.1.6.3. Company Financials
- 12.1.6.4. SWOT Analysis
- 12.1.7 Dexcom Inc
- 12.1.7.1. Company Overview
- 12.1.7.2. Products
- 12.1.7.3. Company Financials
- 12.1.7.4. SWOT Analysis
- 12.1.8 Insulet Corporation
- 12.1.8.1. Company Overview
- 12.1.8.2. Products
- 12.1.8.3. Company Financials
- 12.1.8.4. SWOT Analysis
- 12.1.9 Tandem Diabetes Care Inc
- 12.1.9.1. Company Overview
- 12.1.9.2. Products
- 12.1.9.3. Company Financials
- 12.1.9.4. SWOT Analysis
- 12.1.10 Eitan Medical
- 12.1.10.1. Company Overview
- 12.1.10.2. Products
- 12.1.10.3. Company Financials
- 12.1.10.4. SWOT Analysis
- 12.1.11 Stevanato Group
- 12.1.11.1. Company Overview
- 12.1.11.2. Products
- 12.1.11.3. Company Financials
- 12.1.11.4. SWOT Analysis
- 12.1.12 Enable Injections
- 12.1.12.1. Company Overview
- 12.1.12.2. Products
- 12.1.12.3. Company Financials
- 12.1.12.4. SWOT Analysis
- 12.1.13 United Therapeutics (Steadymed Therapeutics)
- 12.1.13.1. Company Overview
- 12.1.13.2. Products
- 12.1.13.3. Company Financials
- 12.1.13.4. SWOT Analysis
- 12.1.1 Becton Dickinson and Company
- 12.2. Market Entropy
- 12.2.1 Company's Key Areas Served
- 12.2.2 Recent Developments
- 12.3. Company Market Share Analysis 2025
- 12.3.1 Top 5 Companies Market Share Analysis
- 12.3.2 Top 3 Companies Market Share Analysis
- 12.4. List of Potential Customers
- 13. Research Methodology
List of Figures
- Figure 1: Global Wearable Injectors Industry Revenue Breakdown (billion, %) by Region 2025 & 2033
- Figure 2: Global Wearable Injectors Industry Volume Breakdown (K Unit, %) by Region 2025 & 2033
- Figure 3: North America Wearable Injectors Industry Revenue (billion), by Type 2025 & 2033
- Figure 4: North America Wearable Injectors Industry Volume (K Unit), by Type 2025 & 2033
- Figure 5: North America Wearable Injectors Industry Revenue Share (%), by Type 2025 & 2033
- Figure 6: North America Wearable Injectors Industry Volume Share (%), by Type 2025 & 2033
- Figure 7: North America Wearable Injectors Industry Revenue (billion), by Therapy 2025 & 2033
- Figure 8: North America Wearable Injectors Industry Volume (K Unit), by Therapy 2025 & 2033
- Figure 9: North America Wearable Injectors Industry Revenue Share (%), by Therapy 2025 & 2033
- Figure 10: North America Wearable Injectors Industry Volume Share (%), by Therapy 2025 & 2033
- Figure 11: North America Wearable Injectors Industry Revenue (billion), by End User 2025 & 2033
- Figure 12: North America Wearable Injectors Industry Volume (K Unit), by End User 2025 & 2033
- Figure 13: North America Wearable Injectors Industry Revenue Share (%), by End User 2025 & 2033
- Figure 14: North America Wearable Injectors Industry Volume Share (%), by End User 2025 & 2033
- Figure 15: North America Wearable Injectors Industry Revenue (billion), by Country 2025 & 2033
- Figure 16: North America Wearable Injectors Industry Volume (K Unit), by Country 2025 & 2033
- Figure 17: North America Wearable Injectors Industry Revenue Share (%), by Country 2025 & 2033
- Figure 18: North America Wearable Injectors Industry Volume Share (%), by Country 2025 & 2033
- Figure 19: Europe Wearable Injectors Industry Revenue (billion), by Type 2025 & 2033
- Figure 20: Europe Wearable Injectors Industry Volume (K Unit), by Type 2025 & 2033
- Figure 21: Europe Wearable Injectors Industry Revenue Share (%), by Type 2025 & 2033
- Figure 22: Europe Wearable Injectors Industry Volume Share (%), by Type 2025 & 2033
- Figure 23: Europe Wearable Injectors Industry Revenue (billion), by Therapy 2025 & 2033
- Figure 24: Europe Wearable Injectors Industry Volume (K Unit), by Therapy 2025 & 2033
- Figure 25: Europe Wearable Injectors Industry Revenue Share (%), by Therapy 2025 & 2033
- Figure 26: Europe Wearable Injectors Industry Volume Share (%), by Therapy 2025 & 2033
- Figure 27: Europe Wearable Injectors Industry Revenue (billion), by End User 2025 & 2033
- Figure 28: Europe Wearable Injectors Industry Volume (K Unit), by End User 2025 & 2033
- Figure 29: Europe Wearable Injectors Industry Revenue Share (%), by End User 2025 & 2033
- Figure 30: Europe Wearable Injectors Industry Volume Share (%), by End User 2025 & 2033
- Figure 31: Europe Wearable Injectors Industry Revenue (billion), by Country 2025 & 2033
- Figure 32: Europe Wearable Injectors Industry Volume (K Unit), by Country 2025 & 2033
- Figure 33: Europe Wearable Injectors Industry Revenue Share (%), by Country 2025 & 2033
- Figure 34: Europe Wearable Injectors Industry Volume Share (%), by Country 2025 & 2033
- Figure 35: Asia Pacific Wearable Injectors Industry Revenue (billion), by Type 2025 & 2033
- Figure 36: Asia Pacific Wearable Injectors Industry Volume (K Unit), by Type 2025 & 2033
- Figure 37: Asia Pacific Wearable Injectors Industry Revenue Share (%), by Type 2025 & 2033
- Figure 38: Asia Pacific Wearable Injectors Industry Volume Share (%), by Type 2025 & 2033
- Figure 39: Asia Pacific Wearable Injectors Industry Revenue (billion), by Therapy 2025 & 2033
- Figure 40: Asia Pacific Wearable Injectors Industry Volume (K Unit), by Therapy 2025 & 2033
- Figure 41: Asia Pacific Wearable Injectors Industry Revenue Share (%), by Therapy 2025 & 2033
- Figure 42: Asia Pacific Wearable Injectors Industry Volume Share (%), by Therapy 2025 & 2033
- Figure 43: Asia Pacific Wearable Injectors Industry Revenue (billion), by End User 2025 & 2033
- Figure 44: Asia Pacific Wearable Injectors Industry Volume (K Unit), by End User 2025 & 2033
- Figure 45: Asia Pacific Wearable Injectors Industry Revenue Share (%), by End User 2025 & 2033
- Figure 46: Asia Pacific Wearable Injectors Industry Volume Share (%), by End User 2025 & 2033
- Figure 47: Asia Pacific Wearable Injectors Industry Revenue (billion), by Country 2025 & 2033
- Figure 48: Asia Pacific Wearable Injectors Industry Volume (K Unit), by Country 2025 & 2033
- Figure 49: Asia Pacific Wearable Injectors Industry Revenue Share (%), by Country 2025 & 2033
- Figure 50: Asia Pacific Wearable Injectors Industry Volume Share (%), by Country 2025 & 2033
- Figure 51: Middle East and Africa Wearable Injectors Industry Revenue (billion), by Type 2025 & 2033
- Figure 52: Middle East and Africa Wearable Injectors Industry Volume (K Unit), by Type 2025 & 2033
- Figure 53: Middle East and Africa Wearable Injectors Industry Revenue Share (%), by Type 2025 & 2033
- Figure 54: Middle East and Africa Wearable Injectors Industry Volume Share (%), by Type 2025 & 2033
- Figure 55: Middle East and Africa Wearable Injectors Industry Revenue (billion), by Therapy 2025 & 2033
- Figure 56: Middle East and Africa Wearable Injectors Industry Volume (K Unit), by Therapy 2025 & 2033
- Figure 57: Middle East and Africa Wearable Injectors Industry Revenue Share (%), by Therapy 2025 & 2033
- Figure 58: Middle East and Africa Wearable Injectors Industry Volume Share (%), by Therapy 2025 & 2033
- Figure 59: Middle East and Africa Wearable Injectors Industry Revenue (billion), by End User 2025 & 2033
- Figure 60: Middle East and Africa Wearable Injectors Industry Volume (K Unit), by End User 2025 & 2033
- Figure 61: Middle East and Africa Wearable Injectors Industry Revenue Share (%), by End User 2025 & 2033
- Figure 62: Middle East and Africa Wearable Injectors Industry Volume Share (%), by End User 2025 & 2033
- Figure 63: Middle East and Africa Wearable Injectors Industry Revenue (billion), by Country 2025 & 2033
- Figure 64: Middle East and Africa Wearable Injectors Industry Volume (K Unit), by Country 2025 & 2033
- Figure 65: Middle East and Africa Wearable Injectors Industry Revenue Share (%), by Country 2025 & 2033
- Figure 66: Middle East and Africa Wearable Injectors Industry Volume Share (%), by Country 2025 & 2033
- Figure 67: South America Wearable Injectors Industry Revenue (billion), by Type 2025 & 2033
- Figure 68: South America Wearable Injectors Industry Volume (K Unit), by Type 2025 & 2033
- Figure 69: South America Wearable Injectors Industry Revenue Share (%), by Type 2025 & 2033
- Figure 70: South America Wearable Injectors Industry Volume Share (%), by Type 2025 & 2033
- Figure 71: South America Wearable Injectors Industry Revenue (billion), by Therapy 2025 & 2033
- Figure 72: South America Wearable Injectors Industry Volume (K Unit), by Therapy 2025 & 2033
- Figure 73: South America Wearable Injectors Industry Revenue Share (%), by Therapy 2025 & 2033
- Figure 74: South America Wearable Injectors Industry Volume Share (%), by Therapy 2025 & 2033
- Figure 75: South America Wearable Injectors Industry Revenue (billion), by End User 2025 & 2033
- Figure 76: South America Wearable Injectors Industry Volume (K Unit), by End User 2025 & 2033
- Figure 77: South America Wearable Injectors Industry Revenue Share (%), by End User 2025 & 2033
- Figure 78: South America Wearable Injectors Industry Volume Share (%), by End User 2025 & 2033
- Figure 79: South America Wearable Injectors Industry Revenue (billion), by Country 2025 & 2033
- Figure 80: South America Wearable Injectors Industry Volume (K Unit), by Country 2025 & 2033
- Figure 81: South America Wearable Injectors Industry Revenue Share (%), by Country 2025 & 2033
- Figure 82: South America Wearable Injectors Industry Volume Share (%), by Country 2025 & 2033
List of Tables
- Table 1: Global Wearable Injectors Industry Revenue billion Forecast, by Type 2020 & 2033
- Table 2: Global Wearable Injectors Industry Volume K Unit Forecast, by Type 2020 & 2033
- Table 3: Global Wearable Injectors Industry Revenue billion Forecast, by Therapy 2020 & 2033
- Table 4: Global Wearable Injectors Industry Volume K Unit Forecast, by Therapy 2020 & 2033
- Table 5: Global Wearable Injectors Industry Revenue billion Forecast, by End User 2020 & 2033
- Table 6: Global Wearable Injectors Industry Volume K Unit Forecast, by End User 2020 & 2033
- Table 7: Global Wearable Injectors Industry Revenue billion Forecast, by Region 2020 & 2033
- Table 8: Global Wearable Injectors Industry Volume K Unit Forecast, by Region 2020 & 2033
- Table 9: Global Wearable Injectors Industry Revenue billion Forecast, by Type 2020 & 2033
- Table 10: Global Wearable Injectors Industry Volume K Unit Forecast, by Type 2020 & 2033
- Table 11: Global Wearable Injectors Industry Revenue billion Forecast, by Therapy 2020 & 2033
- Table 12: Global Wearable Injectors Industry Volume K Unit Forecast, by Therapy 2020 & 2033
- Table 13: Global Wearable Injectors Industry Revenue billion Forecast, by End User 2020 & 2033
- Table 14: Global Wearable Injectors Industry Volume K Unit Forecast, by End User 2020 & 2033
- Table 15: Global Wearable Injectors Industry Revenue billion Forecast, by Country 2020 & 2033
- Table 16: Global Wearable Injectors Industry Volume K Unit Forecast, by Country 2020 & 2033
- Table 17: United States Wearable Injectors Industry Revenue (billion) Forecast, by Application 2020 & 2033
- Table 18: United States Wearable Injectors Industry Volume (K Unit) Forecast, by Application 2020 & 2033
- Table 19: Canada Wearable Injectors Industry Revenue (billion) Forecast, by Application 2020 & 2033
- Table 20: Canada Wearable Injectors Industry Volume (K Unit) Forecast, by Application 2020 & 2033
- Table 21: Mexico Wearable Injectors Industry Revenue (billion) Forecast, by Application 2020 & 2033
- Table 22: Mexico Wearable Injectors Industry Volume (K Unit) Forecast, by Application 2020 & 2033
- Table 23: Global Wearable Injectors Industry Revenue billion Forecast, by Type 2020 & 2033
- Table 24: Global Wearable Injectors Industry Volume K Unit Forecast, by Type 2020 & 2033
- Table 25: Global Wearable Injectors Industry Revenue billion Forecast, by Therapy 2020 & 2033
- Table 26: Global Wearable Injectors Industry Volume K Unit Forecast, by Therapy 2020 & 2033
- Table 27: Global Wearable Injectors Industry Revenue billion Forecast, by End User 2020 & 2033
- Table 28: Global Wearable Injectors Industry Volume K Unit Forecast, by End User 2020 & 2033
- Table 29: Global Wearable Injectors Industry Revenue billion Forecast, by Country 2020 & 2033
- Table 30: Global Wearable Injectors Industry Volume K Unit Forecast, by Country 2020 & 2033
- Table 31: Germany Wearable Injectors Industry Revenue (billion) Forecast, by Application 2020 & 2033
- Table 32: Germany Wearable Injectors Industry Volume (K Unit) Forecast, by Application 2020 & 2033
- Table 33: United Kingdom Wearable Injectors Industry Revenue (billion) Forecast, by Application 2020 & 2033
- Table 34: United Kingdom Wearable Injectors Industry Volume (K Unit) Forecast, by Application 2020 & 2033
- Table 35: France Wearable Injectors Industry Revenue (billion) Forecast, by Application 2020 & 2033
- Table 36: France Wearable Injectors Industry Volume (K Unit) Forecast, by Application 2020 & 2033
- Table 37: Italy Wearable Injectors Industry Revenue (billion) Forecast, by Application 2020 & 2033
- Table 38: Italy Wearable Injectors Industry Volume (K Unit) Forecast, by Application 2020 & 2033
- Table 39: Spain Wearable Injectors Industry Revenue (billion) Forecast, by Application 2020 & 2033
- Table 40: Spain Wearable Injectors Industry Volume (K Unit) Forecast, by Application 2020 & 2033
- Table 41: Rest of Europe Wearable Injectors Industry Revenue (billion) Forecast, by Application 2020 & 2033
- Table 42: Rest of Europe Wearable Injectors Industry Volume (K Unit) Forecast, by Application 2020 & 2033
- Table 43: Global Wearable Injectors Industry Revenue billion Forecast, by Type 2020 & 2033
- Table 44: Global Wearable Injectors Industry Volume K Unit Forecast, by Type 2020 & 2033
- Table 45: Global Wearable Injectors Industry Revenue billion Forecast, by Therapy 2020 & 2033
- Table 46: Global Wearable Injectors Industry Volume K Unit Forecast, by Therapy 2020 & 2033
- Table 47: Global Wearable Injectors Industry Revenue billion Forecast, by End User 2020 & 2033
- Table 48: Global Wearable Injectors Industry Volume K Unit Forecast, by End User 2020 & 2033
- Table 49: Global Wearable Injectors Industry Revenue billion Forecast, by Country 2020 & 2033
- Table 50: Global Wearable Injectors Industry Volume K Unit Forecast, by Country 2020 & 2033
- Table 51: China Wearable Injectors Industry Revenue (billion) Forecast, by Application 2020 & 2033
- Table 52: China Wearable Injectors Industry Volume (K Unit) Forecast, by Application 2020 & 2033
- Table 53: Japan Wearable Injectors Industry Revenue (billion) Forecast, by Application 2020 & 2033
- Table 54: Japan Wearable Injectors Industry Volume (K Unit) Forecast, by Application 2020 & 2033
- Table 55: India Wearable Injectors Industry Revenue (billion) Forecast, by Application 2020 & 2033
- Table 56: India Wearable Injectors Industry Volume (K Unit) Forecast, by Application 2020 & 2033
- Table 57: Australia Wearable Injectors Industry Revenue (billion) Forecast, by Application 2020 & 2033
- Table 58: Australia Wearable Injectors Industry Volume (K Unit) Forecast, by Application 2020 & 2033
- Table 59: South Korea Wearable Injectors Industry Revenue (billion) Forecast, by Application 2020 & 2033
- Table 60: South Korea Wearable Injectors Industry Volume (K Unit) Forecast, by Application 2020 & 2033
- Table 61: Rest of Asia Pacific Wearable Injectors Industry Revenue (billion) Forecast, by Application 2020 & 2033
- Table 62: Rest of Asia Pacific Wearable Injectors Industry Volume (K Unit) Forecast, by Application 2020 & 2033
- Table 63: Global Wearable Injectors Industry Revenue billion Forecast, by Type 2020 & 2033
- Table 64: Global Wearable Injectors Industry Volume K Unit Forecast, by Type 2020 & 2033
- Table 65: Global Wearable Injectors Industry Revenue billion Forecast, by Therapy 2020 & 2033
- Table 66: Global Wearable Injectors Industry Volume K Unit Forecast, by Therapy 2020 & 2033
- Table 67: Global Wearable Injectors Industry Revenue billion Forecast, by End User 2020 & 2033
- Table 68: Global Wearable Injectors Industry Volume K Unit Forecast, by End User 2020 & 2033
- Table 69: Global Wearable Injectors Industry Revenue billion Forecast, by Country 2020 & 2033
- Table 70: Global Wearable Injectors Industry Volume K Unit Forecast, by Country 2020 & 2033
- Table 71: GCC Wearable Injectors Industry Revenue (billion) Forecast, by Application 2020 & 2033
- Table 72: GCC Wearable Injectors Industry Volume (K Unit) Forecast, by Application 2020 & 2033
- Table 73: South Africa Wearable Injectors Industry Revenue (billion) Forecast, by Application 2020 & 2033
- Table 74: South Africa Wearable Injectors Industry Volume (K Unit) Forecast, by Application 2020 & 2033
- Table 75: Rest of Middle East and Africa Wearable Injectors Industry Revenue (billion) Forecast, by Application 2020 & 2033
- Table 76: Rest of Middle East and Africa Wearable Injectors Industry Volume (K Unit) Forecast, by Application 2020 & 2033
- Table 77: Global Wearable Injectors Industry Revenue billion Forecast, by Type 2020 & 2033
- Table 78: Global Wearable Injectors Industry Volume K Unit Forecast, by Type 2020 & 2033
- Table 79: Global Wearable Injectors Industry Revenue billion Forecast, by Therapy 2020 & 2033
- Table 80: Global Wearable Injectors Industry Volume K Unit Forecast, by Therapy 2020 & 2033
- Table 81: Global Wearable Injectors Industry Revenue billion Forecast, by End User 2020 & 2033
- Table 82: Global Wearable Injectors Industry Volume K Unit Forecast, by End User 2020 & 2033
- Table 83: Global Wearable Injectors Industry Revenue billion Forecast, by Country 2020 & 2033
- Table 84: Global Wearable Injectors Industry Volume K Unit Forecast, by Country 2020 & 2033
- Table 85: Brazil Wearable Injectors Industry Revenue (billion) Forecast, by Application 2020 & 2033
- Table 86: Brazil Wearable Injectors Industry Volume (K Unit) Forecast, by Application 2020 & 2033
- Table 87: Argentina Wearable Injectors Industry Revenue (billion) Forecast, by Application 2020 & 2033
- Table 88: Argentina Wearable Injectors Industry Volume (K Unit) Forecast, by Application 2020 & 2033
- Table 89: Rest of South America Wearable Injectors Industry Revenue (billion) Forecast, by Application 2020 & 2033
- Table 90: Rest of South America Wearable Injectors Industry Volume (K Unit) Forecast, by Application 2020 & 2033
Frequently Asked Questions
1. What is the projected Compound Annual Growth Rate (CAGR) of the Wearable Injectors Industry?
The projected CAGR is approximately 10.6%.
2. Which companies are prominent players in the Wearable Injectors Industry?
Key companies in the market include Becton Dickinson and Company, West Pharmaceutical Services inc, Ypsomed, Buhler motor gmbh, Amgen Inc, Sensile Medical, Dexcom Inc, Insulet Corporation, Tandem Diabetes Care Inc, Eitan Medical, Stevanato Group, Enable Injections, United Therapeutics (Steadymed Therapeutics).
3. What are the main segments of the Wearable Injectors Industry?
The market segments include Type, Therapy, End User.
4. Can you provide details about the market size?
The market size is estimated to be USD 10.1 billion as of 2022.
5. What are some drivers contributing to market growth?
Growing Prevalence of Chronic Diseases; Technological Advancements; Increasing Concern over the Hazards and Limitations Related to Needle stick.
6. What are the notable trends driving market growth?
Oncology Segment is Expected to Hold Significant Market Share Over the Forecast Period.
7. Are there any restraints impacting market growth?
Preference for Alternative Drug Delivery Modes; Unfavorable Reimbursement Structure in Developing Countries.
8. Can you provide examples of recent developments in the market?
June 2022: AbbVie received US FDA approval for SKYRIZI (risankizumab-rzaa) as the first and only specific interleukin-23 (IL-23) inhibitor for the treatment of adults with moderately to severely active Crohn's disease (CD). It can be self-administered by Subcutaneous Injection (SC) with an On-Body Injector (OBI).
9. What pricing options are available for accessing the report?
Pricing options include single-user, multi-user, and enterprise licenses priced at USD 4750, USD 5250, and USD 8750 respectively.
10. Is the market size provided in terms of value or volume?
The market size is provided in terms of value, measured in billion and volume, measured in K Unit.
11. Are there any specific market keywords associated with the report?
Yes, the market keyword associated with the report is "Wearable Injectors Industry," which aids in identifying and referencing the specific market segment covered.
12. How do I determine which pricing option suits my needs best?
The pricing options vary based on user requirements and access needs. Individual users may opt for single-user licenses, while businesses requiring broader access may choose multi-user or enterprise licenses for cost-effective access to the report.
13. Are there any additional resources or data provided in the Wearable Injectors Industry report?
While the report offers comprehensive insights, it's advisable to review the specific contents or supplementary materials provided to ascertain if additional resources or data are available.
14. How can I stay updated on further developments or reports in the Wearable Injectors Industry?
To stay informed about further developments, trends, and reports in the Wearable Injectors Industry, consider subscribing to industry newsletters, following relevant companies and organizations, or regularly checking reputable industry news sources and publications.
Methodology
Step 1 - Identification of Relevant Samples Size from Population Database


Step 2 - Approaches for Defining Global Market Size (Value, Volume* & Price*)

Note*: In applicable scenarios
Step 3 - Data Sources
Primary Research
- Web Analytics
- Survey Reports
- Research Institute
- Latest Research Reports
- Opinion Leaders
Secondary Research
- Annual Reports
- White Paper
- Latest Press Release
- Industry Association
- Paid Database
- Investor Presentations

Step 4 - Data Triangulation
Involves using different sources of information in order to increase the validity of a study
These sources are likely to be stakeholders in a program - participants, other researchers, program staff, other community members, and so on.
Then we put all data in single framework & apply various statistical tools to find out the dynamic on the market.
During the analysis stage, feedback from the stakeholder groups would be compared to determine areas of agreement as well as areas of divergence