

Key Insights
The global Clear Aligner Therapy market is experiencing robust expansion, projected to reach $19850 million by 2025, driven by a remarkable 21.7% CAGR. This significant growth underscores the increasing adoption of discreet and aesthetically pleasing orthodontic solutions. Key market drivers include a growing awareness of oral health, a rising demand for cosmetic dental procedures, and advancements in digital technologies like 3D scanning and printing, which enhance treatment precision and patient comfort. The market is bifurcated into professional treatments, favored by orthodontists and dentists for complex cases, and foundation treatments, which cater to a broader consumer base seeking simpler, at-home correction options. The primary applications for clear aligners span both teenagers and adults, reflecting their broad appeal across age demographics.
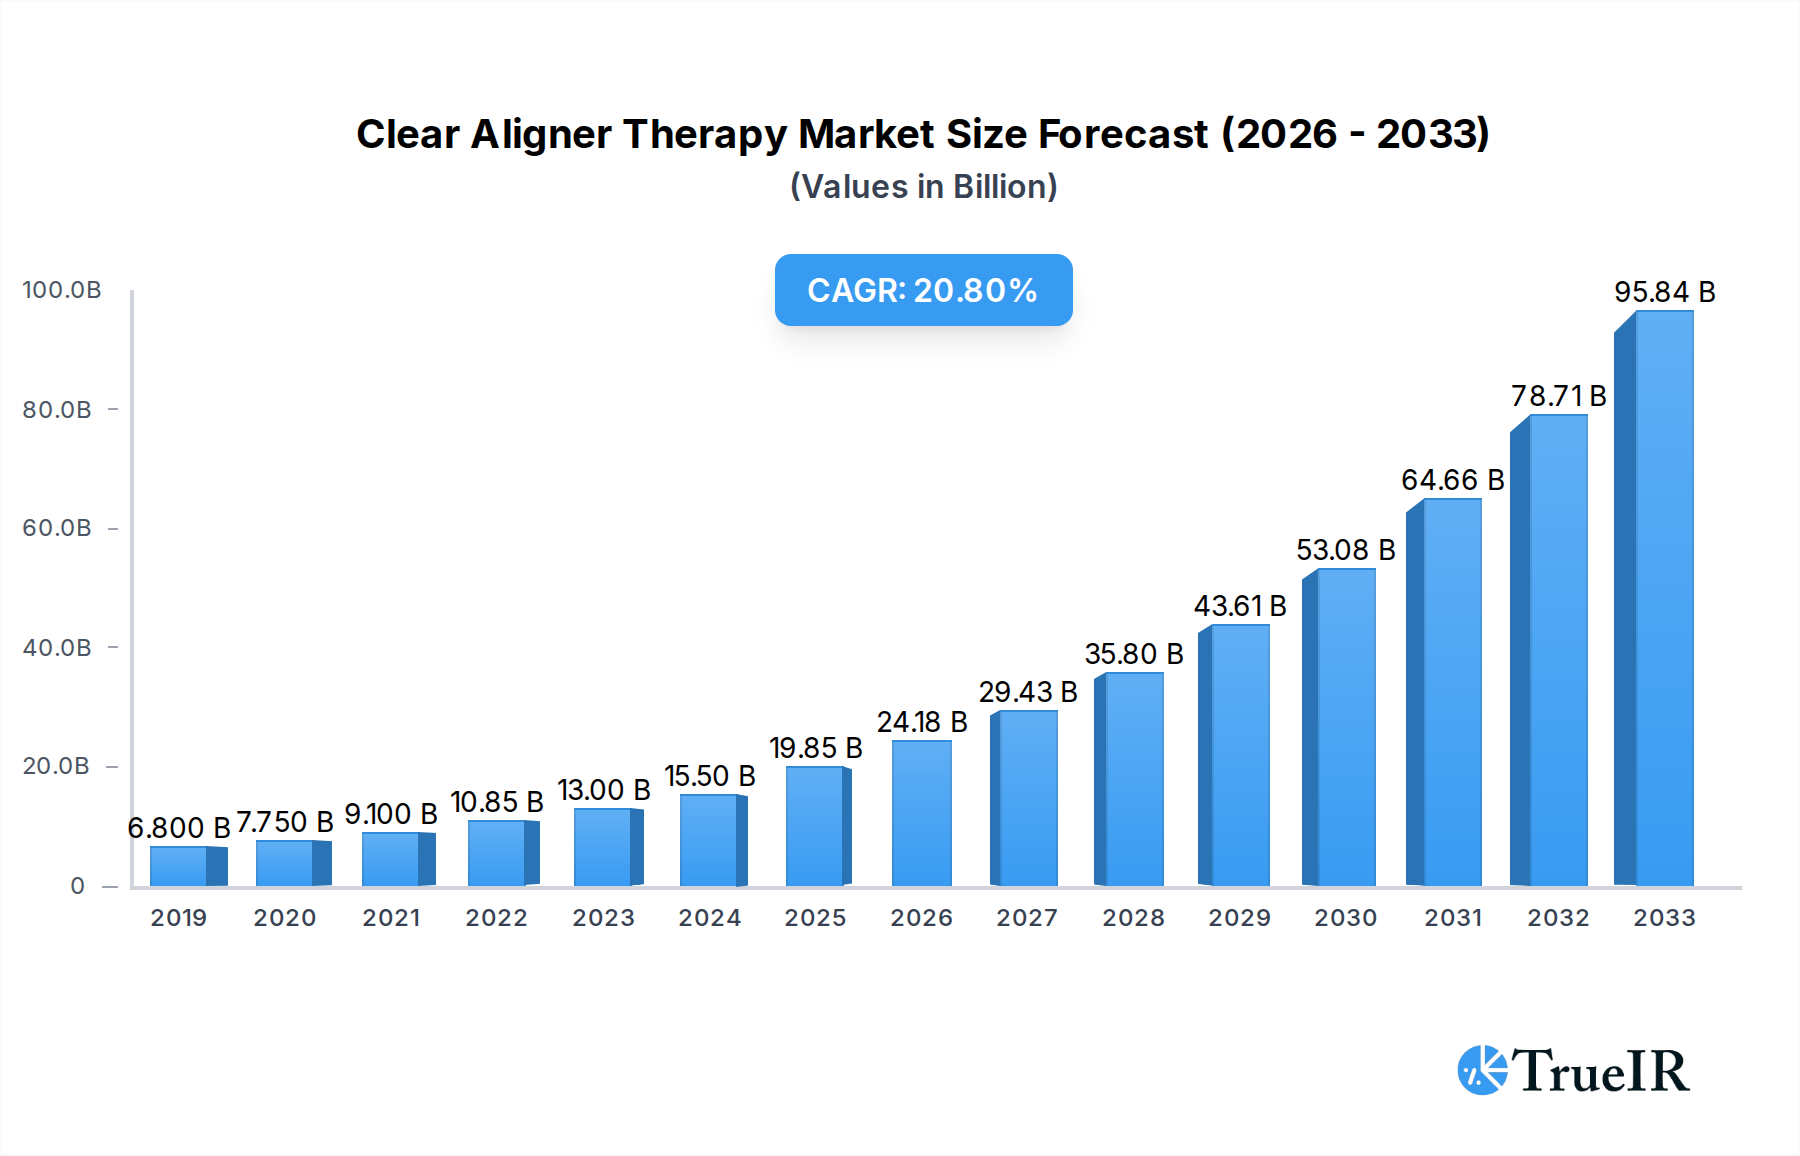
Clear Aligner Therapy Market Size (In Billion)
Further propelling the market are several emerging trends, such as the integration of artificial intelligence for treatment planning and prediction, the development of customized aligner materials for enhanced durability and fit, and the increasing accessibility through teledentistry platforms. However, the market faces certain restraints, including the relatively higher cost compared to traditional braces for some patient segments, and the need for patient compliance and adherence to treatment protocols. Despite these challenges, the competitive landscape is dynamic, featuring established players like Align Technology and emerging innovators such as Smartee and Geniova, all vying to capture market share through product innovation and strategic partnerships. Regional analysis indicates strong performance across North America, Europe, and the Asia Pacific, with China and India emerging as significant growth pockets due to their large populations and increasing disposable incomes.

Clear Aligner Therapy Company Market Share
Clear Aligner Therapy Market Report: Comprehensive Analysis and Future Outlook
This comprehensive report delves into the dynamic Clear Aligner Therapy market, offering deep insights into its structure, trends, dominant segments, product innovations, and future trajectory. Analyzing data from 2019 to 2033, with a base year of 2025, this report is an indispensable resource for industry stakeholders seeking to understand market dynamics, identify growth opportunities, and navigate competitive landscapes. The report examines the market across various applications including Teenagers and Adults, and types such as Professional Treatment and Foundation Treatment, providing a granular view of market penetration and adoption rates.
Clear Aligner Therapy Market Structure & Competitive Landscape
The Clear Aligner Therapy market is characterized by a moderate to high degree of concentration, with leading players such as Align Technology and Dentsply Sirona holding significant market shares, estimated to be in the range of 30-40 million units collectively. Innovation remains a primary driver, fueled by advancements in 3D printing, material science, and AI-driven treatment planning, contributing to an estimated 20-25% of new product development initiatives. Regulatory impacts, while present, have generally fostered market growth by ensuring safety and efficacy standards, with approximately 5-10% of the market influenced by evolving global regulatory frameworks. Product substitutes, though limited in direct therapeutic equivalence, include traditional orthodontics, representing a ~15-20 million patient alternative. End-user segmentation reveals a strong demand from Adults, accounting for an estimated 60-70 million patients, while Teenagers represent a growing segment of 40-50 million. Mergers and acquisitions (M&A) have been a notable trend, with an estimated 8-12 significant transactions in the past five years, consolidating market power and expanding geographical reach.
Clear Aligner Therapy Market Trends & Opportunities
The Clear Aligner Therapy market is projected to witness substantial growth, driven by an escalating demand for aesthetic and less invasive orthodontic solutions. The global market size is estimated to reach over USD 25,000 million by 2025, with a projected Compound Annual Growth Rate (CAGR) of approximately 15-20% throughout the forecast period of 2025–2033. This expansion is fueled by increasing disposable incomes, heightened awareness of oral hygiene, and the growing influence of social media showcasing aesthetically pleasing smiles. Technological shifts are at the forefront of this evolution, with continuous improvements in aligner materials offering enhanced comfort and faster treatment times. Digital smile design and AI-powered treatment planning software are revolutionizing the patient experience, enabling greater precision and predictability. Consumer preferences are increasingly leaning towards discreet and convenient treatment options, making clear aligners a preferred choice over traditional braces for a significant portion of the population. For instance, market penetration for clear aligners in developed economies is estimated to be around 40-50%, with significant untapped potential in emerging markets. Competitive dynamics are intensifying, with established players continually investing in research and development to maintain their edge. New entrants are also emerging, particularly in the direct-to-consumer (DTC) space, though professional treatment remains the dominant channel for comprehensive orthodontic care. The market is also seeing a rise in subscription-based models and integrated treatment platforms, further enhancing accessibility and patient engagement. The increasing acceptance by dental professionals, coupled with favorable reimbursement policies in certain regions, further underpins the robust growth trajectory of the clear aligner therapy market, expected to cross USD 60,000 million by 2033.
Dominant Markets & Segments in Clear Aligner Therapy
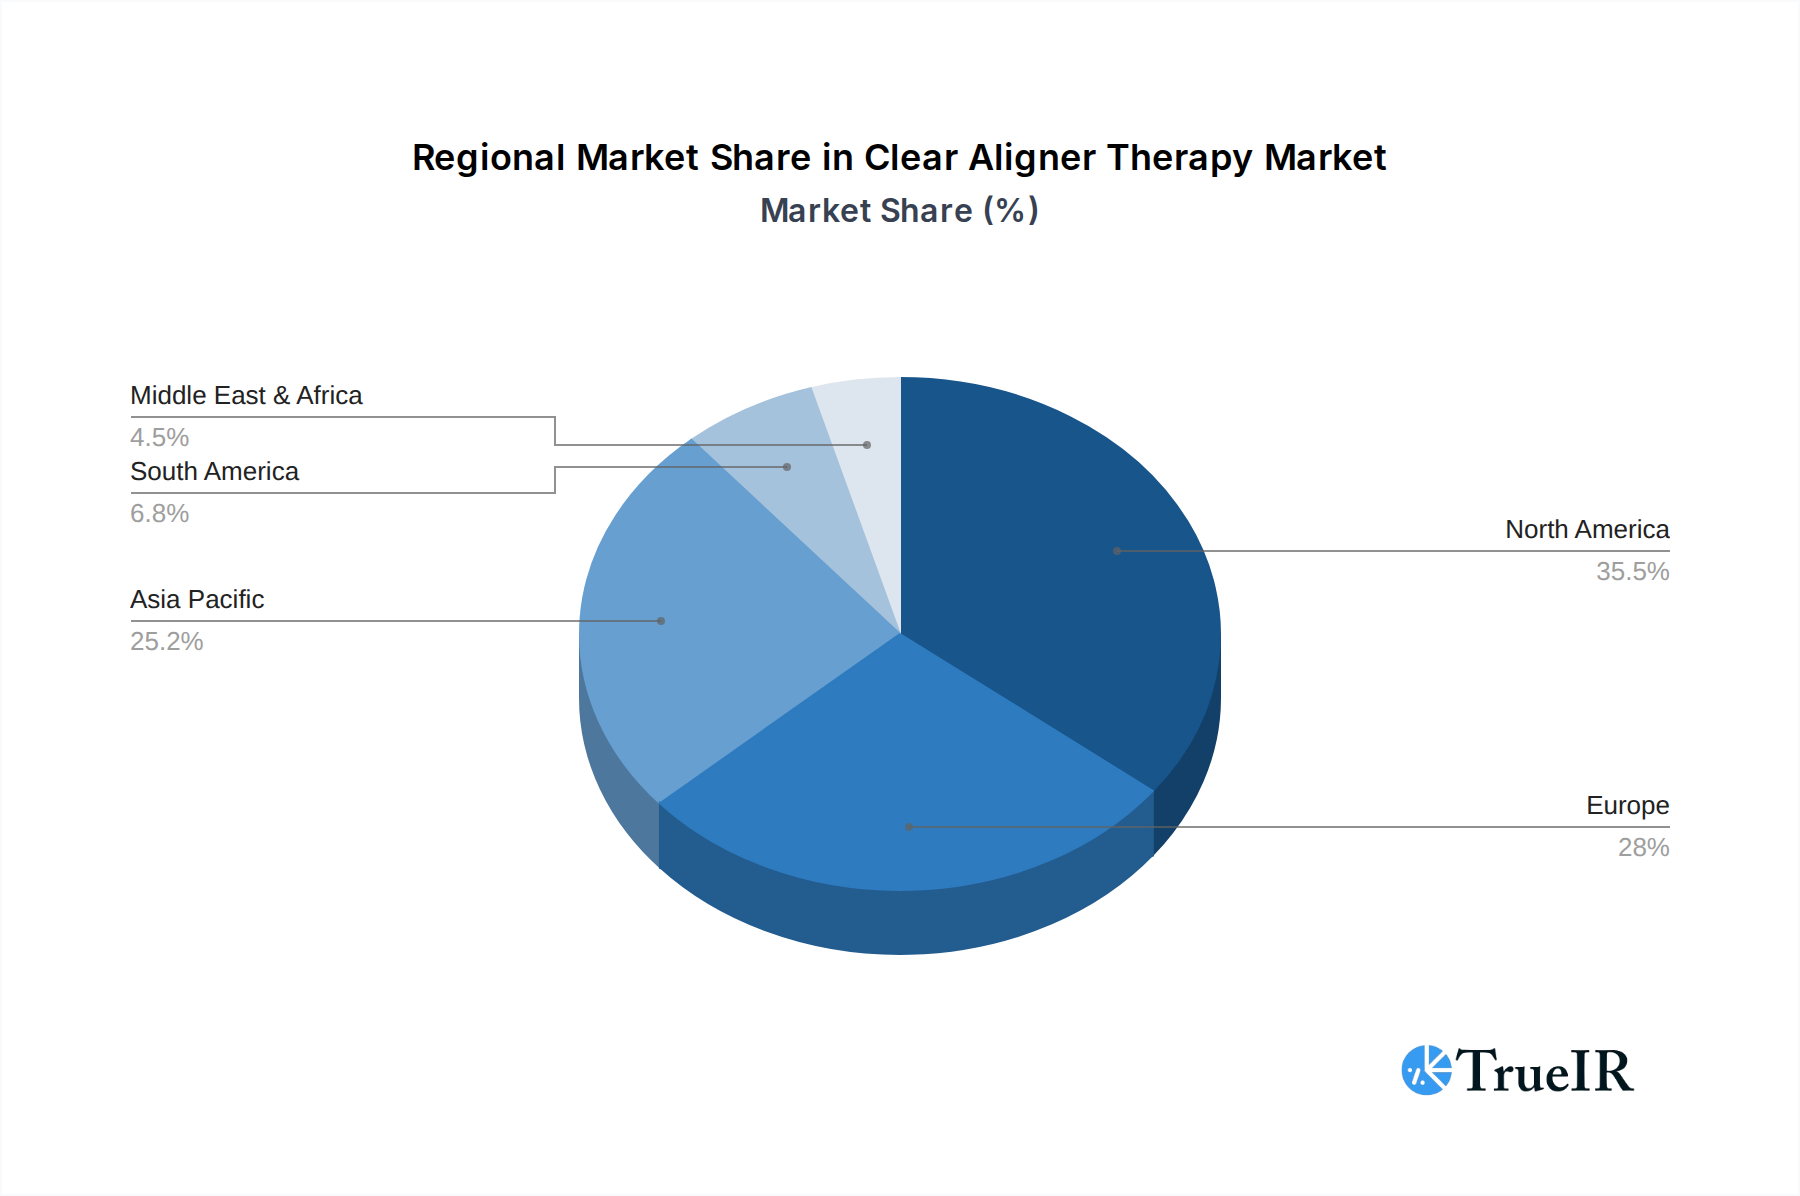
North America currently dominates the Clear Aligner Therapy market, with an estimated market share of approximately 35-40% of the global market. This dominance is driven by high disposable incomes, advanced healthcare infrastructure, and a strong consumer preference for aesthetic dental treatments. The United States, in particular, is a key contributor, with an estimated 15-20 million patients undergoing clear aligner therapy annually. Within North America, the Adults segment is the most dominant application, representing an estimated 70-75% of the total patient pool, driven by the desire for discreet treatment options that fit busy lifestyles. The Professional Treatment type also holds a commanding position, accounting for approximately 85-90% of the market, reflecting the preference for supervised orthodontic care by qualified dental professionals.
Key growth drivers in this dominant region and segment include:
- High Patient Awareness and Demand: Extensive marketing campaigns and the widespread availability of information about clear aligner benefits have significantly boosted patient demand.
- Technological Advancements and Accessibility: The early adoption and continuous innovation in digital scanning, CAD/CAM technology, and advanced aligner materials have made treatments more efficient and predictable.
- Strong Dental Professional Network: A well-established network of orthodontists and general dentists trained in clear aligner treatments ensures effective patient care and treatment delivery.
- Favorable Reimbursement Landscape: While variable, insurance coverage and flexible payment options in some regions contribute to treatment affordability.
The Teenagers segment is also experiencing robust growth, driven by the desire for aesthetically pleasing orthodontic solutions that avoid the social stigma sometimes associated with traditional braces. Within this segment, Professional Treatment remains the preferred type. However, there's a growing interest in Foundation Treatment options, particularly from direct-to-consumer (DTC) providers, though professional oversight remains crucial for complex cases. The Asia-Pacific region is emerging as a significant growth engine, with countries like China and India showing substantial increases in adoption due to rising incomes and growing awareness.
Clear Aligner Therapy Product Analysis
Clear aligner therapy has revolutionized orthodontic treatment through continuous product innovations focused on enhanced patient comfort, treatment efficiency, and aesthetic appeal. Advancements in material science have led to the development of more durable, transparent, and less irritating aligner materials, improving compliance and reducing treatment duration. Digital treatment planning, utilizing advanced 3D imaging and AI algorithms, allows for precise simulation of treatment outcomes, personalized treatment protocols, and virtual monitoring, offering a significant competitive advantage. These innovations cater effectively to both the Teenagers and Adults segments, providing discreet and convenient solutions. The competitive landscape is shaped by companies offering integrated digital workflows, from initial scanning to aligner fabrication and post-treatment retention, ensuring a seamless patient journey and high treatment success rates.
Key Drivers, Barriers & Challenges in Clear Aligner Therapy
Key Drivers: The Clear Aligner Therapy market is propelled by several key drivers. Technological advancements, such as AI-driven treatment planning and improved material science, significantly enhance treatment efficacy and patient experience. Increasing consumer awareness regarding the aesthetic and functional benefits of clear aligners, coupled with a growing demand for discreet orthodontic solutions, fuels market expansion. Furthermore, the rise of digital dental technologies and the expanding network of trained dental professionals contribute to greater accessibility and adoption.
Key Barriers & Challenges: Despite its growth, the market faces certain challenges. High treatment costs can be a significant barrier for some patient segments, limiting market penetration. Stringent regulatory approvals for novel materials and technologies can slow down innovation cycles. Supply chain disruptions, particularly for specialized materials and manufacturing components, can impact production and delivery. Moreover, the increasing competition, especially from direct-to-consumer (DTC) providers, raises concerns about treatment quality and patient safety in cases requiring professional intervention, representing an estimated 5-10% of potential cases being mishandled.
Growth Drivers in the Clear Aligner Therapy Market
The growth of the Clear Aligner Therapy market is significantly influenced by technological innovation, economic factors, and evolving policy landscapes. The continuous development of advanced materials offering enhanced durability and comfort, coupled with sophisticated AI-powered diagnostic and treatment planning software, are key technological drivers. Economically, rising disposable incomes globally and the increasing demand for cosmetic dental procedures contribute to market expansion. Policy-driven factors, such as expanding healthcare coverage for orthodontic treatments and supportive regulatory frameworks, further stimulate growth by increasing accessibility and patient confidence.
Challenges Impacting Clear Aligner Therapy Growth
Regulatory complexities surrounding new product approvals and variations in international standards can present significant challenges. Supply chain vulnerabilities, from raw material sourcing to the distribution of finished aligners, can lead to production delays and increased costs. Intense competitive pressures, especially with the emergence of new market entrants and the evolving direct-to-consumer (DTC) segment, necessitate continuous innovation and cost-efficiency strategies to maintain market share. The potential for misdiagnosis or inadequate treatment in unsupervised settings poses a substantial risk, impacting patient outcomes and the reputation of the industry.
Key Players Shaping the Clear Aligner Therapy Market
- Align Technology
- ClearCorrect
- Dentsply Sirona
- Angelalign
- Danaher Ormco
- Smartee
- Irok
- BioMers
- ClearPath Orthodontics
- Geniova
- Clarus Company
- EZ SMILE
Significant Clear Aligner Therapy Industry Milestones
- 2019: Introduction of AI-powered treatment planning software by major players, enhancing diagnostic accuracy and treatment simulation.
- 2020: Increased adoption of remote consultations and digital monitoring tools due to global health trends, boosting telehealth in orthodontics.
- 2021: Launch of new, more resilient aligner materials with improved biomechanical properties, leading to faster treatment times.
- 2022: Significant investment in direct-to-consumer (DTC) clear aligner services, expanding market reach and accessibility.
- 2023: Emergence of integrated digital workflow solutions, encompassing scanning, treatment planning, and aligner manufacturing for a seamless patient experience.
- 2024: Growing research into lingual aligners and hybrid approaches combining clear aligners with other orthodontic modalities.
Future Outlook for Clear Aligner Therapy Market
The future outlook for the Clear Aligner Therapy market remains exceptionally positive, driven by persistent technological advancements and evolving consumer preferences. Continued innovation in materials science and digital technologies, including augmented reality for patient visualization and AI for predictive analytics, will further refine treatment outcomes and patient engagement. The expansion of market penetration into emerging economies, coupled with more affordable treatment options and improved insurance coverage, will unlock new patient segments. Strategic collaborations between technology providers, dental manufacturers, and healthcare institutions are expected to foster a more integrated and efficient treatment ecosystem, paving the way for sustained double-digit growth throughout the forecast period.
Clear Aligner Therapy Segmentation
-
1. Application
- 1.1. Teenagers
- 1.2. Adults
-
2. Type
- 2.1. Professional Treatment
- 2.2. Foundation Treatment
Clear Aligner Therapy Segmentation By Geography
-
1. North America
- 1.1. United States
- 1.2. Canada
- 1.3. Mexico
-
2. South America
- 2.1. Brazil
- 2.2. Argentina
- 2.3. Rest of South America
-
3. Europe
- 3.1. United Kingdom
- 3.2. Germany
- 3.3. France
- 3.4. Italy
- 3.5. Spain
- 3.6. Russia
- 3.7. Benelux
- 3.8. Nordics
- 3.9. Rest of Europe
-
4. Middle East & Africa
- 4.1. Turkey
- 4.2. Israel
- 4.3. GCC
- 4.4. North Africa
- 4.5. South Africa
- 4.6. Rest of Middle East & Africa
-
5. Asia Pacific
- 5.1. China
- 5.2. India
- 5.3. Japan
- 5.4. South Korea
- 5.5. ASEAN
- 5.6. Oceania
- 5.7. Rest of Asia Pacific
Clear Aligner Therapy Regional Market Share
Geographic Coverage of Clear Aligner Therapy
Clear Aligner Therapy REPORT HIGHLIGHTS
| Aspects | Details |
|---|---|
| Study Period | 2020-2034 |
| Base Year | 2025 |
| Estimated Year | 2026 |
| Forecast Period | 2026-2034 |
| Historical Period | 2020-2025 |
| Growth Rate | CAGR of 21.7% from 2020-2034 |
| Segmentation |
|
Table of Contents
- 1. Introduction
- 1.1. Research Scope
- 1.2. Market Segmentation
- 1.3. Research Objective
- 1.4. Definitions and Assumptions
- 2. Executive Summary
- 2.1. Market Snapshot
- 3. Market Dynamics
- 3.1. Market Drivers
- 3.2. Market Restrains
- 3.3. Market Trends
- 3.4. Market Opportunities
- 4. Market Factor Analysis
- 4.1. Porters Five Forces
- 4.1.1. Bargaining Power of Suppliers
- 4.1.2. Bargaining Power of Buyers
- 4.1.3. Threat of New Entrants
- 4.1.4. Threat of Substitutes
- 4.1.5. Competitive Rivalry
- 4.2. PESTEL analysis
- 4.3. BCG Analysis
- 4.3.1. Stars (High Growth, High Market Share)
- 4.3.2. Cash Cows (Low Growth, High Market Share)
- 4.3.3. Question Mark (High Growth, Low Market Share)
- 4.3.4. Dogs (Low Growth, Low Market Share)
- 4.4. Ansoff Matrix Analysis
- 4.5. Supply Chain Analysis
- 4.6. Regulatory Landscape
- 4.7. Current Market Potential and Opportunity Assessment (TAM–SAM–SOM Framework)
- 4.8. TIR Analyst Note
- 4.1. Porters Five Forces
- 5. Market Analysis, Insights and Forecast 2021-2033
- 5.1. Market Analysis, Insights and Forecast - by Application
- 5.1.1. Teenagers
- 5.1.2. Adults
- 5.2. Market Analysis, Insights and Forecast - by Type
- 5.2.1. Professional Treatment
- 5.2.2. Foundation Treatment
- 5.3. Market Analysis, Insights and Forecast - by Region
- 5.3.1. North America
- 5.3.2. South America
- 5.3.3. Europe
- 5.3.4. Middle East & Africa
- 5.3.5. Asia Pacific
- 5.1. Market Analysis, Insights and Forecast - by Application
- 6. Global Clear Aligner Therapy Analysis, Insights and Forecast, 2021-2033
- 6.1. Market Analysis, Insights and Forecast - by Application
- 6.1.1. Teenagers
- 6.1.2. Adults
- 6.2. Market Analysis, Insights and Forecast - by Type
- 6.2.1. Professional Treatment
- 6.2.2. Foundation Treatment
- 6.1. Market Analysis, Insights and Forecast - by Application
- 7. North America Clear Aligner Therapy Analysis, Insights and Forecast, 2020-2032
- 7.1. Market Analysis, Insights and Forecast - by Application
- 7.1.1. Teenagers
- 7.1.2. Adults
- 7.2. Market Analysis, Insights and Forecast - by Type
- 7.2.1. Professional Treatment
- 7.2.2. Foundation Treatment
- 7.1. Market Analysis, Insights and Forecast - by Application
- 8. South America Clear Aligner Therapy Analysis, Insights and Forecast, 2020-2032
- 8.1. Market Analysis, Insights and Forecast - by Application
- 8.1.1. Teenagers
- 8.1.2. Adults
- 8.2. Market Analysis, Insights and Forecast - by Type
- 8.2.1. Professional Treatment
- 8.2.2. Foundation Treatment
- 8.1. Market Analysis, Insights and Forecast - by Application
- 9. Europe Clear Aligner Therapy Analysis, Insights and Forecast, 2020-2032
- 9.1. Market Analysis, Insights and Forecast - by Application
- 9.1.1. Teenagers
- 9.1.2. Adults
- 9.2. Market Analysis, Insights and Forecast - by Type
- 9.2.1. Professional Treatment
- 9.2.2. Foundation Treatment
- 9.1. Market Analysis, Insights and Forecast - by Application
- 10. Middle East & Africa Clear Aligner Therapy Analysis, Insights and Forecast, 2020-2032
- 10.1. Market Analysis, Insights and Forecast - by Application
- 10.1.1. Teenagers
- 10.1.2. Adults
- 10.2. Market Analysis, Insights and Forecast - by Type
- 10.2.1. Professional Treatment
- 10.2.2. Foundation Treatment
- 10.1. Market Analysis, Insights and Forecast - by Application
- 11. Asia Pacific Clear Aligner Therapy Analysis, Insights and Forecast, 2020-2032
- 11.1. Market Analysis, Insights and Forecast - by Application
- 11.1.1. Teenagers
- 11.1.2. Adults
- 11.2. Market Analysis, Insights and Forecast - by Type
- 11.2.1. Professional Treatment
- 11.2.2. Foundation Treatment
- 11.1. Market Analysis, Insights and Forecast - by Application
- 12. Competitive Analysis
- 12.1. Company Profiles
- 12.1.1 Align Technology
- 12.1.1.1. Company Overview
- 12.1.1.2. Products
- 12.1.1.3. Company Financials
- 12.1.1.4. SWOT Analysis
- 12.1.2 ClearCorrect
- 12.1.2.1. Company Overview
- 12.1.2.2. Products
- 12.1.2.3. Company Financials
- 12.1.2.4. SWOT Analysis
- 12.1.3 Dentsply Sirona
- 12.1.3.1. Company Overview
- 12.1.3.2. Products
- 12.1.3.3. Company Financials
- 12.1.3.4. SWOT Analysis
- 12.1.4 Angelalign
- 12.1.4.1. Company Overview
- 12.1.4.2. Products
- 12.1.4.3. Company Financials
- 12.1.4.4. SWOT Analysis
- 12.1.5 Danaher Ormco
- 12.1.5.1. Company Overview
- 12.1.5.2. Products
- 12.1.5.3. Company Financials
- 12.1.5.4. SWOT Analysis
- 12.1.6 Smartee
- 12.1.6.1. Company Overview
- 12.1.6.2. Products
- 12.1.6.3. Company Financials
- 12.1.6.4. SWOT Analysis
- 12.1.7 Irok
- 12.1.7.1. Company Overview
- 12.1.7.2. Products
- 12.1.7.3. Company Financials
- 12.1.7.4. SWOT Analysis
- 12.1.8 BioMers
- 12.1.8.1. Company Overview
- 12.1.8.2. Products
- 12.1.8.3. Company Financials
- 12.1.8.4. SWOT Analysis
- 12.1.9 ClearPath Orthodontics
- 12.1.9.1. Company Overview
- 12.1.9.2. Products
- 12.1.9.3. Company Financials
- 12.1.9.4. SWOT Analysis
- 12.1.10 Geniova
- 12.1.10.1. Company Overview
- 12.1.10.2. Products
- 12.1.10.3. Company Financials
- 12.1.10.4. SWOT Analysis
- 12.1.11 Clarus Company
- 12.1.11.1. Company Overview
- 12.1.11.2. Products
- 12.1.11.3. Company Financials
- 12.1.11.4. SWOT Analysis
- 12.1.12 EZ SMILE
- 12.1.12.1. Company Overview
- 12.1.12.2. Products
- 12.1.12.3. Company Financials
- 12.1.12.4. SWOT Analysis
- 12.1.1 Align Technology
- 12.2. Market Entropy
- 12.2.1 Company's Key Areas Served
- 12.2.2 Recent Developments
- 12.3. Company Market Share Analysis 2025
- 12.3.1 Top 5 Companies Market Share Analysis
- 12.3.2 Top 3 Companies Market Share Analysis
- 12.4. List of Potential Customers
- 13. Research Methodology
List of Figures
- Figure 1: Global Clear Aligner Therapy Revenue Breakdown (million, %) by Region 2025 & 2033
- Figure 2: North America Clear Aligner Therapy Revenue (million), by Application 2025 & 2033
- Figure 3: North America Clear Aligner Therapy Revenue Share (%), by Application 2025 & 2033
- Figure 4: North America Clear Aligner Therapy Revenue (million), by Type 2025 & 2033
- Figure 5: North America Clear Aligner Therapy Revenue Share (%), by Type 2025 & 2033
- Figure 6: North America Clear Aligner Therapy Revenue (million), by Country 2025 & 2033
- Figure 7: North America Clear Aligner Therapy Revenue Share (%), by Country 2025 & 2033
- Figure 8: South America Clear Aligner Therapy Revenue (million), by Application 2025 & 2033
- Figure 9: South America Clear Aligner Therapy Revenue Share (%), by Application 2025 & 2033
- Figure 10: South America Clear Aligner Therapy Revenue (million), by Type 2025 & 2033
- Figure 11: South America Clear Aligner Therapy Revenue Share (%), by Type 2025 & 2033
- Figure 12: South America Clear Aligner Therapy Revenue (million), by Country 2025 & 2033
- Figure 13: South America Clear Aligner Therapy Revenue Share (%), by Country 2025 & 2033
- Figure 14: Europe Clear Aligner Therapy Revenue (million), by Application 2025 & 2033
- Figure 15: Europe Clear Aligner Therapy Revenue Share (%), by Application 2025 & 2033
- Figure 16: Europe Clear Aligner Therapy Revenue (million), by Type 2025 & 2033
- Figure 17: Europe Clear Aligner Therapy Revenue Share (%), by Type 2025 & 2033
- Figure 18: Europe Clear Aligner Therapy Revenue (million), by Country 2025 & 2033
- Figure 19: Europe Clear Aligner Therapy Revenue Share (%), by Country 2025 & 2033
- Figure 20: Middle East & Africa Clear Aligner Therapy Revenue (million), by Application 2025 & 2033
- Figure 21: Middle East & Africa Clear Aligner Therapy Revenue Share (%), by Application 2025 & 2033
- Figure 22: Middle East & Africa Clear Aligner Therapy Revenue (million), by Type 2025 & 2033
- Figure 23: Middle East & Africa Clear Aligner Therapy Revenue Share (%), by Type 2025 & 2033
- Figure 24: Middle East & Africa Clear Aligner Therapy Revenue (million), by Country 2025 & 2033
- Figure 25: Middle East & Africa Clear Aligner Therapy Revenue Share (%), by Country 2025 & 2033
- Figure 26: Asia Pacific Clear Aligner Therapy Revenue (million), by Application 2025 & 2033
- Figure 27: Asia Pacific Clear Aligner Therapy Revenue Share (%), by Application 2025 & 2033
- Figure 28: Asia Pacific Clear Aligner Therapy Revenue (million), by Type 2025 & 2033
- Figure 29: Asia Pacific Clear Aligner Therapy Revenue Share (%), by Type 2025 & 2033
- Figure 30: Asia Pacific Clear Aligner Therapy Revenue (million), by Country 2025 & 2033
- Figure 31: Asia Pacific Clear Aligner Therapy Revenue Share (%), by Country 2025 & 2033
List of Tables
- Table 1: Global Clear Aligner Therapy Revenue million Forecast, by Application 2020 & 2033
- Table 2: Global Clear Aligner Therapy Revenue million Forecast, by Type 2020 & 2033
- Table 3: Global Clear Aligner Therapy Revenue million Forecast, by Region 2020 & 2033
- Table 4: Global Clear Aligner Therapy Revenue million Forecast, by Application 2020 & 2033
- Table 5: Global Clear Aligner Therapy Revenue million Forecast, by Type 2020 & 2033
- Table 6: Global Clear Aligner Therapy Revenue million Forecast, by Country 2020 & 2033
- Table 7: United States Clear Aligner Therapy Revenue (million) Forecast, by Application 2020 & 2033
- Table 8: Canada Clear Aligner Therapy Revenue (million) Forecast, by Application 2020 & 2033
- Table 9: Mexico Clear Aligner Therapy Revenue (million) Forecast, by Application 2020 & 2033
- Table 10: Global Clear Aligner Therapy Revenue million Forecast, by Application 2020 & 2033
- Table 11: Global Clear Aligner Therapy Revenue million Forecast, by Type 2020 & 2033
- Table 12: Global Clear Aligner Therapy Revenue million Forecast, by Country 2020 & 2033
- Table 13: Brazil Clear Aligner Therapy Revenue (million) Forecast, by Application 2020 & 2033
- Table 14: Argentina Clear Aligner Therapy Revenue (million) Forecast, by Application 2020 & 2033
- Table 15: Rest of South America Clear Aligner Therapy Revenue (million) Forecast, by Application 2020 & 2033
- Table 16: Global Clear Aligner Therapy Revenue million Forecast, by Application 2020 & 2033
- Table 17: Global Clear Aligner Therapy Revenue million Forecast, by Type 2020 & 2033
- Table 18: Global Clear Aligner Therapy Revenue million Forecast, by Country 2020 & 2033
- Table 19: United Kingdom Clear Aligner Therapy Revenue (million) Forecast, by Application 2020 & 2033
- Table 20: Germany Clear Aligner Therapy Revenue (million) Forecast, by Application 2020 & 2033
- Table 21: France Clear Aligner Therapy Revenue (million) Forecast, by Application 2020 & 2033
- Table 22: Italy Clear Aligner Therapy Revenue (million) Forecast, by Application 2020 & 2033
- Table 23: Spain Clear Aligner Therapy Revenue (million) Forecast, by Application 2020 & 2033
- Table 24: Russia Clear Aligner Therapy Revenue (million) Forecast, by Application 2020 & 2033
- Table 25: Benelux Clear Aligner Therapy Revenue (million) Forecast, by Application 2020 & 2033
- Table 26: Nordics Clear Aligner Therapy Revenue (million) Forecast, by Application 2020 & 2033
- Table 27: Rest of Europe Clear Aligner Therapy Revenue (million) Forecast, by Application 2020 & 2033
- Table 28: Global Clear Aligner Therapy Revenue million Forecast, by Application 2020 & 2033
- Table 29: Global Clear Aligner Therapy Revenue million Forecast, by Type 2020 & 2033
- Table 30: Global Clear Aligner Therapy Revenue million Forecast, by Country 2020 & 2033
- Table 31: Turkey Clear Aligner Therapy Revenue (million) Forecast, by Application 2020 & 2033
- Table 32: Israel Clear Aligner Therapy Revenue (million) Forecast, by Application 2020 & 2033
- Table 33: GCC Clear Aligner Therapy Revenue (million) Forecast, by Application 2020 & 2033
- Table 34: North Africa Clear Aligner Therapy Revenue (million) Forecast, by Application 2020 & 2033
- Table 35: South Africa Clear Aligner Therapy Revenue (million) Forecast, by Application 2020 & 2033
- Table 36: Rest of Middle East & Africa Clear Aligner Therapy Revenue (million) Forecast, by Application 2020 & 2033
- Table 37: Global Clear Aligner Therapy Revenue million Forecast, by Application 2020 & 2033
- Table 38: Global Clear Aligner Therapy Revenue million Forecast, by Type 2020 & 2033
- Table 39: Global Clear Aligner Therapy Revenue million Forecast, by Country 2020 & 2033
- Table 40: China Clear Aligner Therapy Revenue (million) Forecast, by Application 2020 & 2033
- Table 41: India Clear Aligner Therapy Revenue (million) Forecast, by Application 2020 & 2033
- Table 42: Japan Clear Aligner Therapy Revenue (million) Forecast, by Application 2020 & 2033
- Table 43: South Korea Clear Aligner Therapy Revenue (million) Forecast, by Application 2020 & 2033
- Table 44: ASEAN Clear Aligner Therapy Revenue (million) Forecast, by Application 2020 & 2033
- Table 45: Oceania Clear Aligner Therapy Revenue (million) Forecast, by Application 2020 & 2033
- Table 46: Rest of Asia Pacific Clear Aligner Therapy Revenue (million) Forecast, by Application 2020 & 2033
Frequently Asked Questions
1. What is the projected Compound Annual Growth Rate (CAGR) of the Clear Aligner Therapy?
The projected CAGR is approximately 21.7%.
2. Which companies are prominent players in the Clear Aligner Therapy?
Key companies in the market include Align Technology, ClearCorrect, Dentsply Sirona, Angelalign, Danaher Ormco, Smartee, Irok, BioMers, ClearPath Orthodontics, Geniova, Clarus Company, EZ SMILE.
3. What are the main segments of the Clear Aligner Therapy?
The market segments include Application, Type.
4. Can you provide details about the market size?
The market size is estimated to be USD 19850 million as of 2022.
5. What are some drivers contributing to market growth?
N/A
6. What are the notable trends driving market growth?
N/A
7. Are there any restraints impacting market growth?
N/A
8. Can you provide examples of recent developments in the market?
N/A
9. What pricing options are available for accessing the report?
Pricing options include single-user, multi-user, and enterprise licenses priced at USD 4250.00, USD 6375.00, and USD 8500.00 respectively.
10. Is the market size provided in terms of value or volume?
The market size is provided in terms of value, measured in million.
11. Are there any specific market keywords associated with the report?
Yes, the market keyword associated with the report is "Clear Aligner Therapy," which aids in identifying and referencing the specific market segment covered.
12. How do I determine which pricing option suits my needs best?
The pricing options vary based on user requirements and access needs. Individual users may opt for single-user licenses, while businesses requiring broader access may choose multi-user or enterprise licenses for cost-effective access to the report.
13. Are there any additional resources or data provided in the Clear Aligner Therapy report?
While the report offers comprehensive insights, it's advisable to review the specific contents or supplementary materials provided to ascertain if additional resources or data are available.
14. How can I stay updated on further developments or reports in the Clear Aligner Therapy?
To stay informed about further developments, trends, and reports in the Clear Aligner Therapy, consider subscribing to industry newsletters, following relevant companies and organizations, or regularly checking reputable industry news sources and publications.
Methodology
Step 1 - Identification of Relevant Samples Size from Population Database


Step 2 - Approaches for Defining Global Market Size (Value, Volume* & Price*)

Note*: In applicable scenarios
Step 3 - Data Sources
Primary Research
- Web Analytics
- Survey Reports
- Research Institute
- Latest Research Reports
- Opinion Leaders
Secondary Research
- Annual Reports
- White Paper
- Latest Press Release
- Industry Association
- Paid Database
- Investor Presentations

Step 4 - Data Triangulation
Involves using different sources of information in order to increase the validity of a study
These sources are likely to be stakeholders in a program - participants, other researchers, program staff, other community members, and so on.
Then we put all data in single framework & apply various statistical tools to find out the dynamic on the market.
During the analysis stage, feedback from the stakeholder groups would be compared to determine areas of agreement as well as areas of divergence