

Key Insights
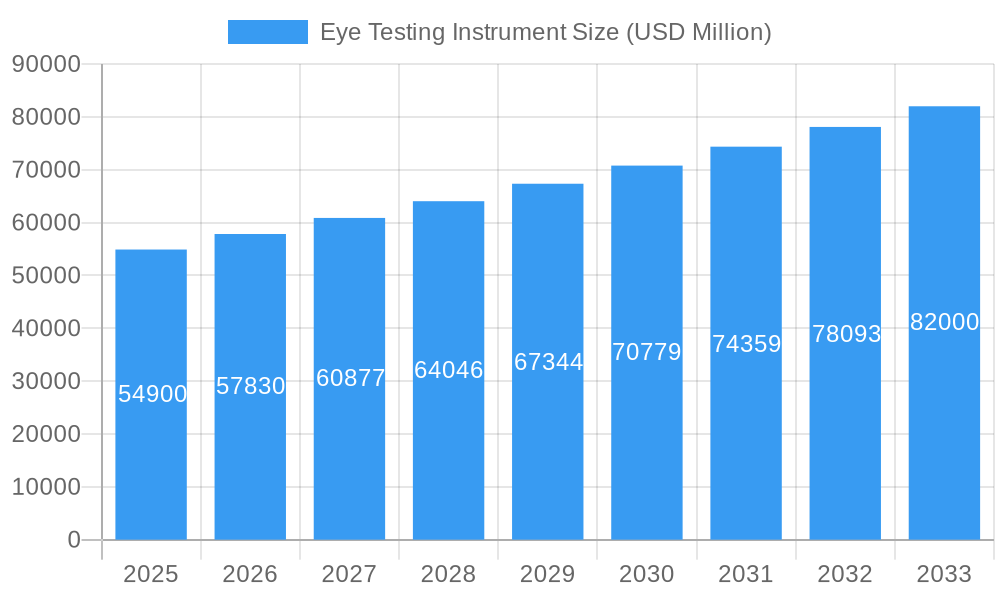
The global Eye Testing Instrument market is poised for robust growth, estimated to reach 54.9 billion by 2025. Driven by an increasing prevalence of eye disorders such as glaucoma and cataracts, coupled with a growing aging population, the demand for advanced diagnostic tools is escalating. Technological advancements, including the integration of AI and cloud computing into ophthalmic devices, are further fueling market expansion. Enhanced diagnostic accuracy and early detection capabilities are becoming paramount, leading to higher adoption rates of sophisticated instruments like slit lamps, biometers, perimeters, and fundus cameras. The market's CAGR of 5.4% over the forecast period (2025-2033) underscores a sustained upward trajectory, reflecting ongoing innovation and a proactive approach to eye health management worldwide. The development of portable and user-friendly diagnostic devices is also contributing to wider accessibility, particularly in emerging economies.
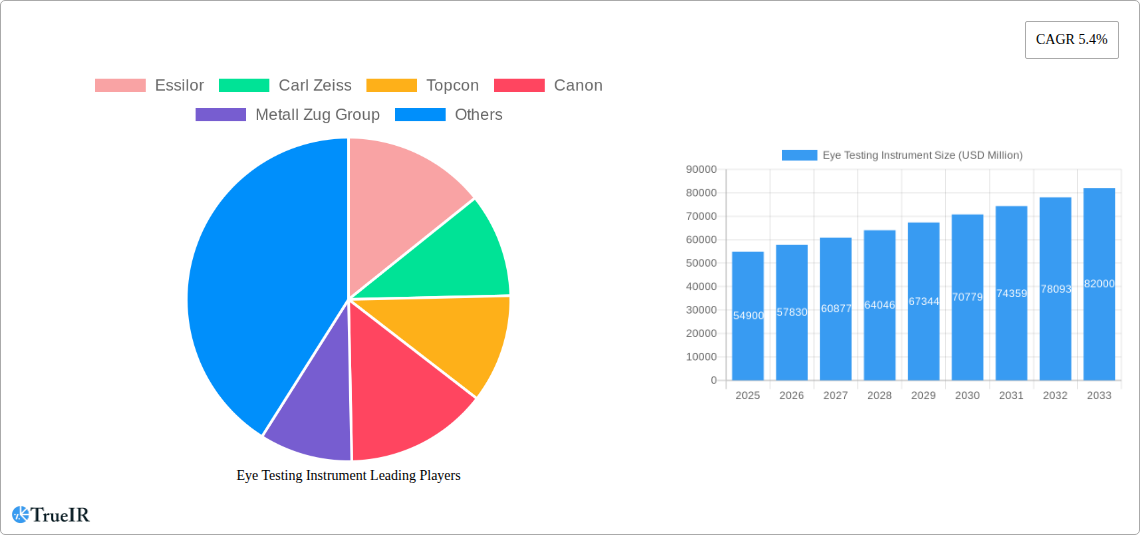
Eye Testing Instrument Market Size (In Billion)
The market is segmented by application, with glaucoma and cataract detection being the primary drivers, and by type, encompassing a wide array of essential ophthalmic equipment. Key players such as Essilor, Carl Zeiss, and Topcon are at the forefront of innovation, investing heavily in research and development to introduce cutting-edge solutions. While market growth is strong, potential restraints include the high cost of advanced diagnostic equipment and the need for skilled personnel to operate them, particularly in underserved regions. However, the increasing global focus on preventive healthcare and regular eye check-ups, alongside favorable reimbursement policies in developed nations, are expected to offset these challenges. The Asia Pacific region is anticipated to witness significant growth due to a burgeoning patient pool and increasing healthcare expenditure.
Eye Testing Instrument Company Market Share
Eye Testing Instrument Market Structure & Competitive Landscape
The global eye testing instrument market exhibits a moderately consolidated structure, characterized by the presence of established multinational corporations and a growing number of specialized regional players. Innovation serves as a key differentiator, with companies heavily investing in research and development to enhance diagnostic accuracy, improve patient comfort, and integrate advanced digital capabilities. Regulatory landscapes, particularly concerning medical device approvals and data privacy, significantly influence market entry and product lifecycle management. Product substitutes, though limited in direct diagnostic replacement, include advancements in wearable diagnostic devices and AI-powered diagnostic software, prompting traditional instrument manufacturers to innovate and integrate. End-user segmentation spans ophthalmology clinics, optometry practices, hospitals, and increasingly, primary care settings. Mergers and acquisitions (M&A) have been a notable trend, with larger entities acquiring innovative startups or complementary technology providers to expand their product portfolios and market reach. The concentration ratio is estimated to be around 55% for the top five players, with M&A volumes averaging approximately $500 million annually.
- Market Concentration: Moderately consolidated with significant market share held by key players.
- Innovation Drivers: Enhanced diagnostic accuracy, digital integration, AI capabilities, non-invasive technologies.
- Regulatory Impacts: Stringent approval processes, evolving data security standards, regional variations.
- Product Substitutes: AI diagnostic software, wearable diagnostic devices, advanced imaging techniques.
- End-User Segmentation: Ophthalmology clinics, optometry practices, hospitals, primary care, research institutions.
- M&A Trends: Strategic acquisitions of innovative technologies and market-share expansion.
Eye Testing Instrument Market Trends & Opportunities
The eye testing instrument market is poised for substantial growth, driven by a confluence of factors including an aging global population, increasing prevalence of eye diseases like glaucoma and cataracts, and a growing awareness of the importance of regular eye examinations. The market size is projected to expand from approximately $4 billion in 2024 to an estimated $7 billion by 2033, exhibiting a robust Compound Annual Growth Rate (CAGR) of approximately 6.5% over the forecast period. Technological advancements are a primary trend, with a significant shift towards digital and automated systems that enhance efficiency, reduce human error, and provide more precise diagnostic data. Artificial intelligence (AI) and machine learning (ML) are increasingly being integrated into eye testing instruments, offering advanced pattern recognition for early disease detection and personalized treatment recommendations. The demand for non-invasive diagnostic techniques is also on the rise, influencing the development of instruments that offer greater patient comfort and faster examination times.
Consumer preferences are evolving, with a greater emphasis on early detection and preventative eye care. This is supported by initiatives promoting routine eye screenings, especially in developing economies where access to specialized eye care is limited. The competitive landscape is characterized by intense innovation, with companies vying to introduce next-generation instruments that offer superior performance and integrated connectivity. Strategic partnerships and collaborations are becoming more common as companies aim to leverage each other's expertise and expand their global footprint. The market penetration rate for advanced diagnostic instruments in developed regions is expected to reach over 70% by 2033, while emerging markets present significant untapped potential, driven by increasing healthcare expenditure and improving infrastructure. The continuous development of novel imaging technologies, such as optical coherence tomography (OCT) advancements and multi-spectral fundus imaging, is also a significant market driver, enabling deeper insights into ocular structures and pathologies. The integration of telemedicine and remote diagnostics is another emergent trend, expanding the reach of eye care services and creating new opportunities for instrument manufacturers.
Dominant Markets & Segments in Eye Testing Instrument
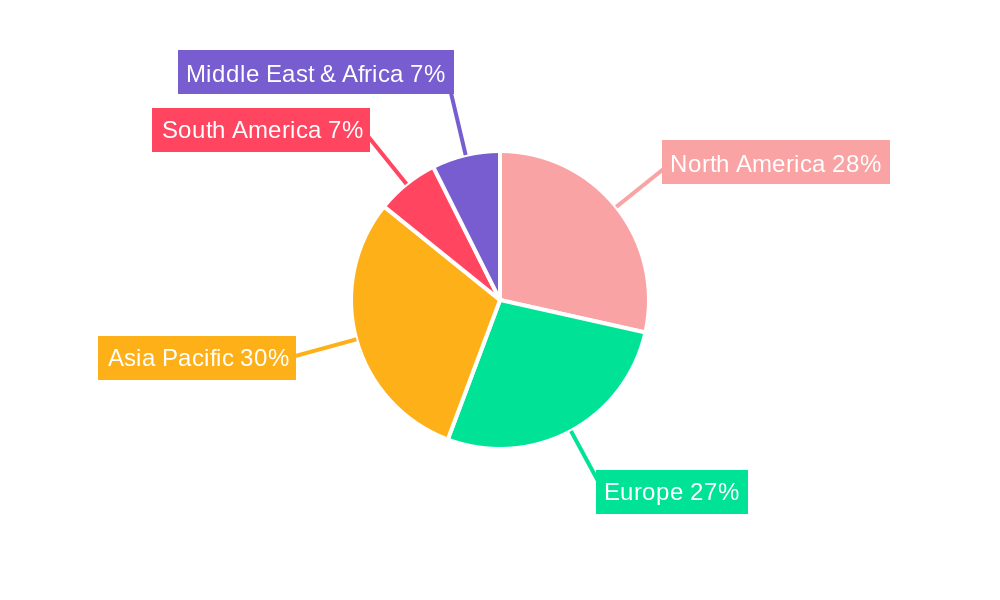
North America and Europe currently dominate the global eye testing instrument market, accounting for an estimated 65% of the market share in 2025. This dominance is attributable to several key factors, including high healthcare expenditure, advanced healthcare infrastructure, a high prevalence of age-related eye diseases, and a strong emphasis on preventative healthcare. Within these regions, countries like the United States, Germany, and the United Kingdom are key contributors, driven by robust research and development activities and the early adoption of innovative medical technologies. The Asia-Pacific region, however, is emerging as the fastest-growing market, propelled by rising disposable incomes, increasing awareness of eye health, a growing ophthalmologist base, and supportive government initiatives to improve healthcare access. Countries such as China and India are at the forefront of this growth.
- Dominant Region: North America (estimated 38% market share in 2025).
- Leading Country: United States (estimated 22% market share in 2025).
- Fastest Growing Region: Asia-Pacific.
In terms of application, Cataract and Glaucoma testing instruments represent the largest segments, driven by the high and increasing incidence of these conditions globally. The growing aging population directly correlates with the demand for diagnostic tools for these age-related diseases.
- Dominant Application Segment: Cataract Testing Instruments (estimated 32% market share in 2025).
- Key Growth Drivers for Cataract/Glaucoma Instruments: Aging population, increasing prevalence of eye diseases, advancements in early detection technologies.
- Other Significant Application Segments: Diabetic Retinopathy, Macular Degeneration, Refractive Errors.
By type, the Slit Lamp and Biometer segments hold significant market share due to their indispensable role in routine eye examinations and pre-operative assessments for cataract surgery.
- Dominant Type Segment: Slit Lamps (estimated 28% market share in 2025).
- Key Growth Drivers for Slit Lamps/Biometers: Essential for routine eye exams, critical for cataract surgery planning, increasing adoption of advanced imaging capabilities within slit lamps.
- High Growth Type Segments: Fundus Cameras, Perimeters, and Autorefractors and Keratometers, driven by technological advancements and the need for more comprehensive diagnostic capabilities. Fundus cameras, in particular, are seeing increased integration of AI for automated anomaly detection.
Eye Testing Instrument Product Analysis
The eye testing instrument market is characterized by continuous product innovation focused on enhanced diagnostic precision, patient comfort, and integrated digital solutions. Advanced slit lamps now incorporate high-resolution digital cameras and AI-powered analytics for more accurate detection of subtle ocular pathologies. Fundus cameras are evolving with wider fields of view and enhanced imaging modalities like OCT angiography, offering deeper insights into retinal vasculature and structural changes. Biometers are becoming more sophisticated, providing faster and more accurate measurements essential for refractive and cataract surgery planning. The competitive advantage lies in the development of portable, connected devices that facilitate telemedicine and streamline clinical workflows, meeting the growing demand for efficient and accessible eye care.
Key Drivers, Barriers & Challenges in Eye Testing Instrument
Key Drivers: The market is propelled by an escalating global burden of eye diseases, a rapidly aging population, increasing healthcare expenditure in emerging economies, and significant advancements in diagnostic technology, including AI integration and digital imaging. Growing awareness of preventive eye care also plays a crucial role.
Barriers & Challenges: Key challenges include stringent regulatory approvals for new medical devices, high research and development costs, the need for substantial initial capital investment for advanced instruments, and the potential for supply chain disruptions impacting global availability. Competitive price pressures and the rapid pace of technological obsolescence also pose significant hurdles for manufacturers.
Growth Drivers in the Eye Testing Instrument Market
Growth in the eye testing instrument market is primarily fueled by the increasing prevalence of age-related eye conditions such as cataracts and glaucoma, necessitating advanced diagnostic tools. Technological innovation, particularly the integration of Artificial Intelligence and machine learning into diagnostic devices, is a significant growth catalyst, enabling earlier and more accurate disease detection. Furthermore, rising disposable incomes and improving healthcare infrastructure in emerging economies are expanding access to eye care services, driving demand for diagnostic instruments. Government initiatives promoting eye health awareness and regular screenings also contribute to market expansion.
Challenges Impacting Eye Testing Instrument Growth
Despite robust growth drivers, the eye testing instrument market faces several challenges. Stringent and varied regulatory approval processes across different countries can delay market entry for new products. The high cost of research and development, coupled with the capital-intensive nature of manufacturing advanced medical devices, presents significant financial barriers. Supply chain vulnerabilities, amplified by global events, can disrupt production and distribution. Moreover, intense competition among established players and emerging innovators leads to price pressures, impacting profit margins and demanding continuous innovation to maintain market relevance.
Key Players Shaping the Eye Testing Instrument Market
- Essilor
- Carl Zeiss
- Topcon
- Canon
- Metall Zug Group
- Nidek
- Novartis
- BON Optic
- Heine Optotechnik
- Luneau Technology
Significant Eye Testing Instrument Industry Milestones
- 2019: Introduction of AI-powered diagnostic algorithms for glaucoma detection in fundus cameras.
- 2020: Launch of advanced swept-source OCT devices offering enhanced resolution and speed.
- 2021: Increased adoption of telemedicine-compatible eye testing instruments, facilitating remote diagnostics.
- 2022: Development of miniaturized and portable diagnostic devices for primary care settings.
- 2023: Major acquisitions of smaller innovative ophthalmic technology companies by larger market players.
- 2024: Further integration of cloud-based data management and AI analytics for comprehensive patient eye health monitoring.
Future Outlook for Eye Testing Instrument Market
The future outlook for the eye testing instrument market is exceptionally promising, driven by continuous technological innovation and a growing global demand for effective eye care solutions. The pervasive integration of AI and machine learning will revolutionize diagnostics, enabling earlier and more precise detection of a wider range of ocular conditions. The trend towards portable, connected devices will further democratize access to eye care, particularly in underserved regions, through telemedicine and remote monitoring capabilities. Strategic collaborations and M&A activities are expected to shape the competitive landscape, leading to more comprehensive product portfolios and expanded global reach. The market is poised for sustained growth, exceeding $7 billion by 2033.
Eye Testing Instrument Segmentation
-
1. Application
- 1.1. Glaucoma
- 1.2. Cataract
- 1.3. Other
-
2. Type
- 2.1. Slit Lamp
- 2.2. Biometer
- 2.3. Perimeter
- 2.4. Tonometer
- 2.5. Fundus Camera
- 2.6. Autorefractor and Keratometer
- 2.7. Other
Eye Testing Instrument Segmentation By Geography
-
1. North America
- 1.1. United States
- 1.2. Canada
- 1.3. Mexico
-
2. South America
- 2.1. Brazil
- 2.2. Argentina
- 2.3. Rest of South America
-
3. Europe
- 3.1. United Kingdom
- 3.2. Germany
- 3.3. France
- 3.4. Italy
- 3.5. Spain
- 3.6. Russia
- 3.7. Benelux
- 3.8. Nordics
- 3.9. Rest of Europe
-
4. Middle East & Africa
- 4.1. Turkey
- 4.2. Israel
- 4.3. GCC
- 4.4. North Africa
- 4.5. South Africa
- 4.6. Rest of Middle East & Africa
-
5. Asia Pacific
- 5.1. China
- 5.2. India
- 5.3. Japan
- 5.4. South Korea
- 5.5. ASEAN
- 5.6. Oceania
- 5.7. Rest of Asia Pacific
Eye Testing Instrument Regional Market Share
Geographic Coverage of Eye Testing Instrument
Eye Testing Instrument REPORT HIGHLIGHTS
| Aspects | Details |
|---|---|
| Study Period | 2020-2034 |
| Base Year | 2025 |
| Estimated Year | 2026 |
| Forecast Period | 2026-2034 |
| Historical Period | 2020-2025 |
| Growth Rate | CAGR of 5% from 2020-2034 |
| Segmentation |
|
Table of Contents
- 1. Introduction
- 1.1. Research Scope
- 1.2. Market Segmentation
- 1.3. Research Objective
- 1.4. Definitions and Assumptions
- 2. Executive Summary
- 2.1. Market Snapshot
- 3. Market Dynamics
- 3.1. Market Drivers
- 3.2. Market Restrains
- 3.3. Market Trends
- 3.4. Market Opportunities
- 4. Market Factor Analysis
- 4.1. Porters Five Forces
- 4.1.1. Bargaining Power of Suppliers
- 4.1.2. Bargaining Power of Buyers
- 4.1.3. Threat of New Entrants
- 4.1.4. Threat of Substitutes
- 4.1.5. Competitive Rivalry
- 4.2. PESTEL analysis
- 4.3. BCG Analysis
- 4.3.1. Stars (High Growth, High Market Share)
- 4.3.2. Cash Cows (Low Growth, High Market Share)
- 4.3.3. Question Mark (High Growth, Low Market Share)
- 4.3.4. Dogs (Low Growth, Low Market Share)
- 4.4. Ansoff Matrix Analysis
- 4.5. Supply Chain Analysis
- 4.6. Regulatory Landscape
- 4.7. Current Market Potential and Opportunity Assessment (TAM–SAM–SOM Framework)
- 4.8. TIR Analyst Note
- 4.1. Porters Five Forces
- 5. Market Analysis, Insights and Forecast 2021-2033
- 5.1. Market Analysis, Insights and Forecast - by Application
- 5.1.1. Glaucoma
- 5.1.2. Cataract
- 5.1.3. Other
- 5.2. Market Analysis, Insights and Forecast - by Type
- 5.2.1. Slit Lamp
- 5.2.2. Biometer
- 5.2.3. Perimeter
- 5.2.4. Tonometer
- 5.2.5. Fundus Camera
- 5.2.6. Autorefractor and Keratometer
- 5.2.7. Other
- 5.3. Market Analysis, Insights and Forecast - by Region
- 5.3.1. North America
- 5.3.2. South America
- 5.3.3. Europe
- 5.3.4. Middle East & Africa
- 5.3.5. Asia Pacific
- 5.1. Market Analysis, Insights and Forecast - by Application
- 6. Global Eye Testing Instrument Analysis, Insights and Forecast, 2021-2033
- 6.1. Market Analysis, Insights and Forecast - by Application
- 6.1.1. Glaucoma
- 6.1.2. Cataract
- 6.1.3. Other
- 6.2. Market Analysis, Insights and Forecast - by Type
- 6.2.1. Slit Lamp
- 6.2.2. Biometer
- 6.2.3. Perimeter
- 6.2.4. Tonometer
- 6.2.5. Fundus Camera
- 6.2.6. Autorefractor and Keratometer
- 6.2.7. Other
- 6.1. Market Analysis, Insights and Forecast - by Application
- 7. North America Eye Testing Instrument Analysis, Insights and Forecast, 2020-2032
- 7.1. Market Analysis, Insights and Forecast - by Application
- 7.1.1. Glaucoma
- 7.1.2. Cataract
- 7.1.3. Other
- 7.2. Market Analysis, Insights and Forecast - by Type
- 7.2.1. Slit Lamp
- 7.2.2. Biometer
- 7.2.3. Perimeter
- 7.2.4. Tonometer
- 7.2.5. Fundus Camera
- 7.2.6. Autorefractor and Keratometer
- 7.2.7. Other
- 7.1. Market Analysis, Insights and Forecast - by Application
- 8. South America Eye Testing Instrument Analysis, Insights and Forecast, 2020-2032
- 8.1. Market Analysis, Insights and Forecast - by Application
- 8.1.1. Glaucoma
- 8.1.2. Cataract
- 8.1.3. Other
- 8.2. Market Analysis, Insights and Forecast - by Type
- 8.2.1. Slit Lamp
- 8.2.2. Biometer
- 8.2.3. Perimeter
- 8.2.4. Tonometer
- 8.2.5. Fundus Camera
- 8.2.6. Autorefractor and Keratometer
- 8.2.7. Other
- 8.1. Market Analysis, Insights and Forecast - by Application
- 9. Europe Eye Testing Instrument Analysis, Insights and Forecast, 2020-2032
- 9.1. Market Analysis, Insights and Forecast - by Application
- 9.1.1. Glaucoma
- 9.1.2. Cataract
- 9.1.3. Other
- 9.2. Market Analysis, Insights and Forecast - by Type
- 9.2.1. Slit Lamp
- 9.2.2. Biometer
- 9.2.3. Perimeter
- 9.2.4. Tonometer
- 9.2.5. Fundus Camera
- 9.2.6. Autorefractor and Keratometer
- 9.2.7. Other
- 9.1. Market Analysis, Insights and Forecast - by Application
- 10. Middle East & Africa Eye Testing Instrument Analysis, Insights and Forecast, 2020-2032
- 10.1. Market Analysis, Insights and Forecast - by Application
- 10.1.1. Glaucoma
- 10.1.2. Cataract
- 10.1.3. Other
- 10.2. Market Analysis, Insights and Forecast - by Type
- 10.2.1. Slit Lamp
- 10.2.2. Biometer
- 10.2.3. Perimeter
- 10.2.4. Tonometer
- 10.2.5. Fundus Camera
- 10.2.6. Autorefractor and Keratometer
- 10.2.7. Other
- 10.1. Market Analysis, Insights and Forecast - by Application
- 11. Asia Pacific Eye Testing Instrument Analysis, Insights and Forecast, 2020-2032
- 11.1. Market Analysis, Insights and Forecast - by Application
- 11.1.1. Glaucoma
- 11.1.2. Cataract
- 11.1.3. Other
- 11.2. Market Analysis, Insights and Forecast - by Type
- 11.2.1. Slit Lamp
- 11.2.2. Biometer
- 11.2.3. Perimeter
- 11.2.4. Tonometer
- 11.2.5. Fundus Camera
- 11.2.6. Autorefractor and Keratometer
- 11.2.7. Other
- 11.1. Market Analysis, Insights and Forecast - by Application
- 12. Competitive Analysis
- 12.1. Company Profiles
- 12.1.1 Essilor
- 12.1.1.1. Company Overview
- 12.1.1.2. Products
- 12.1.1.3. Company Financials
- 12.1.1.4. SWOT Analysis
- 12.1.2 Carl Zeiss
- 12.1.2.1. Company Overview
- 12.1.2.2. Products
- 12.1.2.3. Company Financials
- 12.1.2.4. SWOT Analysis
- 12.1.3 Topcon
- 12.1.3.1. Company Overview
- 12.1.3.2. Products
- 12.1.3.3. Company Financials
- 12.1.3.4. SWOT Analysis
- 12.1.4 Canon
- 12.1.4.1. Company Overview
- 12.1.4.2. Products
- 12.1.4.3. Company Financials
- 12.1.4.4. SWOT Analysis
- 12.1.5 Metall Zug Group
- 12.1.5.1. Company Overview
- 12.1.5.2. Products
- 12.1.5.3. Company Financials
- 12.1.5.4. SWOT Analysis
- 12.1.6 Nidek
- 12.1.6.1. Company Overview
- 12.1.6.2. Products
- 12.1.6.3. Company Financials
- 12.1.6.4. SWOT Analysis
- 12.1.7 Novartis
- 12.1.7.1. Company Overview
- 12.1.7.2. Products
- 12.1.7.3. Company Financials
- 12.1.7.4. SWOT Analysis
- 12.1.8 BON Optic
- 12.1.8.1. Company Overview
- 12.1.8.2. Products
- 12.1.8.3. Company Financials
- 12.1.8.4. SWOT Analysis
- 12.1.9 Heine Optotechnik
- 12.1.9.1. Company Overview
- 12.1.9.2. Products
- 12.1.9.3. Company Financials
- 12.1.9.4. SWOT Analysis
- 12.1.10 Luneau Technology
- 12.1.10.1. Company Overview
- 12.1.10.2. Products
- 12.1.10.3. Company Financials
- 12.1.10.4. SWOT Analysis
- 12.1.1 Essilor
- 12.2. Market Entropy
- 12.2.1 Company's Key Areas Served
- 12.2.2 Recent Developments
- 12.3. Company Market Share Analysis 2025
- 12.3.1 Top 5 Companies Market Share Analysis
- 12.3.2 Top 3 Companies Market Share Analysis
- 12.4. List of Potential Customers
- 13. Research Methodology
List of Figures
- Figure 1: Global Eye Testing Instrument Revenue Breakdown (undefined, %) by Region 2025 & 2033
- Figure 2: Global Eye Testing Instrument Volume Breakdown (K, %) by Region 2025 & 2033
- Figure 3: North America Eye Testing Instrument Revenue (undefined), by Application 2025 & 2033
- Figure 4: North America Eye Testing Instrument Volume (K), by Application 2025 & 2033
- Figure 5: North America Eye Testing Instrument Revenue Share (%), by Application 2025 & 2033
- Figure 6: North America Eye Testing Instrument Volume Share (%), by Application 2025 & 2033
- Figure 7: North America Eye Testing Instrument Revenue (undefined), by Type 2025 & 2033
- Figure 8: North America Eye Testing Instrument Volume (K), by Type 2025 & 2033
- Figure 9: North America Eye Testing Instrument Revenue Share (%), by Type 2025 & 2033
- Figure 10: North America Eye Testing Instrument Volume Share (%), by Type 2025 & 2033
- Figure 11: North America Eye Testing Instrument Revenue (undefined), by Country 2025 & 2033
- Figure 12: North America Eye Testing Instrument Volume (K), by Country 2025 & 2033
- Figure 13: North America Eye Testing Instrument Revenue Share (%), by Country 2025 & 2033
- Figure 14: North America Eye Testing Instrument Volume Share (%), by Country 2025 & 2033
- Figure 15: South America Eye Testing Instrument Revenue (undefined), by Application 2025 & 2033
- Figure 16: South America Eye Testing Instrument Volume (K), by Application 2025 & 2033
- Figure 17: South America Eye Testing Instrument Revenue Share (%), by Application 2025 & 2033
- Figure 18: South America Eye Testing Instrument Volume Share (%), by Application 2025 & 2033
- Figure 19: South America Eye Testing Instrument Revenue (undefined), by Type 2025 & 2033
- Figure 20: South America Eye Testing Instrument Volume (K), by Type 2025 & 2033
- Figure 21: South America Eye Testing Instrument Revenue Share (%), by Type 2025 & 2033
- Figure 22: South America Eye Testing Instrument Volume Share (%), by Type 2025 & 2033
- Figure 23: South America Eye Testing Instrument Revenue (undefined), by Country 2025 & 2033
- Figure 24: South America Eye Testing Instrument Volume (K), by Country 2025 & 2033
- Figure 25: South America Eye Testing Instrument Revenue Share (%), by Country 2025 & 2033
- Figure 26: South America Eye Testing Instrument Volume Share (%), by Country 2025 & 2033
- Figure 27: Europe Eye Testing Instrument Revenue (undefined), by Application 2025 & 2033
- Figure 28: Europe Eye Testing Instrument Volume (K), by Application 2025 & 2033
- Figure 29: Europe Eye Testing Instrument Revenue Share (%), by Application 2025 & 2033
- Figure 30: Europe Eye Testing Instrument Volume Share (%), by Application 2025 & 2033
- Figure 31: Europe Eye Testing Instrument Revenue (undefined), by Type 2025 & 2033
- Figure 32: Europe Eye Testing Instrument Volume (K), by Type 2025 & 2033
- Figure 33: Europe Eye Testing Instrument Revenue Share (%), by Type 2025 & 2033
- Figure 34: Europe Eye Testing Instrument Volume Share (%), by Type 2025 & 2033
- Figure 35: Europe Eye Testing Instrument Revenue (undefined), by Country 2025 & 2033
- Figure 36: Europe Eye Testing Instrument Volume (K), by Country 2025 & 2033
- Figure 37: Europe Eye Testing Instrument Revenue Share (%), by Country 2025 & 2033
- Figure 38: Europe Eye Testing Instrument Volume Share (%), by Country 2025 & 2033
- Figure 39: Middle East & Africa Eye Testing Instrument Revenue (undefined), by Application 2025 & 2033
- Figure 40: Middle East & Africa Eye Testing Instrument Volume (K), by Application 2025 & 2033
- Figure 41: Middle East & Africa Eye Testing Instrument Revenue Share (%), by Application 2025 & 2033
- Figure 42: Middle East & Africa Eye Testing Instrument Volume Share (%), by Application 2025 & 2033
- Figure 43: Middle East & Africa Eye Testing Instrument Revenue (undefined), by Type 2025 & 2033
- Figure 44: Middle East & Africa Eye Testing Instrument Volume (K), by Type 2025 & 2033
- Figure 45: Middle East & Africa Eye Testing Instrument Revenue Share (%), by Type 2025 & 2033
- Figure 46: Middle East & Africa Eye Testing Instrument Volume Share (%), by Type 2025 & 2033
- Figure 47: Middle East & Africa Eye Testing Instrument Revenue (undefined), by Country 2025 & 2033
- Figure 48: Middle East & Africa Eye Testing Instrument Volume (K), by Country 2025 & 2033
- Figure 49: Middle East & Africa Eye Testing Instrument Revenue Share (%), by Country 2025 & 2033
- Figure 50: Middle East & Africa Eye Testing Instrument Volume Share (%), by Country 2025 & 2033
- Figure 51: Asia Pacific Eye Testing Instrument Revenue (undefined), by Application 2025 & 2033
- Figure 52: Asia Pacific Eye Testing Instrument Volume (K), by Application 2025 & 2033
- Figure 53: Asia Pacific Eye Testing Instrument Revenue Share (%), by Application 2025 & 2033
- Figure 54: Asia Pacific Eye Testing Instrument Volume Share (%), by Application 2025 & 2033
- Figure 55: Asia Pacific Eye Testing Instrument Revenue (undefined), by Type 2025 & 2033
- Figure 56: Asia Pacific Eye Testing Instrument Volume (K), by Type 2025 & 2033
- Figure 57: Asia Pacific Eye Testing Instrument Revenue Share (%), by Type 2025 & 2033
- Figure 58: Asia Pacific Eye Testing Instrument Volume Share (%), by Type 2025 & 2033
- Figure 59: Asia Pacific Eye Testing Instrument Revenue (undefined), by Country 2025 & 2033
- Figure 60: Asia Pacific Eye Testing Instrument Volume (K), by Country 2025 & 2033
- Figure 61: Asia Pacific Eye Testing Instrument Revenue Share (%), by Country 2025 & 2033
- Figure 62: Asia Pacific Eye Testing Instrument Volume Share (%), by Country 2025 & 2033
List of Tables
- Table 1: Global Eye Testing Instrument Revenue undefined Forecast, by Application 2020 & 2033
- Table 2: Global Eye Testing Instrument Volume K Forecast, by Application 2020 & 2033
- Table 3: Global Eye Testing Instrument Revenue undefined Forecast, by Type 2020 & 2033
- Table 4: Global Eye Testing Instrument Volume K Forecast, by Type 2020 & 2033
- Table 5: Global Eye Testing Instrument Revenue undefined Forecast, by Region 2020 & 2033
- Table 6: Global Eye Testing Instrument Volume K Forecast, by Region 2020 & 2033
- Table 7: Global Eye Testing Instrument Revenue undefined Forecast, by Application 2020 & 2033
- Table 8: Global Eye Testing Instrument Volume K Forecast, by Application 2020 & 2033
- Table 9: Global Eye Testing Instrument Revenue undefined Forecast, by Type 2020 & 2033
- Table 10: Global Eye Testing Instrument Volume K Forecast, by Type 2020 & 2033
- Table 11: Global Eye Testing Instrument Revenue undefined Forecast, by Country 2020 & 2033
- Table 12: Global Eye Testing Instrument Volume K Forecast, by Country 2020 & 2033
- Table 13: United States Eye Testing Instrument Revenue (undefined) Forecast, by Application 2020 & 2033
- Table 14: United States Eye Testing Instrument Volume (K) Forecast, by Application 2020 & 2033
- Table 15: Canada Eye Testing Instrument Revenue (undefined) Forecast, by Application 2020 & 2033
- Table 16: Canada Eye Testing Instrument Volume (K) Forecast, by Application 2020 & 2033
- Table 17: Mexico Eye Testing Instrument Revenue (undefined) Forecast, by Application 2020 & 2033
- Table 18: Mexico Eye Testing Instrument Volume (K) Forecast, by Application 2020 & 2033
- Table 19: Global Eye Testing Instrument Revenue undefined Forecast, by Application 2020 & 2033
- Table 20: Global Eye Testing Instrument Volume K Forecast, by Application 2020 & 2033
- Table 21: Global Eye Testing Instrument Revenue undefined Forecast, by Type 2020 & 2033
- Table 22: Global Eye Testing Instrument Volume K Forecast, by Type 2020 & 2033
- Table 23: Global Eye Testing Instrument Revenue undefined Forecast, by Country 2020 & 2033
- Table 24: Global Eye Testing Instrument Volume K Forecast, by Country 2020 & 2033
- Table 25: Brazil Eye Testing Instrument Revenue (undefined) Forecast, by Application 2020 & 2033
- Table 26: Brazil Eye Testing Instrument Volume (K) Forecast, by Application 2020 & 2033
- Table 27: Argentina Eye Testing Instrument Revenue (undefined) Forecast, by Application 2020 & 2033
- Table 28: Argentina Eye Testing Instrument Volume (K) Forecast, by Application 2020 & 2033
- Table 29: Rest of South America Eye Testing Instrument Revenue (undefined) Forecast, by Application 2020 & 2033
- Table 30: Rest of South America Eye Testing Instrument Volume (K) Forecast, by Application 2020 & 2033
- Table 31: Global Eye Testing Instrument Revenue undefined Forecast, by Application 2020 & 2033
- Table 32: Global Eye Testing Instrument Volume K Forecast, by Application 2020 & 2033
- Table 33: Global Eye Testing Instrument Revenue undefined Forecast, by Type 2020 & 2033
- Table 34: Global Eye Testing Instrument Volume K Forecast, by Type 2020 & 2033
- Table 35: Global Eye Testing Instrument Revenue undefined Forecast, by Country 2020 & 2033
- Table 36: Global Eye Testing Instrument Volume K Forecast, by Country 2020 & 2033
- Table 37: United Kingdom Eye Testing Instrument Revenue (undefined) Forecast, by Application 2020 & 2033
- Table 38: United Kingdom Eye Testing Instrument Volume (K) Forecast, by Application 2020 & 2033
- Table 39: Germany Eye Testing Instrument Revenue (undefined) Forecast, by Application 2020 & 2033
- Table 40: Germany Eye Testing Instrument Volume (K) Forecast, by Application 2020 & 2033
- Table 41: France Eye Testing Instrument Revenue (undefined) Forecast, by Application 2020 & 2033
- Table 42: France Eye Testing Instrument Volume (K) Forecast, by Application 2020 & 2033
- Table 43: Italy Eye Testing Instrument Revenue (undefined) Forecast, by Application 2020 & 2033
- Table 44: Italy Eye Testing Instrument Volume (K) Forecast, by Application 2020 & 2033
- Table 45: Spain Eye Testing Instrument Revenue (undefined) Forecast, by Application 2020 & 2033
- Table 46: Spain Eye Testing Instrument Volume (K) Forecast, by Application 2020 & 2033
- Table 47: Russia Eye Testing Instrument Revenue (undefined) Forecast, by Application 2020 & 2033
- Table 48: Russia Eye Testing Instrument Volume (K) Forecast, by Application 2020 & 2033
- Table 49: Benelux Eye Testing Instrument Revenue (undefined) Forecast, by Application 2020 & 2033
- Table 50: Benelux Eye Testing Instrument Volume (K) Forecast, by Application 2020 & 2033
- Table 51: Nordics Eye Testing Instrument Revenue (undefined) Forecast, by Application 2020 & 2033
- Table 52: Nordics Eye Testing Instrument Volume (K) Forecast, by Application 2020 & 2033
- Table 53: Rest of Europe Eye Testing Instrument Revenue (undefined) Forecast, by Application 2020 & 2033
- Table 54: Rest of Europe Eye Testing Instrument Volume (K) Forecast, by Application 2020 & 2033
- Table 55: Global Eye Testing Instrument Revenue undefined Forecast, by Application 2020 & 2033
- Table 56: Global Eye Testing Instrument Volume K Forecast, by Application 2020 & 2033
- Table 57: Global Eye Testing Instrument Revenue undefined Forecast, by Type 2020 & 2033
- Table 58: Global Eye Testing Instrument Volume K Forecast, by Type 2020 & 2033
- Table 59: Global Eye Testing Instrument Revenue undefined Forecast, by Country 2020 & 2033
- Table 60: Global Eye Testing Instrument Volume K Forecast, by Country 2020 & 2033
- Table 61: Turkey Eye Testing Instrument Revenue (undefined) Forecast, by Application 2020 & 2033
- Table 62: Turkey Eye Testing Instrument Volume (K) Forecast, by Application 2020 & 2033
- Table 63: Israel Eye Testing Instrument Revenue (undefined) Forecast, by Application 2020 & 2033
- Table 64: Israel Eye Testing Instrument Volume (K) Forecast, by Application 2020 & 2033
- Table 65: GCC Eye Testing Instrument Revenue (undefined) Forecast, by Application 2020 & 2033
- Table 66: GCC Eye Testing Instrument Volume (K) Forecast, by Application 2020 & 2033
- Table 67: North Africa Eye Testing Instrument Revenue (undefined) Forecast, by Application 2020 & 2033
- Table 68: North Africa Eye Testing Instrument Volume (K) Forecast, by Application 2020 & 2033
- Table 69: South Africa Eye Testing Instrument Revenue (undefined) Forecast, by Application 2020 & 2033
- Table 70: South Africa Eye Testing Instrument Volume (K) Forecast, by Application 2020 & 2033
- Table 71: Rest of Middle East & Africa Eye Testing Instrument Revenue (undefined) Forecast, by Application 2020 & 2033
- Table 72: Rest of Middle East & Africa Eye Testing Instrument Volume (K) Forecast, by Application 2020 & 2033
- Table 73: Global Eye Testing Instrument Revenue undefined Forecast, by Application 2020 & 2033
- Table 74: Global Eye Testing Instrument Volume K Forecast, by Application 2020 & 2033
- Table 75: Global Eye Testing Instrument Revenue undefined Forecast, by Type 2020 & 2033
- Table 76: Global Eye Testing Instrument Volume K Forecast, by Type 2020 & 2033
- Table 77: Global Eye Testing Instrument Revenue undefined Forecast, by Country 2020 & 2033
- Table 78: Global Eye Testing Instrument Volume K Forecast, by Country 2020 & 2033
- Table 79: China Eye Testing Instrument Revenue (undefined) Forecast, by Application 2020 & 2033
- Table 80: China Eye Testing Instrument Volume (K) Forecast, by Application 2020 & 2033
- Table 81: India Eye Testing Instrument Revenue (undefined) Forecast, by Application 2020 & 2033
- Table 82: India Eye Testing Instrument Volume (K) Forecast, by Application 2020 & 2033
- Table 83: Japan Eye Testing Instrument Revenue (undefined) Forecast, by Application 2020 & 2033
- Table 84: Japan Eye Testing Instrument Volume (K) Forecast, by Application 2020 & 2033
- Table 85: South Korea Eye Testing Instrument Revenue (undefined) Forecast, by Application 2020 & 2033
- Table 86: South Korea Eye Testing Instrument Volume (K) Forecast, by Application 2020 & 2033
- Table 87: ASEAN Eye Testing Instrument Revenue (undefined) Forecast, by Application 2020 & 2033
- Table 88: ASEAN Eye Testing Instrument Volume (K) Forecast, by Application 2020 & 2033
- Table 89: Oceania Eye Testing Instrument Revenue (undefined) Forecast, by Application 2020 & 2033
- Table 90: Oceania Eye Testing Instrument Volume (K) Forecast, by Application 2020 & 2033
- Table 91: Rest of Asia Pacific Eye Testing Instrument Revenue (undefined) Forecast, by Application 2020 & 2033
- Table 92: Rest of Asia Pacific Eye Testing Instrument Volume (K) Forecast, by Application 2020 & 2033
Frequently Asked Questions
1. What is the projected Compound Annual Growth Rate (CAGR) of the Eye Testing Instrument?
The projected CAGR is approximately 5%.
2. Which companies are prominent players in the Eye Testing Instrument?
Key companies in the market include Essilor, Carl Zeiss, Topcon, Canon, Metall Zug Group, Nidek, Novartis, BON Optic, Heine Optotechnik, Luneau Technology.
3. What are the main segments of the Eye Testing Instrument?
The market segments include Application, Type.
4. Can you provide details about the market size?
The market size is estimated to be USD XXX N/A as of 2022.
5. What are some drivers contributing to market growth?
N/A
6. What are the notable trends driving market growth?
N/A
7. Are there any restraints impacting market growth?
N/A
8. Can you provide examples of recent developments in the market?
N/A
9. What pricing options are available for accessing the report?
Pricing options include single-user, multi-user, and enterprise licenses priced at USD 3950.00, USD 5925.00, and USD 7900.00 respectively.
10. Is the market size provided in terms of value or volume?
The market size is provided in terms of value, measured in N/A and volume, measured in K.
11. Are there any specific market keywords associated with the report?
Yes, the market keyword associated with the report is "Eye Testing Instrument," which aids in identifying and referencing the specific market segment covered.
12. How do I determine which pricing option suits my needs best?
The pricing options vary based on user requirements and access needs. Individual users may opt for single-user licenses, while businesses requiring broader access may choose multi-user or enterprise licenses for cost-effective access to the report.
13. Are there any additional resources or data provided in the Eye Testing Instrument report?
While the report offers comprehensive insights, it's advisable to review the specific contents or supplementary materials provided to ascertain if additional resources or data are available.
14. How can I stay updated on further developments or reports in the Eye Testing Instrument?
To stay informed about further developments, trends, and reports in the Eye Testing Instrument, consider subscribing to industry newsletters, following relevant companies and organizations, or regularly checking reputable industry news sources and publications.
Methodology
Step 1 - Identification of Relevant Samples Size from Population Database


Step 2 - Approaches for Defining Global Market Size (Value, Volume* & Price*)

Note*: In applicable scenarios
Step 3 - Data Sources
Primary Research
- Web Analytics
- Survey Reports
- Research Institute
- Latest Research Reports
- Opinion Leaders
Secondary Research
- Annual Reports
- White Paper
- Latest Press Release
- Industry Association
- Paid Database
- Investor Presentations

Step 4 - Data Triangulation
Involves using different sources of information in order to increase the validity of a study
These sources are likely to be stakeholders in a program - participants, other researchers, program staff, other community members, and so on.
Then we put all data in single framework & apply various statistical tools to find out the dynamic on the market.
During the analysis stage, feedback from the stakeholder groups would be compared to determine areas of agreement as well as areas of divergence