

Key Insights
The Femtech market, valued at $7.48 billion in 2025, is experiencing robust growth, projected to expand at a Compound Annual Growth Rate (CAGR) of 14.42% from 2025 to 2033. This expansion is driven by several key factors. Increasing awareness of women's health issues, coupled with technological advancements leading to the development of innovative devices, software, and services, are significantly contributing to market growth. Furthermore, the rising adoption of telehealth and remote patient monitoring solutions, particularly amplified by recent global events, is accelerating market penetration. The market's segmentation reflects its diverse applications, with reproductive health, pregnancy & nursing care, and pelvic & uterine healthcare representing significant segments. Growth is further fueled by an increasing number of women actively managing their health, a growing preference for non-invasive diagnostic tools and personalized healthcare solutions, and the expanding access to funding and investment in Femtech startups. This is creating a dynamic and competitive landscape with both established players and emerging innovative companies vying for market share.
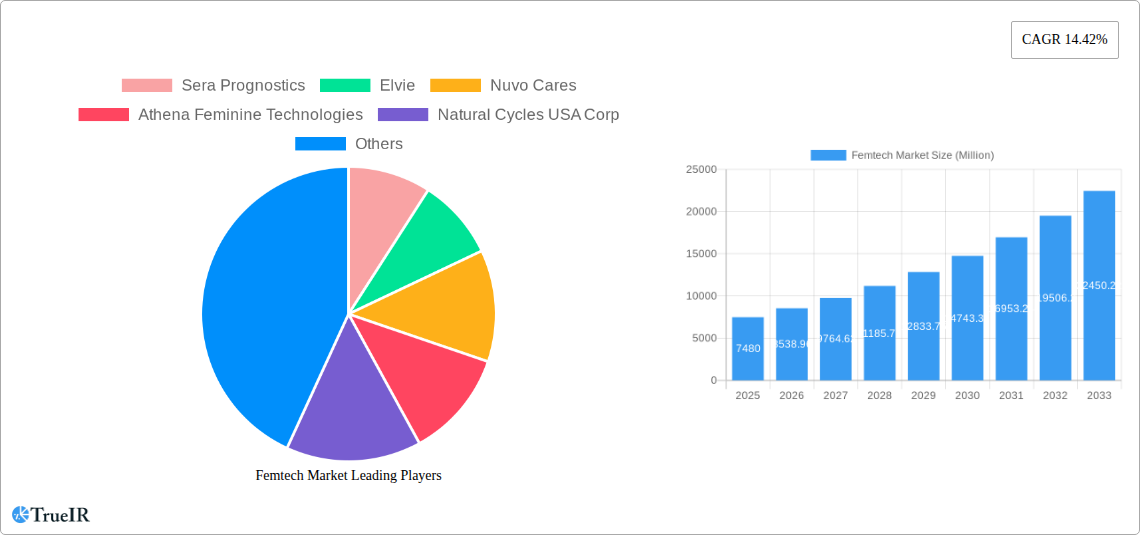
Femtech Market Market Size (In Billion)
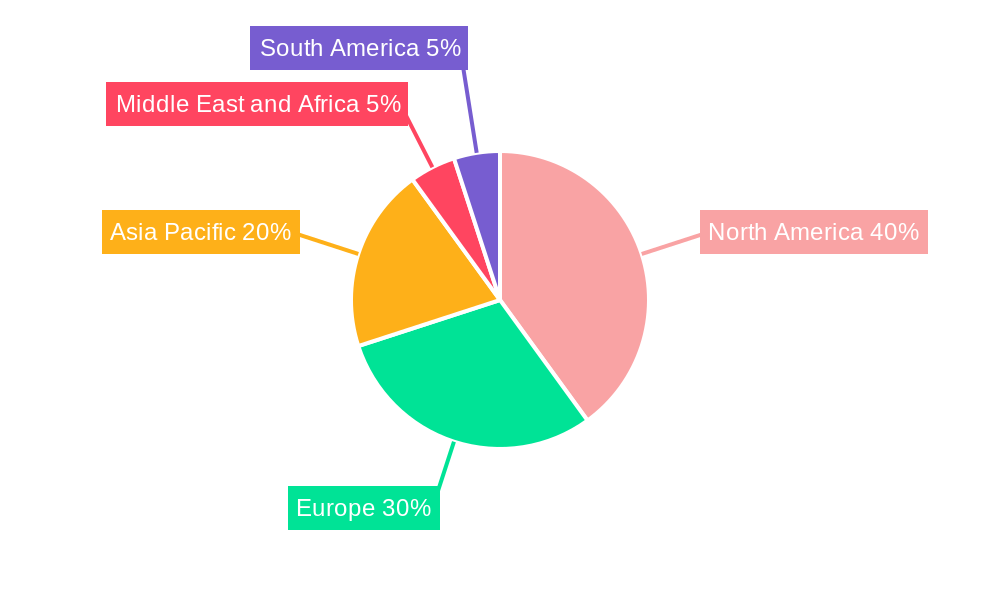
Geographical distribution reveals North America currently holds a significant share of the Femtech market, driven by strong healthcare infrastructure, high disposable incomes, and early adoption of new technologies. However, the Asia-Pacific region is expected to witness significant growth in the coming years, fuelled by rising healthcare expenditure, growing awareness among women about their health, and increasing internet penetration. Europe is also a substantial market, characterized by stringent regulatory frameworks and a growing demand for advanced healthcare solutions. The competitive landscape is populated by a mix of large established medical technology companies and agile, innovative Femtech startups. Competition is based on technological innovation, product differentiation, and strategic partnerships, with a focus on developing user-friendly, data-driven solutions that improve women's health outcomes.
Femtech Market Company Market Share
Femtech Market: A Comprehensive Report (2019-2033)
This dynamic report provides an in-depth analysis of the burgeoning Femtech market, projecting a robust growth trajectory fueled by technological advancements, shifting consumer preferences, and increasing awareness of women's health needs. The study period spans from 2019 to 2033, with 2025 serving as the base and estimated year. The report leverages extensive market research to offer invaluable insights for investors, entrepreneurs, and industry stakeholders. Expect detailed analysis across key segments, competitive landscapes, and future market projections, all supported by robust quantitative data. The market is expected to reach xx Million by 2033.
Femtech Market Structure & Competitive Landscape
The Femtech market exhibits a moderately concentrated landscape, with several key players vying for market share. While a few dominant companies control significant portions, a multitude of smaller, innovative startups are rapidly emerging. The market's structure is shaped by continuous innovation, stringent regulatory landscapes varying by region, and the presence of substitute products (e.g., traditional healthcare practices). Mergers and acquisitions (M&A) activity is relatively high, reflecting the consolidation and expansion strategies of major players. The concentration ratio (CR4) is estimated at xx%, indicating a moderately concentrated market. M&A volume in the past five years totaled approximately xx deals, with a significant increase observed in recent years driven by the pursuit of new technologies and expanded market reach.
- Key Market Concentration Drivers: Technological advancements, regulatory changes, and strategic acquisitions.
- End-User Segmentation: Hospitals, fertility clinics, and other healthcare providers constitute the primary end-users, with a growing segment of direct-to-consumer sales.
- Innovation and Regulatory Impact: The continuous influx of innovative products and services is offset by the complexities and variations in regulatory approvals across different regions, presenting both opportunities and challenges for market players.
Femtech Market Trends & Opportunities
The global Femtech market is experiencing exponential growth, driven by a confluence of factors. The market size is projected to reach xx Million by 2025, expanding at a Compound Annual Growth Rate (CAGR) of xx% during the forecast period (2025-2033). This growth is propelled by increasing technological sophistication, particularly in areas such as AI-powered diagnostic tools and wearable sensors. Consumer preferences are shifting toward convenient, personalized, and digitally accessible healthcare solutions. This trend is further amplified by growing awareness of women's health concerns and a rising demand for improved healthcare services. The market penetration rate is expected to reach xx% by 2033. Competitive dynamics are characterized by innovation, strategic partnerships, and the emergence of new players.
Dominant Markets & Segments in Femtech Market
The North American region currently dominates the Femtech market, driven by high healthcare expenditure, advanced technological infrastructure, and supportive regulatory frameworks. However, Asia-Pacific is poised for significant growth due to its large population base and rising disposable incomes. Within the segments:
- By Type: The Devices segment currently holds the largest market share, followed by Software and Services. Growth drivers include the introduction of advanced wearable technologies and sophisticated diagnostic tools.
- By Application: Reproductive health and pregnancy & nursing care represent the most significant application segments, propelled by high demand and rising awareness.
- By End User: Hospitals and fertility clinics are the major end-users, but the direct-to-consumer segment is growing rapidly.
- Key Growth Drivers: Increased awareness of women's health, technological advancements, supportive government policies, and improved healthcare infrastructure are all contributing to market expansion.
Femtech Market Product Analysis
The Femtech market showcases a diverse array of products, including wearable health trackers, fertility monitoring apps, digital therapeutics for menstrual cycle management, and telehealth platforms offering virtual consultations. These products leverage technological advancements in areas such as artificial intelligence, machine learning, and sensor technology to offer personalized and convenient solutions for women's healthcare needs. Successful products are characterized by their efficacy, user-friendliness, and seamless integration with existing healthcare ecosystems.
Key Drivers, Barriers & Challenges in Femtech Market
Key Drivers: The market is propelled by the growing awareness of women's health, technological advancements enabling personalized healthcare, increased access to digital health tools, and supportive government initiatives promoting women's wellness. Economic factors such as rising disposable incomes and increased healthcare spending also play a significant role.
Challenges: Regulatory hurdles, particularly concerning data privacy and device approval, pose a significant challenge. Supply chain disruptions and competition from established healthcare companies also impact growth. The quantifiable impact of these challenges is estimated to reduce market growth by approximately xx% annually.
Growth Drivers in the Femtech Market Market
Technological innovation, rising awareness of women's health issues, increasing healthcare expenditure, and supportive government policies are major drivers. Specific examples include the development of AI-powered diagnostic tools, the rise of telehealth platforms, and government initiatives aimed at improving access to women's healthcare.
Challenges Impacting Femtech Market Growth
Regulatory uncertainties around data privacy and device approvals create significant barriers. Supply chain disruptions, particularly concerning electronic components and raw materials, impact manufacturing. Intense competition from established players and the need for robust clinical evidence also present challenges.
Key Players Shaping the Femtech Market Market
- Sera Prognostics
- Elvie
- Nuvo Cares
- Athena Feminine Technologies
- Natural Cycles USA Corp
- iSono Health
- HeraMED
- NUROKOR LIMITED
- Flo Health Inc
- Canopie
Significant Femtech Market Industry Milestones
- September 2022: Embr Labs launched Embr Wave 2, a wearable device for menopause hot flash relief, expanding market options.
- November 2022: The FemTech Hub, a physical innovation space, opened in London, fostering community and collaboration.
Future Outlook for Femtech Market Market
The Femtech market is poised for continued expansion, driven by ongoing technological advancements, increased consumer awareness, and supportive regulatory environments. Strategic partnerships and acquisitions will likely shape the competitive landscape, while an increased focus on data security and personalized solutions will drive product innovation. Significant market potential exists in emerging economies with growing middle classes and improving healthcare infrastructure.
Femtech Market Segmentation
-
1. Type
- 1.1. Devices
- 1.2. Software
- 1.3. Services
-
2. Application
- 2.1. Reproductive Health
- 2.2. Pregnancy & Nursing care
- 2.3. Pelvic & Uterine Healthcare
- 2.4. General Healthcare & Wellness
- 2.5. Others
-
3. End User
- 3.1. Hospitals
- 3.2. Fertility Clinics
- 3.3. Others
Femtech Market Segmentation By Geography
-
1. North America
- 1.1. United States
- 1.2. Canada
- 1.3. Mexico
-
2. Europe
- 2.1. Germany
- 2.2. United Kingdom
- 2.3. France
- 2.4. Italy
- 2.5. Spain
- 2.6. Rest of Europe
-
3. Asia Pacific
- 3.1. China
- 3.2. Japan
- 3.3. India
- 3.4. Australia
- 3.5. South Korea
- 3.6. Rest of Asia Pacific
-
4. Middle East and Africa
- 4.1. GCC
- 4.2. South Africa
- 4.3. Rest of Middle East and Africa
-
5. South America
- 5.1. Brazil
- 5.2. Argentina
- 5.3. Rest of South America
Femtech Market Regional Market Share
Geographic Coverage of Femtech Market
Femtech Market REPORT HIGHLIGHTS
| Aspects | Details |
|---|---|
| Study Period | 2020-2034 |
| Base Year | 2025 |
| Estimated Year | 2026 |
| Forecast Period | 2026-2034 |
| Historical Period | 2020-2025 |
| Growth Rate | CAGR of 14.42% from 2020-2034 |
| Segmentation |
|
Table of Contents
- 1. Introduction
- 1.1. Research Scope
- 1.2. Market Segmentation
- 1.3. Research Objective
- 1.4. Definitions and Assumptions
- 2. Executive Summary
- 2.1. Market Snapshot
- 3. Market Dynamics
- 3.1. Market Drivers
- 3.2. Market Restrains
- 3.3. Market Trends
- 3.4. Market Opportunities
- 4. Market Factor Analysis
- 4.1. Porters Five Forces
- 4.1.1. Bargaining Power of Suppliers
- 4.1.2. Bargaining Power of Buyers
- 4.1.3. Threat of New Entrants
- 4.1.4. Threat of Substitutes
- 4.1.5. Competitive Rivalry
- 4.2. PESTEL analysis
- 4.3. BCG Analysis
- 4.3.1. Stars (High Growth, High Market Share)
- 4.3.2. Cash Cows (Low Growth, High Market Share)
- 4.3.3. Question Mark (High Growth, Low Market Share)
- 4.3.4. Dogs (Low Growth, Low Market Share)
- 4.4. Ansoff Matrix Analysis
- 4.5. Supply Chain Analysis
- 4.6. Regulatory Landscape
- 4.7. Current Market Potential and Opportunity Assessment (TAM–SAM–SOM Framework)
- 4.8. TIR Analyst Note
- 4.1. Porters Five Forces
- 5. Market Analysis, Insights and Forecast 2021-2033
- 5.1. Market Analysis, Insights and Forecast - by Type
- 5.1.1. Devices
- 5.1.2. Software
- 5.1.3. Services
- 5.2. Market Analysis, Insights and Forecast - by Application
- 5.2.1. Reproductive Health
- 5.2.2. Pregnancy & Nursing care
- 5.2.3. Pelvic & Uterine Healthcare
- 5.2.4. General Healthcare & Wellness
- 5.2.5. Others
- 5.3. Market Analysis, Insights and Forecast - by End User
- 5.3.1. Hospitals
- 5.3.2. Fertility Clinics
- 5.3.3. Others
- 5.4. Market Analysis, Insights and Forecast - by Region
- 5.4.1. North America
- 5.4.2. Europe
- 5.4.3. Asia Pacific
- 5.4.4. Middle East and Africa
- 5.4.5. South America
- 5.1. Market Analysis, Insights and Forecast - by Type
- 6. Global Femtech Market Analysis, Insights and Forecast, 2021-2033
- 6.1. Market Analysis, Insights and Forecast - by Type
- 6.1.1. Devices
- 6.1.2. Software
- 6.1.3. Services
- 6.2. Market Analysis, Insights and Forecast - by Application
- 6.2.1. Reproductive Health
- 6.2.2. Pregnancy & Nursing care
- 6.2.3. Pelvic & Uterine Healthcare
- 6.2.4. General Healthcare & Wellness
- 6.2.5. Others
- 6.3. Market Analysis, Insights and Forecast - by End User
- 6.3.1. Hospitals
- 6.3.2. Fertility Clinics
- 6.3.3. Others
- 6.1. Market Analysis, Insights and Forecast - by Type
- 7. North America Femtech Market Analysis, Insights and Forecast, 2020-2032
- 7.1. Market Analysis, Insights and Forecast - by Type
- 7.1.1. Devices
- 7.1.2. Software
- 7.1.3. Services
- 7.2. Market Analysis, Insights and Forecast - by Application
- 7.2.1. Reproductive Health
- 7.2.2. Pregnancy & Nursing care
- 7.2.3. Pelvic & Uterine Healthcare
- 7.2.4. General Healthcare & Wellness
- 7.2.5. Others
- 7.3. Market Analysis, Insights and Forecast - by End User
- 7.3.1. Hospitals
- 7.3.2. Fertility Clinics
- 7.3.3. Others
- 7.1. Market Analysis, Insights and Forecast - by Type
- 8. Europe Femtech Market Analysis, Insights and Forecast, 2020-2032
- 8.1. Market Analysis, Insights and Forecast - by Type
- 8.1.1. Devices
- 8.1.2. Software
- 8.1.3. Services
- 8.2. Market Analysis, Insights and Forecast - by Application
- 8.2.1. Reproductive Health
- 8.2.2. Pregnancy & Nursing care
- 8.2.3. Pelvic & Uterine Healthcare
- 8.2.4. General Healthcare & Wellness
- 8.2.5. Others
- 8.3. Market Analysis, Insights and Forecast - by End User
- 8.3.1. Hospitals
- 8.3.2. Fertility Clinics
- 8.3.3. Others
- 8.1. Market Analysis, Insights and Forecast - by Type
- 9. Asia Pacific Femtech Market Analysis, Insights and Forecast, 2020-2032
- 9.1. Market Analysis, Insights and Forecast - by Type
- 9.1.1. Devices
- 9.1.2. Software
- 9.1.3. Services
- 9.2. Market Analysis, Insights and Forecast - by Application
- 9.2.1. Reproductive Health
- 9.2.2. Pregnancy & Nursing care
- 9.2.3. Pelvic & Uterine Healthcare
- 9.2.4. General Healthcare & Wellness
- 9.2.5. Others
- 9.3. Market Analysis, Insights and Forecast - by End User
- 9.3.1. Hospitals
- 9.3.2. Fertility Clinics
- 9.3.3. Others
- 9.1. Market Analysis, Insights and Forecast - by Type
- 10. Middle East and Africa Femtech Market Analysis, Insights and Forecast, 2020-2032
- 10.1. Market Analysis, Insights and Forecast - by Type
- 10.1.1. Devices
- 10.1.2. Software
- 10.1.3. Services
- 10.2. Market Analysis, Insights and Forecast - by Application
- 10.2.1. Reproductive Health
- 10.2.2. Pregnancy & Nursing care
- 10.2.3. Pelvic & Uterine Healthcare
- 10.2.4. General Healthcare & Wellness
- 10.2.5. Others
- 10.3. Market Analysis, Insights and Forecast - by End User
- 10.3.1. Hospitals
- 10.3.2. Fertility Clinics
- 10.3.3. Others
- 10.1. Market Analysis, Insights and Forecast - by Type
- 11. South America Femtech Market Analysis, Insights and Forecast, 2020-2032
- 11.1. Market Analysis, Insights and Forecast - by Type
- 11.1.1. Devices
- 11.1.2. Software
- 11.1.3. Services
- 11.2. Market Analysis, Insights and Forecast - by Application
- 11.2.1. Reproductive Health
- 11.2.2. Pregnancy & Nursing care
- 11.2.3. Pelvic & Uterine Healthcare
- 11.2.4. General Healthcare & Wellness
- 11.2.5. Others
- 11.3. Market Analysis, Insights and Forecast - by End User
- 11.3.1. Hospitals
- 11.3.2. Fertility Clinics
- 11.3.3. Others
- 11.1. Market Analysis, Insights and Forecast - by Type
- 12. Competitive Analysis
- 12.1. Company Profiles
- 12.1.1 Sera Prognostics
- 12.1.1.1. Company Overview
- 12.1.1.2. Products
- 12.1.1.3. Company Financials
- 12.1.1.4. SWOT Analysis
- 12.1.2 Elvie
- 12.1.2.1. Company Overview
- 12.1.2.2. Products
- 12.1.2.3. Company Financials
- 12.1.2.4. SWOT Analysis
- 12.1.3 Nuvo Cares
- 12.1.3.1. Company Overview
- 12.1.3.2. Products
- 12.1.3.3. Company Financials
- 12.1.3.4. SWOT Analysis
- 12.1.4 Athena Feminine Technologies
- 12.1.4.1. Company Overview
- 12.1.4.2. Products
- 12.1.4.3. Company Financials
- 12.1.4.4. SWOT Analysis
- 12.1.5 Natural Cycles USA Corp
- 12.1.5.1. Company Overview
- 12.1.5.2. Products
- 12.1.5.3. Company Financials
- 12.1.5.4. SWOT Analysis
- 12.1.6 iSono Health
- 12.1.6.1. Company Overview
- 12.1.6.2. Products
- 12.1.6.3. Company Financials
- 12.1.6.4. SWOT Analysis
- 12.1.7 HeraMED
- 12.1.7.1. Company Overview
- 12.1.7.2. Products
- 12.1.7.3. Company Financials
- 12.1.7.4. SWOT Analysis
- 12.1.8 NUROKOR LIMITED
- 12.1.8.1. Company Overview
- 12.1.8.2. Products
- 12.1.8.3. Company Financials
- 12.1.8.4. SWOT Analysis
- 12.1.9 Flo Health Inc
- 12.1.9.1. Company Overview
- 12.1.9.2. Products
- 12.1.9.3. Company Financials
- 12.1.9.4. SWOT Analysis
- 12.1.10 Canopie
- 12.1.10.1. Company Overview
- 12.1.10.2. Products
- 12.1.10.3. Company Financials
- 12.1.10.4. SWOT Analysis
- 12.1.1 Sera Prognostics
- 12.2. Market Entropy
- 12.2.1 Company's Key Areas Served
- 12.2.2 Recent Developments
- 12.3. Company Market Share Analysis 2025
- 12.3.1 Top 5 Companies Market Share Analysis
- 12.3.2 Top 3 Companies Market Share Analysis
- 12.4. List of Potential Customers
- 13. Research Methodology
List of Figures
- Figure 1: Global Femtech Market Revenue Breakdown (Million, %) by Region 2025 & 2033
- Figure 2: Global Femtech Market Volume Breakdown (K Unit, %) by Region 2025 & 2033
- Figure 3: North America Femtech Market Revenue (Million), by Type 2025 & 2033
- Figure 4: North America Femtech Market Volume (K Unit), by Type 2025 & 2033
- Figure 5: North America Femtech Market Revenue Share (%), by Type 2025 & 2033
- Figure 6: North America Femtech Market Volume Share (%), by Type 2025 & 2033
- Figure 7: North America Femtech Market Revenue (Million), by Application 2025 & 2033
- Figure 8: North America Femtech Market Volume (K Unit), by Application 2025 & 2033
- Figure 9: North America Femtech Market Revenue Share (%), by Application 2025 & 2033
- Figure 10: North America Femtech Market Volume Share (%), by Application 2025 & 2033
- Figure 11: North America Femtech Market Revenue (Million), by End User 2025 & 2033
- Figure 12: North America Femtech Market Volume (K Unit), by End User 2025 & 2033
- Figure 13: North America Femtech Market Revenue Share (%), by End User 2025 & 2033
- Figure 14: North America Femtech Market Volume Share (%), by End User 2025 & 2033
- Figure 15: North America Femtech Market Revenue (Million), by Country 2025 & 2033
- Figure 16: North America Femtech Market Volume (K Unit), by Country 2025 & 2033
- Figure 17: North America Femtech Market Revenue Share (%), by Country 2025 & 2033
- Figure 18: North America Femtech Market Volume Share (%), by Country 2025 & 2033
- Figure 19: Europe Femtech Market Revenue (Million), by Type 2025 & 2033
- Figure 20: Europe Femtech Market Volume (K Unit), by Type 2025 & 2033
- Figure 21: Europe Femtech Market Revenue Share (%), by Type 2025 & 2033
- Figure 22: Europe Femtech Market Volume Share (%), by Type 2025 & 2033
- Figure 23: Europe Femtech Market Revenue (Million), by Application 2025 & 2033
- Figure 24: Europe Femtech Market Volume (K Unit), by Application 2025 & 2033
- Figure 25: Europe Femtech Market Revenue Share (%), by Application 2025 & 2033
- Figure 26: Europe Femtech Market Volume Share (%), by Application 2025 & 2033
- Figure 27: Europe Femtech Market Revenue (Million), by End User 2025 & 2033
- Figure 28: Europe Femtech Market Volume (K Unit), by End User 2025 & 2033
- Figure 29: Europe Femtech Market Revenue Share (%), by End User 2025 & 2033
- Figure 30: Europe Femtech Market Volume Share (%), by End User 2025 & 2033
- Figure 31: Europe Femtech Market Revenue (Million), by Country 2025 & 2033
- Figure 32: Europe Femtech Market Volume (K Unit), by Country 2025 & 2033
- Figure 33: Europe Femtech Market Revenue Share (%), by Country 2025 & 2033
- Figure 34: Europe Femtech Market Volume Share (%), by Country 2025 & 2033
- Figure 35: Asia Pacific Femtech Market Revenue (Million), by Type 2025 & 2033
- Figure 36: Asia Pacific Femtech Market Volume (K Unit), by Type 2025 & 2033
- Figure 37: Asia Pacific Femtech Market Revenue Share (%), by Type 2025 & 2033
- Figure 38: Asia Pacific Femtech Market Volume Share (%), by Type 2025 & 2033
- Figure 39: Asia Pacific Femtech Market Revenue (Million), by Application 2025 & 2033
- Figure 40: Asia Pacific Femtech Market Volume (K Unit), by Application 2025 & 2033
- Figure 41: Asia Pacific Femtech Market Revenue Share (%), by Application 2025 & 2033
- Figure 42: Asia Pacific Femtech Market Volume Share (%), by Application 2025 & 2033
- Figure 43: Asia Pacific Femtech Market Revenue (Million), by End User 2025 & 2033
- Figure 44: Asia Pacific Femtech Market Volume (K Unit), by End User 2025 & 2033
- Figure 45: Asia Pacific Femtech Market Revenue Share (%), by End User 2025 & 2033
- Figure 46: Asia Pacific Femtech Market Volume Share (%), by End User 2025 & 2033
- Figure 47: Asia Pacific Femtech Market Revenue (Million), by Country 2025 & 2033
- Figure 48: Asia Pacific Femtech Market Volume (K Unit), by Country 2025 & 2033
- Figure 49: Asia Pacific Femtech Market Revenue Share (%), by Country 2025 & 2033
- Figure 50: Asia Pacific Femtech Market Volume Share (%), by Country 2025 & 2033
- Figure 51: Middle East and Africa Femtech Market Revenue (Million), by Type 2025 & 2033
- Figure 52: Middle East and Africa Femtech Market Volume (K Unit), by Type 2025 & 2033
- Figure 53: Middle East and Africa Femtech Market Revenue Share (%), by Type 2025 & 2033
- Figure 54: Middle East and Africa Femtech Market Volume Share (%), by Type 2025 & 2033
- Figure 55: Middle East and Africa Femtech Market Revenue (Million), by Application 2025 & 2033
- Figure 56: Middle East and Africa Femtech Market Volume (K Unit), by Application 2025 & 2033
- Figure 57: Middle East and Africa Femtech Market Revenue Share (%), by Application 2025 & 2033
- Figure 58: Middle East and Africa Femtech Market Volume Share (%), by Application 2025 & 2033
- Figure 59: Middle East and Africa Femtech Market Revenue (Million), by End User 2025 & 2033
- Figure 60: Middle East and Africa Femtech Market Volume (K Unit), by End User 2025 & 2033
- Figure 61: Middle East and Africa Femtech Market Revenue Share (%), by End User 2025 & 2033
- Figure 62: Middle East and Africa Femtech Market Volume Share (%), by End User 2025 & 2033
- Figure 63: Middle East and Africa Femtech Market Revenue (Million), by Country 2025 & 2033
- Figure 64: Middle East and Africa Femtech Market Volume (K Unit), by Country 2025 & 2033
- Figure 65: Middle East and Africa Femtech Market Revenue Share (%), by Country 2025 & 2033
- Figure 66: Middle East and Africa Femtech Market Volume Share (%), by Country 2025 & 2033
- Figure 67: South America Femtech Market Revenue (Million), by Type 2025 & 2033
- Figure 68: South America Femtech Market Volume (K Unit), by Type 2025 & 2033
- Figure 69: South America Femtech Market Revenue Share (%), by Type 2025 & 2033
- Figure 70: South America Femtech Market Volume Share (%), by Type 2025 & 2033
- Figure 71: South America Femtech Market Revenue (Million), by Application 2025 & 2033
- Figure 72: South America Femtech Market Volume (K Unit), by Application 2025 & 2033
- Figure 73: South America Femtech Market Revenue Share (%), by Application 2025 & 2033
- Figure 74: South America Femtech Market Volume Share (%), by Application 2025 & 2033
- Figure 75: South America Femtech Market Revenue (Million), by End User 2025 & 2033
- Figure 76: South America Femtech Market Volume (K Unit), by End User 2025 & 2033
- Figure 77: South America Femtech Market Revenue Share (%), by End User 2025 & 2033
- Figure 78: South America Femtech Market Volume Share (%), by End User 2025 & 2033
- Figure 79: South America Femtech Market Revenue (Million), by Country 2025 & 2033
- Figure 80: South America Femtech Market Volume (K Unit), by Country 2025 & 2033
- Figure 81: South America Femtech Market Revenue Share (%), by Country 2025 & 2033
- Figure 82: South America Femtech Market Volume Share (%), by Country 2025 & 2033
List of Tables
- Table 1: Global Femtech Market Revenue Million Forecast, by Type 2020 & 2033
- Table 2: Global Femtech Market Volume K Unit Forecast, by Type 2020 & 2033
- Table 3: Global Femtech Market Revenue Million Forecast, by Application 2020 & 2033
- Table 4: Global Femtech Market Volume K Unit Forecast, by Application 2020 & 2033
- Table 5: Global Femtech Market Revenue Million Forecast, by End User 2020 & 2033
- Table 6: Global Femtech Market Volume K Unit Forecast, by End User 2020 & 2033
- Table 7: Global Femtech Market Revenue Million Forecast, by Region 2020 & 2033
- Table 8: Global Femtech Market Volume K Unit Forecast, by Region 2020 & 2033
- Table 9: Global Femtech Market Revenue Million Forecast, by Type 2020 & 2033
- Table 10: Global Femtech Market Volume K Unit Forecast, by Type 2020 & 2033
- Table 11: Global Femtech Market Revenue Million Forecast, by Application 2020 & 2033
- Table 12: Global Femtech Market Volume K Unit Forecast, by Application 2020 & 2033
- Table 13: Global Femtech Market Revenue Million Forecast, by End User 2020 & 2033
- Table 14: Global Femtech Market Volume K Unit Forecast, by End User 2020 & 2033
- Table 15: Global Femtech Market Revenue Million Forecast, by Country 2020 & 2033
- Table 16: Global Femtech Market Volume K Unit Forecast, by Country 2020 & 2033
- Table 17: United States Femtech Market Revenue (Million) Forecast, by Application 2020 & 2033
- Table 18: United States Femtech Market Volume (K Unit) Forecast, by Application 2020 & 2033
- Table 19: Canada Femtech Market Revenue (Million) Forecast, by Application 2020 & 2033
- Table 20: Canada Femtech Market Volume (K Unit) Forecast, by Application 2020 & 2033
- Table 21: Mexico Femtech Market Revenue (Million) Forecast, by Application 2020 & 2033
- Table 22: Mexico Femtech Market Volume (K Unit) Forecast, by Application 2020 & 2033
- Table 23: Global Femtech Market Revenue Million Forecast, by Type 2020 & 2033
- Table 24: Global Femtech Market Volume K Unit Forecast, by Type 2020 & 2033
- Table 25: Global Femtech Market Revenue Million Forecast, by Application 2020 & 2033
- Table 26: Global Femtech Market Volume K Unit Forecast, by Application 2020 & 2033
- Table 27: Global Femtech Market Revenue Million Forecast, by End User 2020 & 2033
- Table 28: Global Femtech Market Volume K Unit Forecast, by End User 2020 & 2033
- Table 29: Global Femtech Market Revenue Million Forecast, by Country 2020 & 2033
- Table 30: Global Femtech Market Volume K Unit Forecast, by Country 2020 & 2033
- Table 31: Germany Femtech Market Revenue (Million) Forecast, by Application 2020 & 2033
- Table 32: Germany Femtech Market Volume (K Unit) Forecast, by Application 2020 & 2033
- Table 33: United Kingdom Femtech Market Revenue (Million) Forecast, by Application 2020 & 2033
- Table 34: United Kingdom Femtech Market Volume (K Unit) Forecast, by Application 2020 & 2033
- Table 35: France Femtech Market Revenue (Million) Forecast, by Application 2020 & 2033
- Table 36: France Femtech Market Volume (K Unit) Forecast, by Application 2020 & 2033
- Table 37: Italy Femtech Market Revenue (Million) Forecast, by Application 2020 & 2033
- Table 38: Italy Femtech Market Volume (K Unit) Forecast, by Application 2020 & 2033
- Table 39: Spain Femtech Market Revenue (Million) Forecast, by Application 2020 & 2033
- Table 40: Spain Femtech Market Volume (K Unit) Forecast, by Application 2020 & 2033
- Table 41: Rest of Europe Femtech Market Revenue (Million) Forecast, by Application 2020 & 2033
- Table 42: Rest of Europe Femtech Market Volume (K Unit) Forecast, by Application 2020 & 2033
- Table 43: Global Femtech Market Revenue Million Forecast, by Type 2020 & 2033
- Table 44: Global Femtech Market Volume K Unit Forecast, by Type 2020 & 2033
- Table 45: Global Femtech Market Revenue Million Forecast, by Application 2020 & 2033
- Table 46: Global Femtech Market Volume K Unit Forecast, by Application 2020 & 2033
- Table 47: Global Femtech Market Revenue Million Forecast, by End User 2020 & 2033
- Table 48: Global Femtech Market Volume K Unit Forecast, by End User 2020 & 2033
- Table 49: Global Femtech Market Revenue Million Forecast, by Country 2020 & 2033
- Table 50: Global Femtech Market Volume K Unit Forecast, by Country 2020 & 2033
- Table 51: China Femtech Market Revenue (Million) Forecast, by Application 2020 & 2033
- Table 52: China Femtech Market Volume (K Unit) Forecast, by Application 2020 & 2033
- Table 53: Japan Femtech Market Revenue (Million) Forecast, by Application 2020 & 2033
- Table 54: Japan Femtech Market Volume (K Unit) Forecast, by Application 2020 & 2033
- Table 55: India Femtech Market Revenue (Million) Forecast, by Application 2020 & 2033
- Table 56: India Femtech Market Volume (K Unit) Forecast, by Application 2020 & 2033
- Table 57: Australia Femtech Market Revenue (Million) Forecast, by Application 2020 & 2033
- Table 58: Australia Femtech Market Volume (K Unit) Forecast, by Application 2020 & 2033
- Table 59: South Korea Femtech Market Revenue (Million) Forecast, by Application 2020 & 2033
- Table 60: South Korea Femtech Market Volume (K Unit) Forecast, by Application 2020 & 2033
- Table 61: Rest of Asia Pacific Femtech Market Revenue (Million) Forecast, by Application 2020 & 2033
- Table 62: Rest of Asia Pacific Femtech Market Volume (K Unit) Forecast, by Application 2020 & 2033
- Table 63: Global Femtech Market Revenue Million Forecast, by Type 2020 & 2033
- Table 64: Global Femtech Market Volume K Unit Forecast, by Type 2020 & 2033
- Table 65: Global Femtech Market Revenue Million Forecast, by Application 2020 & 2033
- Table 66: Global Femtech Market Volume K Unit Forecast, by Application 2020 & 2033
- Table 67: Global Femtech Market Revenue Million Forecast, by End User 2020 & 2033
- Table 68: Global Femtech Market Volume K Unit Forecast, by End User 2020 & 2033
- Table 69: Global Femtech Market Revenue Million Forecast, by Country 2020 & 2033
- Table 70: Global Femtech Market Volume K Unit Forecast, by Country 2020 & 2033
- Table 71: GCC Femtech Market Revenue (Million) Forecast, by Application 2020 & 2033
- Table 72: GCC Femtech Market Volume (K Unit) Forecast, by Application 2020 & 2033
- Table 73: South Africa Femtech Market Revenue (Million) Forecast, by Application 2020 & 2033
- Table 74: South Africa Femtech Market Volume (K Unit) Forecast, by Application 2020 & 2033
- Table 75: Rest of Middle East and Africa Femtech Market Revenue (Million) Forecast, by Application 2020 & 2033
- Table 76: Rest of Middle East and Africa Femtech Market Volume (K Unit) Forecast, by Application 2020 & 2033
- Table 77: Global Femtech Market Revenue Million Forecast, by Type 2020 & 2033
- Table 78: Global Femtech Market Volume K Unit Forecast, by Type 2020 & 2033
- Table 79: Global Femtech Market Revenue Million Forecast, by Application 2020 & 2033
- Table 80: Global Femtech Market Volume K Unit Forecast, by Application 2020 & 2033
- Table 81: Global Femtech Market Revenue Million Forecast, by End User 2020 & 2033
- Table 82: Global Femtech Market Volume K Unit Forecast, by End User 2020 & 2033
- Table 83: Global Femtech Market Revenue Million Forecast, by Country 2020 & 2033
- Table 84: Global Femtech Market Volume K Unit Forecast, by Country 2020 & 2033
- Table 85: Brazil Femtech Market Revenue (Million) Forecast, by Application 2020 & 2033
- Table 86: Brazil Femtech Market Volume (K Unit) Forecast, by Application 2020 & 2033
- Table 87: Argentina Femtech Market Revenue (Million) Forecast, by Application 2020 & 2033
- Table 88: Argentina Femtech Market Volume (K Unit) Forecast, by Application 2020 & 2033
- Table 89: Rest of South America Femtech Market Revenue (Million) Forecast, by Application 2020 & 2033
- Table 90: Rest of South America Femtech Market Volume (K Unit) Forecast, by Application 2020 & 2033
Frequently Asked Questions
1. What is the projected Compound Annual Growth Rate (CAGR) of the Femtech Market?
The projected CAGR is approximately 14.42%.
2. Which companies are prominent players in the Femtech Market?
Key companies in the market include Sera Prognostics, Elvie, Nuvo Cares, Athena Feminine Technologies, Natural Cycles USA Corp, iSono Health, HeraMED, NUROKOR LIMITED, Flo Health Inc, Canopie.
3. What are the main segments of the Femtech Market?
The market segments include Type, Application, End User.
4. Can you provide details about the market size?
The market size is estimated to be USD 7.48 Million as of 2022.
5. What are some drivers contributing to market growth?
Rise in Adoption of Digital Health Solution; Advancement in Artificial Intelligence and Virtual Assistance; Growth in Investments and Funding in Femtech Industry.
6. What are the notable trends driving market growth?
Reproductive Health Segment is Expected to Hold a Significant Share of the Market.
7. Are there any restraints impacting market growth?
Health Risks Associated with the Devices.
8. Can you provide examples of recent developments in the market?
November 2022: London-based accelerator FemTech Lab launched an innovation space for the FemTech community. The FemTech Hub is the first physical innovation hub dedicated to women's health, especially.
9. What pricing options are available for accessing the report?
Pricing options include single-user, multi-user, and enterprise licenses priced at USD 4750, USD 5250, and USD 8750 respectively.
10. Is the market size provided in terms of value or volume?
The market size is provided in terms of value, measured in Million and volume, measured in K Unit.
11. Are there any specific market keywords associated with the report?
Yes, the market keyword associated with the report is "Femtech Market," which aids in identifying and referencing the specific market segment covered.
12. How do I determine which pricing option suits my needs best?
The pricing options vary based on user requirements and access needs. Individual users may opt for single-user licenses, while businesses requiring broader access may choose multi-user or enterprise licenses for cost-effective access to the report.
13. Are there any additional resources or data provided in the Femtech Market report?
While the report offers comprehensive insights, it's advisable to review the specific contents or supplementary materials provided to ascertain if additional resources or data are available.
14. How can I stay updated on further developments or reports in the Femtech Market?
To stay informed about further developments, trends, and reports in the Femtech Market, consider subscribing to industry newsletters, following relevant companies and organizations, or regularly checking reputable industry news sources and publications.
Methodology
Step 1 - Identification of Relevant Samples Size from Population Database


Step 2 - Approaches for Defining Global Market Size (Value, Volume* & Price*)

Note*: In applicable scenarios
Step 3 - Data Sources
Primary Research
- Web Analytics
- Survey Reports
- Research Institute
- Latest Research Reports
- Opinion Leaders
Secondary Research
- Annual Reports
- White Paper
- Latest Press Release
- Industry Association
- Paid Database
- Investor Presentations

Step 4 - Data Triangulation
Involves using different sources of information in order to increase the validity of a study
These sources are likely to be stakeholders in a program - participants, other researchers, program staff, other community members, and so on.
Then we put all data in single framework & apply various statistical tools to find out the dynamic on the market.
During the analysis stage, feedback from the stakeholder groups would be compared to determine areas of agreement as well as areas of divergence