

Key Insights
The global clinical oncology next-generation sequencing (NGS) market is poised for significant expansion, driven by the escalating incidence of cancer, breakthroughs in NGS technology, and the growing demand for personalized treatment strategies. Projections indicate a robust Compound Annual Growth Rate (CAGR) of 17.3%, with the market size expected to reach 744.4 million by the base year 2025. This growth is underpinned by NGS's capacity for comprehensive genomic profiling, essential for accurate cancer diagnosis, prognosis, and the selection of effective therapies, ultimately leading to improved patient outcomes. The increasing utilization of companion diagnostics, leveraging NGS data to guide targeted therapies, is a key market accelerator. Continuous technological advancements, including the development of more accurate, rapid, and cost-efficient sequencing platforms such as Whole Genome Sequencing, Whole Exome Sequencing, and Targeted Sequencing, further fuel this expansion. While bioinformatics challenges persist, ongoing improvements in analytical tools and a growing pool of skilled professionals are mitigating these concerns. The market is segmented by technology (e.g., Whole Genome Sequencing, Whole Exome Sequencing, Targeted Sequencing), workflow (Pre-Sequencing, Sequencing, Data Analysis), application (Screening, Inherited Cancer, Companion Diagnostics, Other Diagnostics), and end-user (Hospitals, Clinics, Laboratories). North America currently dominates, supported by advanced healthcare infrastructure and high adoption rates, though the Asia-Pacific region is anticipated to experience substantial growth due to increasing healthcare investments and rising cancer prevalence.
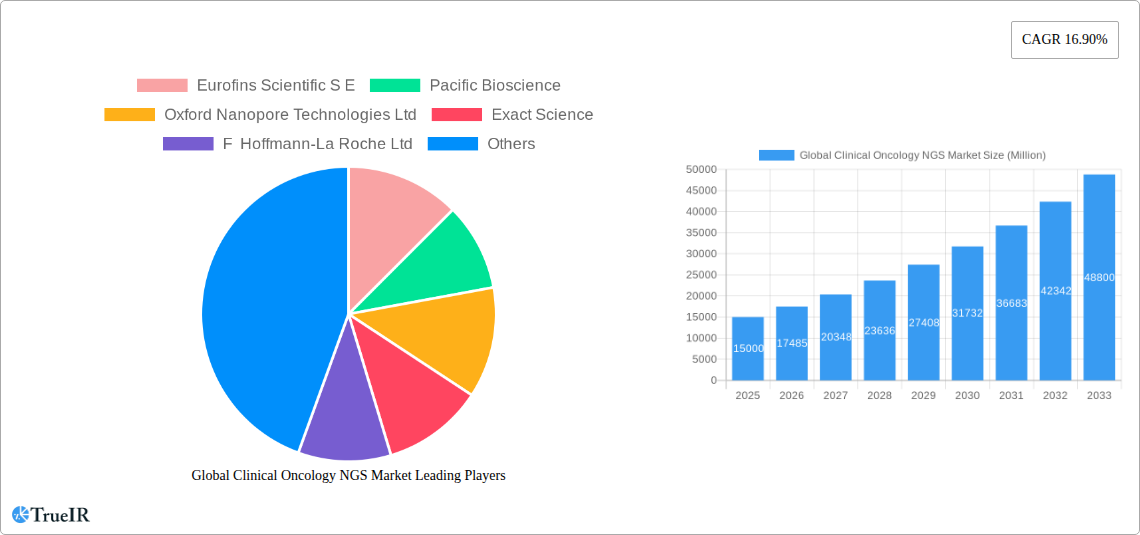
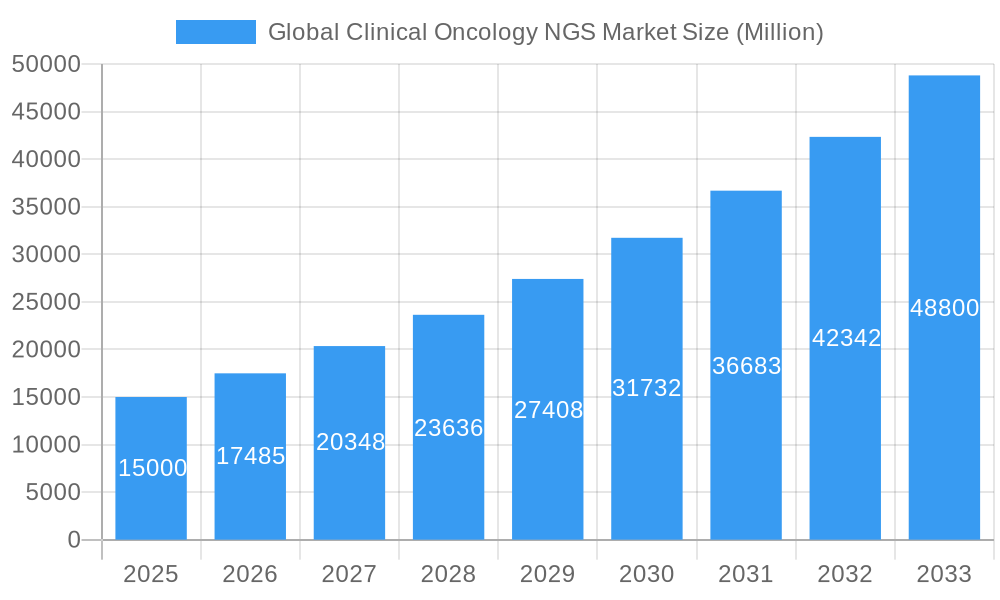
Global Clinical Oncology NGS Market Market Size (In Million)
The competitive landscape is characterized by dynamism, with industry leaders such as Illumina, Thermo Fisher Scientific, Roche, and Qiagen spearheading market innovation. The emergence of smaller companies with novel technologies and solutions adds to the market's vibrancy. Strategic alliances, mergers, and partnerships are prevalent, aimed at expanding market reach and strengthening product offerings. Future market expansion will be propelled by enhanced accessibility of NGS technologies, ongoing innovation focused on affordability and speed, and the development of comprehensive clinical guidelines for NGS implementation in oncology. The integration of artificial intelligence and machine learning in data analysis is also expected to profoundly impact the market. A primary challenge for sustained growth will be ensuring equitable global access to NGS testing. Nevertheless, the long-term outlook for the clinical oncology NGS market remains exceptionally positive, driven by its transformative role in revolutionizing cancer care.
Global Clinical Oncology NGS Market Company Market Share
Global Clinical Oncology NGS Market Report: 2019-2033
This comprehensive report provides a detailed analysis of the Global Clinical Oncology NGS Market, offering invaluable insights for stakeholders across the industry. Leveraging extensive market research and data analysis spanning the period from 2019 to 2033 (Base Year: 2025, Forecast Period: 2025-2033), this report dissects market trends, competitive landscapes, and future growth prospects. The report covers key segments including technology (Whole Genome Sequencing, Whole Exome Sequencing, Targeted Sequencing & Resequencing Centrifuges), workflow (Pre-Sequencing, Sequencing, Data Analysis), application (Screening, Inherited Cancer, Companion Diagnostics, Other Diagnostics), and end-users (Hospitals, Clinics, Laboratories). Leading players such as Illumina Inc, Thermo Fisher Scientific, and Qiagen N V are analyzed, alongside emerging companies shaping the dynamic market landscape. This report is essential for strategic decision-making, investment planning, and understanding the future of clinical oncology NGS. The market is expected to reach xx Million by 2033.
Global Clinical Oncology NGS Market Structure & Competitive Landscape
The global clinical oncology NGS market exhibits a moderately concentrated structure, with a few dominant players commanding significant market share. The market's concentration ratio (CR4) is estimated at xx% in 2025, indicating a moderately consolidated landscape. However, the presence of numerous smaller players, particularly in the specialized segments and emerging technologies, adds to the complexity. Innovation is a key driver, with companies continually investing in research and development to improve sequencing technologies, data analysis algorithms, and companion diagnostic applications. The regulatory landscape significantly impacts market growth, as approvals and reimbursement policies vary across different jurisdictions. Product substitutes, such as traditional cytogenetic and immunohistochemical methods, continue to compete, although NGS is progressively becoming the preferred method due to its superior sensitivity and comprehensive nature. The end-user segment is dominated by hospitals and specialized laboratories, reflecting the complex workflow and expertise required for NGS testing. M&A activity has been substantial in recent years, as larger companies strategically acquire smaller players to expand their product portfolios and enhance their market position. The volume of M&A transactions in the period 2019-2024 was estimated at xx transactions, and is predicted to increase in the forecast period.
- Market Concentration: CR4 estimated at xx% in 2025.
- Innovation Drivers: Continuous improvements in sequencing technology, data analytics, and companion diagnostics.
- Regulatory Impacts: Varying approval and reimbursement policies across geographies.
- Product Substitutes: Traditional cytogenetic and immunohistochemical methods.
- End-User Segmentation: Hospitals and specialized laboratories are primary end-users.
- M&A Trends: Significant M&A activity observed, with xx transactions in 2019-2024.
Global Clinical Oncology NGS Market Market Trends & Opportunities
The global clinical oncology NGS market is experiencing robust growth, driven by several key factors. The market size was valued at xx Million in 2025 and is projected to register a CAGR of xx% during the forecast period (2025-2033), reaching an estimated value of xx Million by 2033. Technological advancements, such as the development of more cost-effective and faster sequencing platforms, are expanding the accessibility and affordability of NGS. The increasing adoption of personalized medicine, fueled by the growing understanding of cancer genomics, is creating a strong demand for targeted therapies and companion diagnostics. This shift towards personalized medicine is translating into higher market penetration rates, particularly in developed regions. The market is also witnessing increased consumer awareness of genetic testing and its potential to inform cancer treatment decisions, further bolstering market growth. The competitive landscape is intensely dynamic, with companies continuously striving to innovate and offer superior products and services.
Dominant Markets & Segments in Global Clinical Oncology NGS Market
The North American region currently dominates the global clinical oncology NGS market, driven by factors such as advanced healthcare infrastructure, high adoption rates of advanced diagnostic technologies, and favorable regulatory environment. Within North America, the United States accounts for the largest share due to factors such as higher healthcare expenditure and prevalence of cancer. Europe follows as a significant market, with countries such as Germany and the UK showing robust growth. In Asia-Pacific, China and Japan are key growth markets, driven by increasing investment in healthcare infrastructure and rising cancer incidence rates.
- Leading Region: North America (primarily the United States)
- Key Growth Drivers:
- North America: Advanced healthcare infrastructure, high adoption rates, favorable regulatory environment.
- Europe: Increasing healthcare expenditure, growing awareness of NGS benefits.
- Asia-Pacific: Rising cancer incidence, growing healthcare investment.
- Dominant Segments:
- Technology: Targeted Sequencing & Resequencing, with a projected market share of xx% by 2033, holds the largest share due to its cost-effectiveness and clinical relevance.
- Workflow: Sequencing, is the largest segment by revenue, reflecting the core process of NGS technology.
- Application: Companion Diagnostics shows significant growth potential, driven by the rising adoption of targeted therapies.
- End-use: Hospitals dominate due to the need for specialized equipment and expertise for NGS.
Global Clinical Oncology NGS Market Product Analysis
Recent product innovations have focused on improving sequencing speed, accuracy, and affordability. This includes the development of novel sequencing chemistries, improved data analysis algorithms, and streamlined workflows. The integration of NGS with other technologies, such as artificial intelligence and machine learning, is further enhancing the clinical utility of NGS. The competitive advantage largely rests on technological superiority, ease of use, and comprehensive data analysis capabilities. Companies are also focusing on the development of user-friendly software and efficient sample preparation kits to improve the accessibility of NGS technology. The market sees a push toward miniaturization of sequencers and development of portable systems for point-of-care diagnostics.
Key Drivers, Barriers & Challenges in Global Clinical Oncology NGS Market
Key Drivers:
- Technological advancements in sequencing technology are making NGS more cost-effective and accessible.
- Increased adoption of personalized medicine is driving demand for targeted therapies and companion diagnostics.
- Favorable regulatory environment in certain regions is accelerating market growth.
Key Challenges & Restraints:
- High initial investment costs for NGS technology can hinder adoption, especially in resource-constrained settings.
- Stringent regulatory requirements for NGS tests can slow down market entry and adoption.
- Intense competition amongst established players and emerging companies can pressure profit margins. The impact is estimated to decrease market growth by approximately xx% by 2030.
Growth Drivers in the Global Clinical Oncology NGS Market Market
The increasing prevalence of cancer globally, coupled with the rising adoption of personalized medicine, is a primary driver. Technological advancements, such as faster and more cost-effective sequencing technologies, are also expanding market access. Favorable regulatory policies in certain regions are accelerating adoption, while increased investments in healthcare infrastructure and R&D are fostering market growth.
Challenges Impacting Global Clinical Oncology NGS Market Growth
High costs associated with NGS testing remain a barrier to wider adoption. Complex regulatory frameworks and stringent approval processes for NGS tests can hinder market growth, especially in developing countries. The need for highly trained personnel for data analysis and interpretation poses a significant challenge. The intense competition from established and emerging companies can pressure profit margins.
Key Players Shaping the Global Clinical Oncology NGS Market Market
- Eurofins Scientific S.E.
- Pacific Biosciences
- Oxford Nanopore Technologies Ltd
- Exact Sciences
- F. Hoffmann-La Roche Ltd
- Partek Inc
- Qiagen N.V.
- Foundation Medicine
- Myriad Genetics
- Illumina Inc
- Caris Life Sciences
- Thermo Fisher Scientific
- Agilent Technologies
- PerkinElmer
- Beijing Genomics Institute (BGI)
Significant Global Clinical Oncology NGS Market Industry Milestones
- 2020: Illumina launched the NovaSeq X Plus, significantly increasing sequencing throughput.
- 2021: Qiagen acquired an oncology-focused company to strengthen its companion diagnostics portfolio.
- 2022: Several key players announced partnerships to integrate AI into their NGS data analysis platforms.
- 2023: A new handheld sequencer technology was launched, enabling faster point of care testing. (Exact details of these milestones may need to be further verified and updated)
Future Outlook for Global Clinical Oncology NGS Market Market
The global clinical oncology NGS market is poised for continued growth, driven by technological advancements, increasing demand for personalized medicine, and favorable regulatory support. Strategic partnerships and acquisitions will reshape the competitive landscape. Emerging applications, such as liquid biopsies and early cancer detection, will create new market opportunities. The market's future is bright, with potential for significant expansion across various regions and applications.
Global Clinical Oncology NGS Market Segmentation
-
1. Technology
- 1.1. Whole Genome Sequencing
- 1.2. Whole Exome Sequencing
- 1.3. Targeted Sequencing & Resequencing Centrifuges
-
2. Workflow
- 2.1. Pre-Sequencing
- 2.2. Data Analysis
-
3. Application
-
3.1. Screening
- 3.1.1. Sporadic Cancer
- 3.1.2. Inherited Cancer
- 3.2. Companion Diagnostics
- 3.3. Other Diagnostics
-
3.1. Screening
-
4. End-use
- 4.1. Hospitals
- 4.2. Clinics
- 4.3. Laboratories
Global Clinical Oncology NGS Market Segmentation By Geography
-
1. North America
- 1.1. United States
- 1.2. Canada
- 1.3. Mexico
-
2. Europe
- 2.1. Germany
- 2.2. United Kingdom
- 2.3. France
- 2.4. Italy
- 2.5. Spain
- 2.6. Rest of Europe
-
3. Asia Pacific
- 3.1. China
- 3.2. Japan
- 3.3. India
- 3.4. Australia
- 3.5. South Korea
- 3.6. Rest of Asia Pacific
-
4. Middle East and Africa
- 4.1. GCC
- 4.2. South Africa
- 4.3. Rest of Middle East and Africa
-
5. South America
- 5.1. Brazil
- 5.2. Argentina
- 5.3. Rest of South America
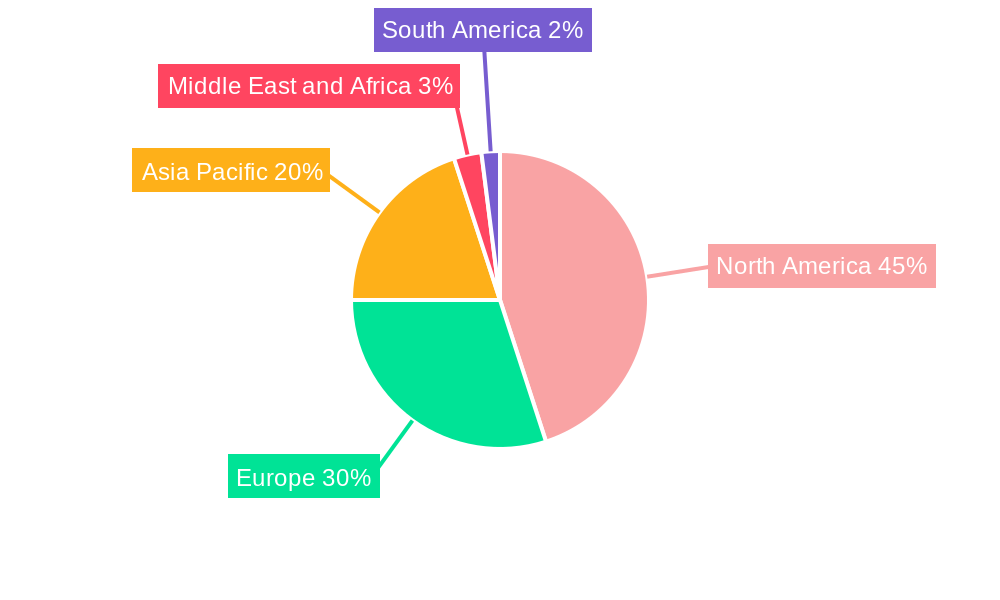
Global Clinical Oncology NGS Market Regional Market Share
Geographic Coverage of Global Clinical Oncology NGS Market
Global Clinical Oncology NGS Market REPORT HIGHLIGHTS
| Aspects | Details |
|---|---|
| Study Period | 2020-2034 |
| Base Year | 2025 |
| Estimated Year | 2026 |
| Forecast Period | 2026-2034 |
| Historical Period | 2020-2025 |
| Growth Rate | CAGR of 17.3% from 2020-2034 |
| Segmentation |
|
Table of Contents
- 1. Introduction
- 1.1. Research Scope
- 1.2. Market Segmentation
- 1.3. Research Objective
- 1.4. Definitions and Assumptions
- 2. Executive Summary
- 2.1. Market Snapshot
- 3. Market Dynamics
- 3.1. Market Drivers
- 3.2. Market Restrains
- 3.3. Market Trends
- 3.4. Market Opportunities
- 4. Market Factor Analysis
- 4.1. Porters Five Forces
- 4.1.1. Bargaining Power of Suppliers
- 4.1.2. Bargaining Power of Buyers
- 4.1.3. Threat of New Entrants
- 4.1.4. Threat of Substitutes
- 4.1.5. Competitive Rivalry
- 4.2. PESTEL analysis
- 4.3. BCG Analysis
- 4.3.1. Stars (High Growth, High Market Share)
- 4.3.2. Cash Cows (Low Growth, High Market Share)
- 4.3.3. Question Mark (High Growth, Low Market Share)
- 4.3.4. Dogs (Low Growth, Low Market Share)
- 4.4. Ansoff Matrix Analysis
- 4.5. Supply Chain Analysis
- 4.6. Regulatory Landscape
- 4.7. Current Market Potential and Opportunity Assessment (TAM–SAM–SOM Framework)
- 4.8. TIR Analyst Note
- 4.1. Porters Five Forces
- 5. Market Analysis, Insights and Forecast 2021-2033
- 5.1. Market Analysis, Insights and Forecast - by Technology
- 5.1.1. Whole Genome Sequencing
- 5.1.2. Whole Exome Sequencing
- 5.1.3. Targeted Sequencing & Resequencing Centrifuges
- 5.2. Market Analysis, Insights and Forecast - by Workflow
- 5.2.1. Pre-Sequencing
- 5.2.2. Data Analysis
- 5.3. Market Analysis, Insights and Forecast - by Application
- 5.3.1. Screening
- 5.3.1.1. Sporadic Cancer
- 5.3.1.2. Inherited Cancer
- 5.3.2. Companion Diagnostics
- 5.3.3. Other Diagnostics
- 5.3.1. Screening
- 5.4. Market Analysis, Insights and Forecast - by End-use
- 5.4.1. Hospitals
- 5.4.2. Clinics
- 5.4.3. Laboratories
- 5.5. Market Analysis, Insights and Forecast - by Region
- 5.5.1. North America
- 5.5.2. Europe
- 5.5.3. Asia Pacific
- 5.5.4. Middle East and Africa
- 5.5.5. South America
- 5.1. Market Analysis, Insights and Forecast - by Technology
- 6. Global Clinical Oncology NGS Market Analysis, Insights and Forecast, 2021-2033
- 6.1. Market Analysis, Insights and Forecast - by Technology
- 6.1.1. Whole Genome Sequencing
- 6.1.2. Whole Exome Sequencing
- 6.1.3. Targeted Sequencing & Resequencing Centrifuges
- 6.2. Market Analysis, Insights and Forecast - by Workflow
- 6.2.1. Pre-Sequencing
- 6.2.2. Data Analysis
- 6.3. Market Analysis, Insights and Forecast - by Application
- 6.3.1. Screening
- 6.3.1.1. Sporadic Cancer
- 6.3.1.2. Inherited Cancer
- 6.3.2. Companion Diagnostics
- 6.3.3. Other Diagnostics
- 6.3.1. Screening
- 6.4. Market Analysis, Insights and Forecast - by End-use
- 6.4.1. Hospitals
- 6.4.2. Clinics
- 6.4.3. Laboratories
- 6.1. Market Analysis, Insights and Forecast - by Technology
- 7. North America Global Clinical Oncology NGS Market Analysis, Insights and Forecast, 2020-2032
- 7.1. Market Analysis, Insights and Forecast - by Technology
- 7.1.1. Whole Genome Sequencing
- 7.1.2. Whole Exome Sequencing
- 7.1.3. Targeted Sequencing & Resequencing Centrifuges
- 7.2. Market Analysis, Insights and Forecast - by Workflow
- 7.2.1. Pre-Sequencing
- 7.2.2. Data Analysis
- 7.3. Market Analysis, Insights and Forecast - by Application
- 7.3.1. Screening
- 7.3.1.1. Sporadic Cancer
- 7.3.1.2. Inherited Cancer
- 7.3.2. Companion Diagnostics
- 7.3.3. Other Diagnostics
- 7.3.1. Screening
- 7.4. Market Analysis, Insights and Forecast - by End-use
- 7.4.1. Hospitals
- 7.4.2. Clinics
- 7.4.3. Laboratories
- 7.1. Market Analysis, Insights and Forecast - by Technology
- 8. Europe Global Clinical Oncology NGS Market Analysis, Insights and Forecast, 2020-2032
- 8.1. Market Analysis, Insights and Forecast - by Technology
- 8.1.1. Whole Genome Sequencing
- 8.1.2. Whole Exome Sequencing
- 8.1.3. Targeted Sequencing & Resequencing Centrifuges
- 8.2. Market Analysis, Insights and Forecast - by Workflow
- 8.2.1. Pre-Sequencing
- 8.2.2. Data Analysis
- 8.3. Market Analysis, Insights and Forecast - by Application
- 8.3.1. Screening
- 8.3.1.1. Sporadic Cancer
- 8.3.1.2. Inherited Cancer
- 8.3.2. Companion Diagnostics
- 8.3.3. Other Diagnostics
- 8.3.1. Screening
- 8.4. Market Analysis, Insights and Forecast - by End-use
- 8.4.1. Hospitals
- 8.4.2. Clinics
- 8.4.3. Laboratories
- 8.1. Market Analysis, Insights and Forecast - by Technology
- 9. Asia Pacific Global Clinical Oncology NGS Market Analysis, Insights and Forecast, 2020-2032
- 9.1. Market Analysis, Insights and Forecast - by Technology
- 9.1.1. Whole Genome Sequencing
- 9.1.2. Whole Exome Sequencing
- 9.1.3. Targeted Sequencing & Resequencing Centrifuges
- 9.2. Market Analysis, Insights and Forecast - by Workflow
- 9.2.1. Pre-Sequencing
- 9.2.2. Data Analysis
- 9.3. Market Analysis, Insights and Forecast - by Application
- 9.3.1. Screening
- 9.3.1.1. Sporadic Cancer
- 9.3.1.2. Inherited Cancer
- 9.3.2. Companion Diagnostics
- 9.3.3. Other Diagnostics
- 9.3.1. Screening
- 9.4. Market Analysis, Insights and Forecast - by End-use
- 9.4.1. Hospitals
- 9.4.2. Clinics
- 9.4.3. Laboratories
- 9.1. Market Analysis, Insights and Forecast - by Technology
- 10. Middle East and Africa Global Clinical Oncology NGS Market Analysis, Insights and Forecast, 2020-2032
- 10.1. Market Analysis, Insights and Forecast - by Technology
- 10.1.1. Whole Genome Sequencing
- 10.1.2. Whole Exome Sequencing
- 10.1.3. Targeted Sequencing & Resequencing Centrifuges
- 10.2. Market Analysis, Insights and Forecast - by Workflow
- 10.2.1. Pre-Sequencing
- 10.2.2. Data Analysis
- 10.3. Market Analysis, Insights and Forecast - by Application
- 10.3.1. Screening
- 10.3.1.1. Sporadic Cancer
- 10.3.1.2. Inherited Cancer
- 10.3.2. Companion Diagnostics
- 10.3.3. Other Diagnostics
- 10.3.1. Screening
- 10.4. Market Analysis, Insights and Forecast - by End-use
- 10.4.1. Hospitals
- 10.4.2. Clinics
- 10.4.3. Laboratories
- 10.1. Market Analysis, Insights and Forecast - by Technology
- 11. South America Global Clinical Oncology NGS Market Analysis, Insights and Forecast, 2020-2032
- 11.1. Market Analysis, Insights and Forecast - by Technology
- 11.1.1. Whole Genome Sequencing
- 11.1.2. Whole Exome Sequencing
- 11.1.3. Targeted Sequencing & Resequencing Centrifuges
- 11.2. Market Analysis, Insights and Forecast - by Workflow
- 11.2.1. Pre-Sequencing
- 11.2.2. Data Analysis
- 11.3. Market Analysis, Insights and Forecast - by Application
- 11.3.1. Screening
- 11.3.1.1. Sporadic Cancer
- 11.3.1.2. Inherited Cancer
- 11.3.2. Companion Diagnostics
- 11.3.3. Other Diagnostics
- 11.3.1. Screening
- 11.4. Market Analysis, Insights and Forecast - by End-use
- 11.4.1. Hospitals
- 11.4.2. Clinics
- 11.4.3. Laboratories
- 11.1. Market Analysis, Insights and Forecast - by Technology
- 12. Competitive Analysis
- 12.1. Company Profiles
- 12.1.1 Eurofins Scientific S E
- 12.1.1.1. Company Overview
- 12.1.1.2. Products
- 12.1.1.3. Company Financials
- 12.1.1.4. SWOT Analysis
- 12.1.2 Pacific Bioscience
- 12.1.2.1. Company Overview
- 12.1.2.2. Products
- 12.1.2.3. Company Financials
- 12.1.2.4. SWOT Analysis
- 12.1.3 Oxford Nanopore Technologies Ltd
- 12.1.3.1. Company Overview
- 12.1.3.2. Products
- 12.1.3.3. Company Financials
- 12.1.3.4. SWOT Analysis
- 12.1.4 Exact Science
- 12.1.4.1. Company Overview
- 12.1.4.2. Products
- 12.1.4.3. Company Financials
- 12.1.4.4. SWOT Analysis
- 12.1.5 F Hoffmann-La Roche Ltd
- 12.1.5.1. Company Overview
- 12.1.5.2. Products
- 12.1.5.3. Company Financials
- 12.1.5.4. SWOT Analysis
- 12.1.6 Partek Inc
- 12.1.6.1. Company Overview
- 12.1.6.2. Products
- 12.1.6.3. Company Financials
- 12.1.6.4. SWOT Analysis
- 12.1.7 Qiagen N V *List Not Exhaustive
- 12.1.7.1. Company Overview
- 12.1.7.2. Products
- 12.1.7.3. Company Financials
- 12.1.7.4. SWOT Analysis
- 12.1.8 Foundation Medicine
- 12.1.8.1. Company Overview
- 12.1.8.2. Products
- 12.1.8.3. Company Financials
- 12.1.8.4. SWOT Analysis
- 12.1.9 Myriad Genetics
- 12.1.9.1. Company Overview
- 12.1.9.2. Products
- 12.1.9.3. Company Financials
- 12.1.9.4. SWOT Analysis
- 12.1.10 Illumina Inc
- 12.1.10.1. Company Overview
- 12.1.10.2. Products
- 12.1.10.3. Company Financials
- 12.1.10.4. SWOT Analysis
- 12.1.11 Caris Life Sciences
- 12.1.11.1. Company Overview
- 12.1.11.2. Products
- 12.1.11.3. Company Financials
- 12.1.11.4. SWOT Analysis
- 12.1.12 Thermo Fisher Scientific
- 12.1.12.1. Company Overview
- 12.1.12.2. Products
- 12.1.12.3. Company Financials
- 12.1.12.4. SWOT Analysis
- 12.1.13 Agilent Technologies
- 12.1.13.1. Company Overview
- 12.1.13.2. Products
- 12.1.13.3. Company Financials
- 12.1.13.4. SWOT Analysis
- 12.1.14 Perkin Elmer
- 12.1.14.1. Company Overview
- 12.1.14.2. Products
- 12.1.14.3. Company Financials
- 12.1.14.4. SWOT Analysis
- 12.1.15 Beijing Genomics Institute (BGI)
- 12.1.15.1. Company Overview
- 12.1.15.2. Products
- 12.1.15.3. Company Financials
- 12.1.15.4. SWOT Analysis
- 12.1.1 Eurofins Scientific S E
- 12.2. Market Entropy
- 12.2.1 Company's Key Areas Served
- 12.2.2 Recent Developments
- 12.3. Company Market Share Analysis 2025
- 12.3.1 Top 5 Companies Market Share Analysis
- 12.3.2 Top 3 Companies Market Share Analysis
- 12.4. List of Potential Customers
- 13. Research Methodology
List of Figures
- Figure 1: Global Global Clinical Oncology NGS Market Revenue Breakdown (million, %) by Region 2025 & 2033
- Figure 2: North America Global Clinical Oncology NGS Market Revenue (million), by Technology 2025 & 2033
- Figure 3: North America Global Clinical Oncology NGS Market Revenue Share (%), by Technology 2025 & 2033
- Figure 4: North America Global Clinical Oncology NGS Market Revenue (million), by Workflow 2025 & 2033
- Figure 5: North America Global Clinical Oncology NGS Market Revenue Share (%), by Workflow 2025 & 2033
- Figure 6: North America Global Clinical Oncology NGS Market Revenue (million), by Application 2025 & 2033
- Figure 7: North America Global Clinical Oncology NGS Market Revenue Share (%), by Application 2025 & 2033
- Figure 8: North America Global Clinical Oncology NGS Market Revenue (million), by End-use 2025 & 2033
- Figure 9: North America Global Clinical Oncology NGS Market Revenue Share (%), by End-use 2025 & 2033
- Figure 10: North America Global Clinical Oncology NGS Market Revenue (million), by Country 2025 & 2033
- Figure 11: North America Global Clinical Oncology NGS Market Revenue Share (%), by Country 2025 & 2033
- Figure 12: Europe Global Clinical Oncology NGS Market Revenue (million), by Technology 2025 & 2033
- Figure 13: Europe Global Clinical Oncology NGS Market Revenue Share (%), by Technology 2025 & 2033
- Figure 14: Europe Global Clinical Oncology NGS Market Revenue (million), by Workflow 2025 & 2033
- Figure 15: Europe Global Clinical Oncology NGS Market Revenue Share (%), by Workflow 2025 & 2033
- Figure 16: Europe Global Clinical Oncology NGS Market Revenue (million), by Application 2025 & 2033
- Figure 17: Europe Global Clinical Oncology NGS Market Revenue Share (%), by Application 2025 & 2033
- Figure 18: Europe Global Clinical Oncology NGS Market Revenue (million), by End-use 2025 & 2033
- Figure 19: Europe Global Clinical Oncology NGS Market Revenue Share (%), by End-use 2025 & 2033
- Figure 20: Europe Global Clinical Oncology NGS Market Revenue (million), by Country 2025 & 2033
- Figure 21: Europe Global Clinical Oncology NGS Market Revenue Share (%), by Country 2025 & 2033
- Figure 22: Asia Pacific Global Clinical Oncology NGS Market Revenue (million), by Technology 2025 & 2033
- Figure 23: Asia Pacific Global Clinical Oncology NGS Market Revenue Share (%), by Technology 2025 & 2033
- Figure 24: Asia Pacific Global Clinical Oncology NGS Market Revenue (million), by Workflow 2025 & 2033
- Figure 25: Asia Pacific Global Clinical Oncology NGS Market Revenue Share (%), by Workflow 2025 & 2033
- Figure 26: Asia Pacific Global Clinical Oncology NGS Market Revenue (million), by Application 2025 & 2033
- Figure 27: Asia Pacific Global Clinical Oncology NGS Market Revenue Share (%), by Application 2025 & 2033
- Figure 28: Asia Pacific Global Clinical Oncology NGS Market Revenue (million), by End-use 2025 & 2033
- Figure 29: Asia Pacific Global Clinical Oncology NGS Market Revenue Share (%), by End-use 2025 & 2033
- Figure 30: Asia Pacific Global Clinical Oncology NGS Market Revenue (million), by Country 2025 & 2033
- Figure 31: Asia Pacific Global Clinical Oncology NGS Market Revenue Share (%), by Country 2025 & 2033
- Figure 32: Middle East and Africa Global Clinical Oncology NGS Market Revenue (million), by Technology 2025 & 2033
- Figure 33: Middle East and Africa Global Clinical Oncology NGS Market Revenue Share (%), by Technology 2025 & 2033
- Figure 34: Middle East and Africa Global Clinical Oncology NGS Market Revenue (million), by Workflow 2025 & 2033
- Figure 35: Middle East and Africa Global Clinical Oncology NGS Market Revenue Share (%), by Workflow 2025 & 2033
- Figure 36: Middle East and Africa Global Clinical Oncology NGS Market Revenue (million), by Application 2025 & 2033
- Figure 37: Middle East and Africa Global Clinical Oncology NGS Market Revenue Share (%), by Application 2025 & 2033
- Figure 38: Middle East and Africa Global Clinical Oncology NGS Market Revenue (million), by End-use 2025 & 2033
- Figure 39: Middle East and Africa Global Clinical Oncology NGS Market Revenue Share (%), by End-use 2025 & 2033
- Figure 40: Middle East and Africa Global Clinical Oncology NGS Market Revenue (million), by Country 2025 & 2033
- Figure 41: Middle East and Africa Global Clinical Oncology NGS Market Revenue Share (%), by Country 2025 & 2033
- Figure 42: South America Global Clinical Oncology NGS Market Revenue (million), by Technology 2025 & 2033
- Figure 43: South America Global Clinical Oncology NGS Market Revenue Share (%), by Technology 2025 & 2033
- Figure 44: South America Global Clinical Oncology NGS Market Revenue (million), by Workflow 2025 & 2033
- Figure 45: South America Global Clinical Oncology NGS Market Revenue Share (%), by Workflow 2025 & 2033
- Figure 46: South America Global Clinical Oncology NGS Market Revenue (million), by Application 2025 & 2033
- Figure 47: South America Global Clinical Oncology NGS Market Revenue Share (%), by Application 2025 & 2033
- Figure 48: South America Global Clinical Oncology NGS Market Revenue (million), by End-use 2025 & 2033
- Figure 49: South America Global Clinical Oncology NGS Market Revenue Share (%), by End-use 2025 & 2033
- Figure 50: South America Global Clinical Oncology NGS Market Revenue (million), by Country 2025 & 2033
- Figure 51: South America Global Clinical Oncology NGS Market Revenue Share (%), by Country 2025 & 2033
List of Tables
- Table 1: Global Clinical Oncology NGS Market Revenue million Forecast, by Technology 2020 & 2033
- Table 2: Global Clinical Oncology NGS Market Revenue million Forecast, by Workflow 2020 & 2033
- Table 3: Global Clinical Oncology NGS Market Revenue million Forecast, by Application 2020 & 2033
- Table 4: Global Clinical Oncology NGS Market Revenue million Forecast, by End-use 2020 & 2033
- Table 5: Global Clinical Oncology NGS Market Revenue million Forecast, by Region 2020 & 2033
- Table 6: Global Clinical Oncology NGS Market Revenue million Forecast, by Technology 2020 & 2033
- Table 7: Global Clinical Oncology NGS Market Revenue million Forecast, by Workflow 2020 & 2033
- Table 8: Global Clinical Oncology NGS Market Revenue million Forecast, by Application 2020 & 2033
- Table 9: Global Clinical Oncology NGS Market Revenue million Forecast, by End-use 2020 & 2033
- Table 10: Global Clinical Oncology NGS Market Revenue million Forecast, by Country 2020 & 2033
- Table 11: United States Global Clinical Oncology NGS Market Revenue (million) Forecast, by Application 2020 & 2033
- Table 12: Canada Global Clinical Oncology NGS Market Revenue (million) Forecast, by Application 2020 & 2033
- Table 13: Mexico Global Clinical Oncology NGS Market Revenue (million) Forecast, by Application 2020 & 2033
- Table 14: Global Clinical Oncology NGS Market Revenue million Forecast, by Technology 2020 & 2033
- Table 15: Global Clinical Oncology NGS Market Revenue million Forecast, by Workflow 2020 & 2033
- Table 16: Global Clinical Oncology NGS Market Revenue million Forecast, by Application 2020 & 2033
- Table 17: Global Clinical Oncology NGS Market Revenue million Forecast, by End-use 2020 & 2033
- Table 18: Global Clinical Oncology NGS Market Revenue million Forecast, by Country 2020 & 2033
- Table 19: Germany Global Clinical Oncology NGS Market Revenue (million) Forecast, by Application 2020 & 2033
- Table 20: United Kingdom Global Clinical Oncology NGS Market Revenue (million) Forecast, by Application 2020 & 2033
- Table 21: France Global Clinical Oncology NGS Market Revenue (million) Forecast, by Application 2020 & 2033
- Table 22: Italy Global Clinical Oncology NGS Market Revenue (million) Forecast, by Application 2020 & 2033
- Table 23: Spain Global Clinical Oncology NGS Market Revenue (million) Forecast, by Application 2020 & 2033
- Table 24: Rest of Europe Global Clinical Oncology NGS Market Revenue (million) Forecast, by Application 2020 & 2033
- Table 25: Global Clinical Oncology NGS Market Revenue million Forecast, by Technology 2020 & 2033
- Table 26: Global Clinical Oncology NGS Market Revenue million Forecast, by Workflow 2020 & 2033
- Table 27: Global Clinical Oncology NGS Market Revenue million Forecast, by Application 2020 & 2033
- Table 28: Global Clinical Oncology NGS Market Revenue million Forecast, by End-use 2020 & 2033
- Table 29: Global Clinical Oncology NGS Market Revenue million Forecast, by Country 2020 & 2033
- Table 30: China Global Clinical Oncology NGS Market Revenue (million) Forecast, by Application 2020 & 2033
- Table 31: Japan Global Clinical Oncology NGS Market Revenue (million) Forecast, by Application 2020 & 2033
- Table 32: India Global Clinical Oncology NGS Market Revenue (million) Forecast, by Application 2020 & 2033
- Table 33: Australia Global Clinical Oncology NGS Market Revenue (million) Forecast, by Application 2020 & 2033
- Table 34: South Korea Global Clinical Oncology NGS Market Revenue (million) Forecast, by Application 2020 & 2033
- Table 35: Rest of Asia Pacific Global Clinical Oncology NGS Market Revenue (million) Forecast, by Application 2020 & 2033
- Table 36: Global Clinical Oncology NGS Market Revenue million Forecast, by Technology 2020 & 2033
- Table 37: Global Clinical Oncology NGS Market Revenue million Forecast, by Workflow 2020 & 2033
- Table 38: Global Clinical Oncology NGS Market Revenue million Forecast, by Application 2020 & 2033
- Table 39: Global Clinical Oncology NGS Market Revenue million Forecast, by End-use 2020 & 2033
- Table 40: Global Clinical Oncology NGS Market Revenue million Forecast, by Country 2020 & 2033
- Table 41: GCC Global Clinical Oncology NGS Market Revenue (million) Forecast, by Application 2020 & 2033
- Table 42: South Africa Global Clinical Oncology NGS Market Revenue (million) Forecast, by Application 2020 & 2033
- Table 43: Rest of Middle East and Africa Global Clinical Oncology NGS Market Revenue (million) Forecast, by Application 2020 & 2033
- Table 44: Global Clinical Oncology NGS Market Revenue million Forecast, by Technology 2020 & 2033
- Table 45: Global Clinical Oncology NGS Market Revenue million Forecast, by Workflow 2020 & 2033
- Table 46: Global Clinical Oncology NGS Market Revenue million Forecast, by Application 2020 & 2033
- Table 47: Global Clinical Oncology NGS Market Revenue million Forecast, by End-use 2020 & 2033
- Table 48: Global Clinical Oncology NGS Market Revenue million Forecast, by Country 2020 & 2033
- Table 49: Brazil Global Clinical Oncology NGS Market Revenue (million) Forecast, by Application 2020 & 2033
- Table 50: Argentina Global Clinical Oncology NGS Market Revenue (million) Forecast, by Application 2020 & 2033
- Table 51: Rest of South America Global Clinical Oncology NGS Market Revenue (million) Forecast, by Application 2020 & 2033
Frequently Asked Questions
1. What is the projected Compound Annual Growth Rate (CAGR) of the Global Clinical Oncology NGS Market?
The projected CAGR is approximately 17.3%.
2. Which companies are prominent players in the Global Clinical Oncology NGS Market?
Key companies in the market include Eurofins Scientific S E, Pacific Bioscience, Oxford Nanopore Technologies Ltd, Exact Science, F Hoffmann-La Roche Ltd, Partek Inc, Qiagen N V *List Not Exhaustive, Foundation Medicine, Myriad Genetics, Illumina Inc, Caris Life Sciences, Thermo Fisher Scientific, Agilent Technologies, Perkin Elmer, Beijing Genomics Institute (BGI).
3. What are the main segments of the Global Clinical Oncology NGS Market?
The market segments include Technology, Workflow, Application, End-use.
4. Can you provide details about the market size?
The market size is estimated to be USD 744.4 million as of 2022.
5. What are some drivers contributing to market growth?
Advancements in the Field of Personalized Medicine; Rising Burden of Cancer; Decrease in Costs for Genetic Sequencing.
6. What are the notable trends driving market growth?
Whole Genome Sequencing is Expected to Projected Significant Growth Over the Forecast Period..
7. Are there any restraints impacting market growth?
Lack of computational efficiency for data management; Inadequate Reimbursement Policy.
8. Can you provide examples of recent developments in the market?
N/A
9. What pricing options are available for accessing the report?
Pricing options include single-user, multi-user, and enterprise licenses priced at USD 4750, USD 5250, and USD 8750 respectively.
10. Is the market size provided in terms of value or volume?
The market size is provided in terms of value, measured in million.
11. Are there any specific market keywords associated with the report?
Yes, the market keyword associated with the report is "Global Clinical Oncology NGS Market," which aids in identifying and referencing the specific market segment covered.
12. How do I determine which pricing option suits my needs best?
The pricing options vary based on user requirements and access needs. Individual users may opt for single-user licenses, while businesses requiring broader access may choose multi-user or enterprise licenses for cost-effective access to the report.
13. Are there any additional resources or data provided in the Global Clinical Oncology NGS Market report?
While the report offers comprehensive insights, it's advisable to review the specific contents or supplementary materials provided to ascertain if additional resources or data are available.
14. How can I stay updated on further developments or reports in the Global Clinical Oncology NGS Market?
To stay informed about further developments, trends, and reports in the Global Clinical Oncology NGS Market, consider subscribing to industry newsletters, following relevant companies and organizations, or regularly checking reputable industry news sources and publications.
Methodology
Step 1 - Identification of Relevant Samples Size from Population Database


Step 2 - Approaches for Defining Global Market Size (Value, Volume* & Price*)

Note*: In applicable scenarios
Step 3 - Data Sources
Primary Research
- Web Analytics
- Survey Reports
- Research Institute
- Latest Research Reports
- Opinion Leaders
Secondary Research
- Annual Reports
- White Paper
- Latest Press Release
- Industry Association
- Paid Database
- Investor Presentations

Step 4 - Data Triangulation
Involves using different sources of information in order to increase the validity of a study
These sources are likely to be stakeholders in a program - participants, other researchers, program staff, other community members, and so on.
Then we put all data in single framework & apply various statistical tools to find out the dynamic on the market.
During the analysis stage, feedback from the stakeholder groups would be compared to determine areas of agreement as well as areas of divergence