

Key Insights
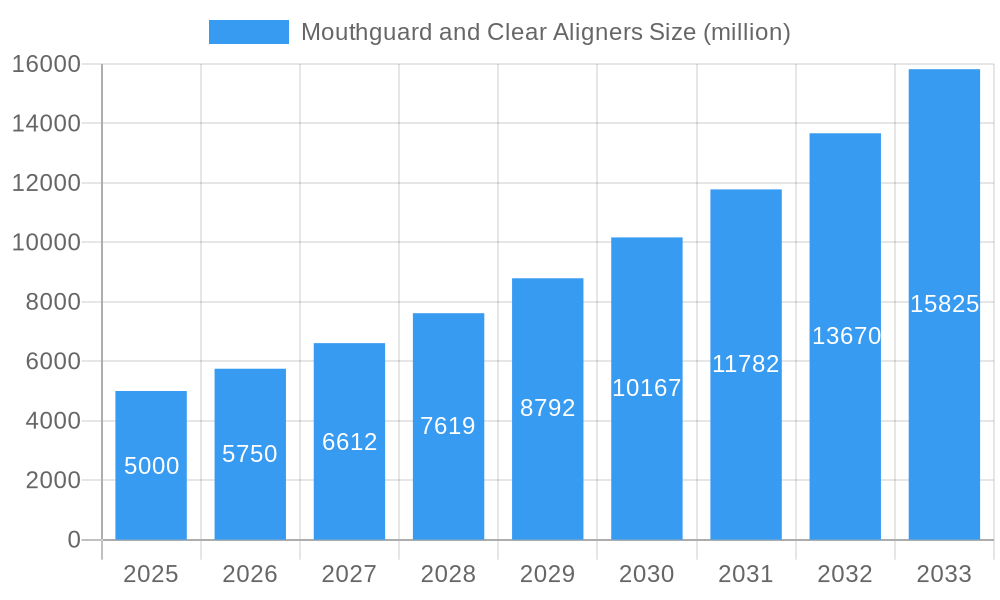
The global mouthguard and clear aligner market is experiencing robust growth, driven by increasing awareness of oral health, rising prevalence of dental irregularities, and a growing preference for aesthetically pleasing orthodontic solutions. The market, estimated at $5 billion in 2025, is projected to achieve a Compound Annual Growth Rate (CAGR) of approximately 15% from 2025 to 2033, reaching a market value exceeding $15 billion by 2033. This expansion is fueled by several key factors. Firstly, technological advancements in aligner materials and manufacturing processes are leading to more comfortable, effective, and affordable treatment options. Secondly, the increasing adoption of direct-to-consumer telehealth models for orthodontic consultations is broadening accessibility and convenience. Thirdly, the rising disposable incomes in developing economies are driving market penetration in these regions. Furthermore, the growing awareness about the benefits of mouthguards for preventing sports-related injuries and bruxism (teeth grinding) is significantly contributing to the mouthguard segment's growth. The key players in this market, including Align Technology, Straumann AG, and Dentsply Sirona, are actively involved in research and development, strategic partnerships, and acquisitions to expand their market share and cater to the growing demand.
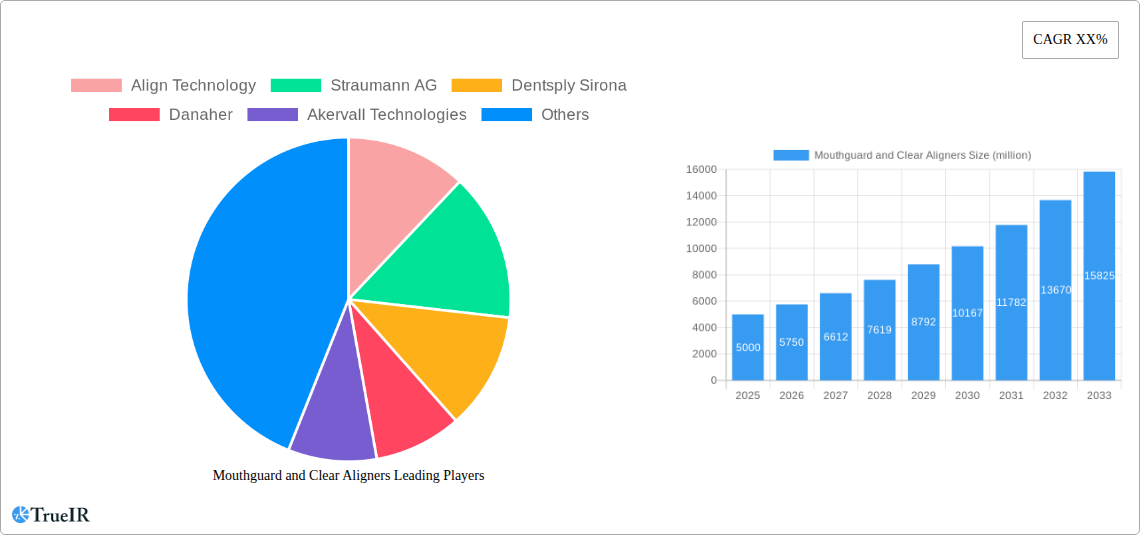
Mouthguard and Clear Aligners Market Size (In Billion)
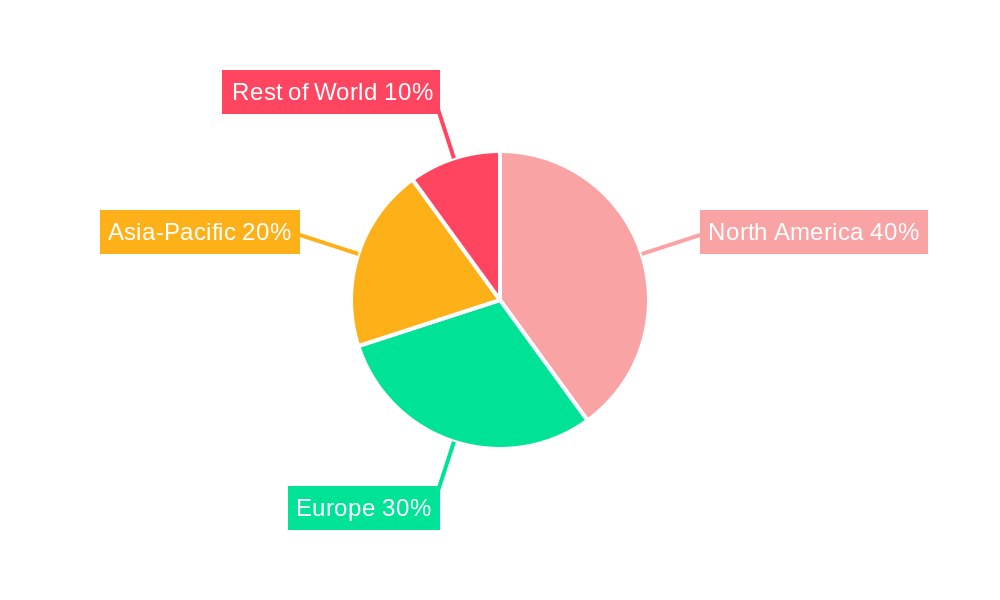
The market segmentation reveals significant opportunities for growth within specific niches. For example, the clear aligner segment is likely experiencing faster growth due to its cosmetic appeal. Regional variations also exist; North America and Europe currently hold the largest market shares, but Asia-Pacific is expected to demonstrate significant growth in the coming years due to rising awareness and affordability. However, challenges such as high treatment costs, limited accessibility in certain regions, and potential risks associated with improper use of clear aligners could act as restraints to market expansion. The industry will likely see further consolidation through mergers and acquisitions, as larger companies look to capitalize on this expanding market. Continued innovation in material science and digital technologies will remain crucial for future growth.
Mouthguard and Clear Aligners Company Market Share
Dynamic Mouthguard and Clear Aligners Market Report: 2019-2033
This comprehensive report provides a detailed analysis of the global Mouthguard and Clear Aligners market, projecting a XX million valuation by 2033. Leveraging extensive market research spanning the period 2019-2033 (Base Year: 2025, Forecast Period: 2025-2033, Historical Period: 2019-2024), this report offers invaluable insights for investors, industry professionals, and strategic decision-makers.
Mouthguard and Clear Aligners Market Structure & Competitive Landscape
The global mouthguard and clear aligners market exhibits a moderately consolidated structure, with a few major players dominating significant market share. The Herfindahl-Hirschman Index (HHI) for 2024 was estimated at xx, indicating a moderately concentrated market. Key drivers of innovation include advancements in materials science (e.g., development of more comfortable and durable aligners), 3D printing technologies for customized solutions, and telehealth integration for remote monitoring and adjustments. Regulatory impacts, particularly concerning medical device approvals and safety standards, significantly influence market dynamics. The market also experiences pressure from substitute products like traditional braces and removable retainers. End-user segmentation includes orthodontic practices, general dentists, and direct-to-consumer brands, each with specific market needs and purchasing behaviors. Significant mergers and acquisitions (M&A) activity have shaped the competitive landscape, with a total estimated M&A volume of xx million USD in 2024.
- Market Concentration: HHI of xx in 2024.
- Innovation Drivers: Advancements in materials, 3D printing, telehealth.
- Regulatory Impacts: Stringent medical device approvals and safety standards.
- Product Substitutes: Traditional braces, removable retainers.
- End-User Segmentation: Orthodontic practices, general dentists, direct-to-consumer.
- M&A Trends: Estimated M&A volume of xx million USD in 2024.
Mouthguard and Clear Aligners Market Trends & Opportunities
The global mouthguard and clear aligner market is experiencing robust growth, projected to reach a value of xx million by 2033, with a Compound Annual Growth Rate (CAGR) of xx% during the forecast period. This growth is fueled by several factors including increasing awareness of aesthetic dentistry, rising disposable incomes, technological advancements, and a shift towards minimally invasive orthodontic solutions. Market penetration rates for clear aligners are increasing steadily in both developed and emerging markets, driven by consumer preference for discreet and comfortable alternatives to traditional braces. The market witnesses continuous technological innovation, including the development of more comfortable and durable materials, improved aligner designs for better treatment outcomes, and advanced software for treatment planning and monitoring. This competition is fostering innovation and driving down prices, making these treatments increasingly accessible to a broader population.
Dominant Markets & Segments in Mouthguard and Clear Aligners
The North American market currently holds the largest share of the global mouthguard and clear aligner market, driven by high consumer awareness, readily available technology, and well-established dental infrastructure.
- Key Growth Drivers in North America:
- Strong dental infrastructure and high density of orthodontic practices.
- High consumer awareness and disposable income.
- Favorable regulatory environment.
- Early adoption of technological advancements.
The European market is experiencing significant growth, primarily driven by increasing demand for aesthetic orthodontic treatments and the rising prevalence of malocclusion. Asia-Pacific is expected to witness the fastest growth rate, driven by a burgeoning middle class, increased healthcare spending, and growing adoption of advanced dental technologies.
Mouthguard and Clear Aligners Product Analysis
The market offers a diverse range of products, from basic mouthguards for sports protection to sophisticated clear aligners designed for orthodontic treatment. Technological advancements have focused on improving the comfort, durability, and effectiveness of these products. For example, the use of advanced polymers has led to the development of more comfortable and less noticeable aligners. Furthermore, innovations in 3D printing technology enable customization, leading to more precise and efficient treatment plans. The competition between manufacturers centers on improving treatment outcomes, enhancing patient experience, and offering competitive pricing strategies.
Key Drivers, Barriers & Challenges in Mouthguard and Clear Aligners
Key Drivers:
- Increasing consumer awareness of aesthetic dentistry and the benefits of clear aligners.
- Rising disposable incomes and increased healthcare spending.
- Technological advancements leading to improved product design and treatment outcomes.
- Expansion of telehealth and remote monitoring capabilities.
Challenges:
- Stringent regulatory approvals and compliance requirements.
- Potential for supply chain disruptions impacting raw material availability and manufacturing.
- Intense competition among established and emerging players in the market. This translates into pricing pressures and necessitates continuous innovation to maintain market share.
- The high cost of treatment can act as a barrier to entry for some consumers.
Growth Drivers in the Mouthguard and Clear Aligners Market
The market is driven by technological advancements (e.g., 3D printing, AI-driven treatment planning), rising disposable incomes, expanding awareness of cosmetic dentistry, and increasing prevalence of malocclusion. Furthermore, supportive regulatory environments in various regions and the growth of telehealth contribute to market expansion.
Challenges Impacting Mouthguard and Clear Aligners Growth
The growth of this market is hampered by regulatory hurdles (e.g., varying approval processes across geographies), supply chain vulnerabilities (e.g., dependence on specific materials), and intense competition resulting in price pressures. The high cost of treatment can limit market accessibility for certain demographics, further impacting overall growth.
Key Players Shaping the Mouthguard and Clear Aligners Market
- Align Technology
- Straumann AG
- Dentsply Sirona
- Danaher
- Akervall Technologies
- Apex Sleep
- DentCare Dental Lab
- Sleep Right
- Lumino
- DynaFlex
- Western Dental
Significant Mouthguard and Clear Aligners Industry Milestones
- 2020: Align Technology launches a new line of clear aligners with improved comfort and durability.
- 2021: Dentsply Sirona acquires a leading 3D printing company specializing in dental applications.
- 2022: Straumann AG expands its digital dentistry platform to include clear aligner treatment planning software.
- 2023: Increased investment in research and development of new biocompatible materials for aligners.
Future Outlook for Mouthguard and Clear Aligners Market
The mouthguard and clear aligner market is poised for continued growth, driven by technological innovation, expanding market penetration, and increasing consumer demand. Strategic partnerships, particularly with telehealth providers, and product diversification into new segments (e.g., snoring mouthguards) are expected to further drive market expansion. The market presents significant opportunities for companies capable of adapting to evolving consumer preferences, leveraging technological advancements, and navigating regulatory complexities effectively.
Mouthguard and Clear Aligners Segmentation
-
1. Application
- 1.1. Hospital
- 1.2. Dental office
-
2. Types
- 2.1. Teenager
- 2.2. Adult
- 2.3. Pediatric
Mouthguard and Clear Aligners Segmentation By Geography
-
1. North America
- 1.1. United States
- 1.2. Canada
- 1.3. Mexico
-
2. South America
- 2.1. Brazil
- 2.2. Argentina
- 2.3. Rest of South America
-
3. Europe
- 3.1. United Kingdom
- 3.2. Germany
- 3.3. France
- 3.4. Italy
- 3.5. Spain
- 3.6. Russia
- 3.7. Benelux
- 3.8. Nordics
- 3.9. Rest of Europe
-
4. Middle East & Africa
- 4.1. Turkey
- 4.2. Israel
- 4.3. GCC
- 4.4. North Africa
- 4.5. South Africa
- 4.6. Rest of Middle East & Africa
-
5. Asia Pacific
- 5.1. China
- 5.2. India
- 5.3. Japan
- 5.4. South Korea
- 5.5. ASEAN
- 5.6. Oceania
- 5.7. Rest of Asia Pacific
Mouthguard and Clear Aligners Regional Market Share
Geographic Coverage of Mouthguard and Clear Aligners
Mouthguard and Clear Aligners REPORT HIGHLIGHTS
| Aspects | Details |
|---|---|
| Study Period | 2020-2034 |
| Base Year | 2025 |
| Estimated Year | 2026 |
| Forecast Period | 2026-2034 |
| Historical Period | 2020-2025 |
| Growth Rate | CAGR of 13.13% from 2020-2034 |
| Segmentation |
|
Table of Contents
- 1. Introduction
- 1.1. Research Scope
- 1.2. Market Segmentation
- 1.3. Research Objective
- 1.4. Definitions and Assumptions
- 2. Executive Summary
- 2.1. Market Snapshot
- 3. Market Dynamics
- 3.1. Market Drivers
- 3.2. Market Restrains
- 3.3. Market Trends
- 3.4. Market Opportunities
- 4. Market Factor Analysis
- 4.1. Porters Five Forces
- 4.1.1. Bargaining Power of Suppliers
- 4.1.2. Bargaining Power of Buyers
- 4.1.3. Threat of New Entrants
- 4.1.4. Threat of Substitutes
- 4.1.5. Competitive Rivalry
- 4.2. PESTEL analysis
- 4.3. BCG Analysis
- 4.3.1. Stars (High Growth, High Market Share)
- 4.3.2. Cash Cows (Low Growth, High Market Share)
- 4.3.3. Question Mark (High Growth, Low Market Share)
- 4.3.4. Dogs (Low Growth, Low Market Share)
- 4.4. Ansoff Matrix Analysis
- 4.5. Supply Chain Analysis
- 4.6. Regulatory Landscape
- 4.7. Current Market Potential and Opportunity Assessment (TAM–SAM–SOM Framework)
- 4.8. TIR Analyst Note
- 4.1. Porters Five Forces
- 5. Market Analysis, Insights and Forecast 2021-2033
- 5.1. Market Analysis, Insights and Forecast - by Application
- 5.1.1. Hospital
- 5.1.2. Dental office
- 5.2. Market Analysis, Insights and Forecast - by Types
- 5.2.1. Teenager
- 5.2.2. Adult
- 5.2.3. Pediatric
- 5.3. Market Analysis, Insights and Forecast - by Region
- 5.3.1. North America
- 5.3.2. South America
- 5.3.3. Europe
- 5.3.4. Middle East & Africa
- 5.3.5. Asia Pacific
- 5.1. Market Analysis, Insights and Forecast - by Application
- 6. Global Mouthguard and Clear Aligners Analysis, Insights and Forecast, 2021-2033
- 6.1. Market Analysis, Insights and Forecast - by Application
- 6.1.1. Hospital
- 6.1.2. Dental office
- 6.2. Market Analysis, Insights and Forecast - by Types
- 6.2.1. Teenager
- 6.2.2. Adult
- 6.2.3. Pediatric
- 6.1. Market Analysis, Insights and Forecast - by Application
- 7. North America Mouthguard and Clear Aligners Analysis, Insights and Forecast, 2020-2032
- 7.1. Market Analysis, Insights and Forecast - by Application
- 7.1.1. Hospital
- 7.1.2. Dental office
- 7.2. Market Analysis, Insights and Forecast - by Types
- 7.2.1. Teenager
- 7.2.2. Adult
- 7.2.3. Pediatric
- 7.1. Market Analysis, Insights and Forecast - by Application
- 8. South America Mouthguard and Clear Aligners Analysis, Insights and Forecast, 2020-2032
- 8.1. Market Analysis, Insights and Forecast - by Application
- 8.1.1. Hospital
- 8.1.2. Dental office
- 8.2. Market Analysis, Insights and Forecast - by Types
- 8.2.1. Teenager
- 8.2.2. Adult
- 8.2.3. Pediatric
- 8.1. Market Analysis, Insights and Forecast - by Application
- 9. Europe Mouthguard and Clear Aligners Analysis, Insights and Forecast, 2020-2032
- 9.1. Market Analysis, Insights and Forecast - by Application
- 9.1.1. Hospital
- 9.1.2. Dental office
- 9.2. Market Analysis, Insights and Forecast - by Types
- 9.2.1. Teenager
- 9.2.2. Adult
- 9.2.3. Pediatric
- 9.1. Market Analysis, Insights and Forecast - by Application
- 10. Middle East & Africa Mouthguard and Clear Aligners Analysis, Insights and Forecast, 2020-2032
- 10.1. Market Analysis, Insights and Forecast - by Application
- 10.1.1. Hospital
- 10.1.2. Dental office
- 10.2. Market Analysis, Insights and Forecast - by Types
- 10.2.1. Teenager
- 10.2.2. Adult
- 10.2.3. Pediatric
- 10.1. Market Analysis, Insights and Forecast - by Application
- 11. Asia Pacific Mouthguard and Clear Aligners Analysis, Insights and Forecast, 2020-2032
- 11.1. Market Analysis, Insights and Forecast - by Application
- 11.1.1. Hospital
- 11.1.2. Dental office
- 11.2. Market Analysis, Insights and Forecast - by Types
- 11.2.1. Teenager
- 11.2.2. Adult
- 11.2.3. Pediatric
- 11.1. Market Analysis, Insights and Forecast - by Application
- 12. Competitive Analysis
- 12.1. Company Profiles
- 12.1.1 Align Technology
- 12.1.1.1. Company Overview
- 12.1.1.2. Products
- 12.1.1.3. Company Financials
- 12.1.1.4. SWOT Analysis
- 12.1.2 Straumann AG
- 12.1.2.1. Company Overview
- 12.1.2.2. Products
- 12.1.2.3. Company Financials
- 12.1.2.4. SWOT Analysis
- 12.1.3 Dentsply Sirona
- 12.1.3.1. Company Overview
- 12.1.3.2. Products
- 12.1.3.3. Company Financials
- 12.1.3.4. SWOT Analysis
- 12.1.4 Danaher
- 12.1.4.1. Company Overview
- 12.1.4.2. Products
- 12.1.4.3. Company Financials
- 12.1.4.4. SWOT Analysis
- 12.1.5 Akervall Technologies
- 12.1.5.1. Company Overview
- 12.1.5.2. Products
- 12.1.5.3. Company Financials
- 12.1.5.4. SWOT Analysis
- 12.1.6 Apex Sleep
- 12.1.6.1. Company Overview
- 12.1.6.2. Products
- 12.1.6.3. Company Financials
- 12.1.6.4. SWOT Analysis
- 12.1.7 DentCare Dental Lab
- 12.1.7.1. Company Overview
- 12.1.7.2. Products
- 12.1.7.3. Company Financials
- 12.1.7.4. SWOT Analysis
- 12.1.8 Sleep Right
- 12.1.8.1. Company Overview
- 12.1.8.2. Products
- 12.1.8.3. Company Financials
- 12.1.8.4. SWOT Analysis
- 12.1.9 Lumino
- 12.1.9.1. Company Overview
- 12.1.9.2. Products
- 12.1.9.3. Company Financials
- 12.1.9.4. SWOT Analysis
- 12.1.10 DynaFlex
- 12.1.10.1. Company Overview
- 12.1.10.2. Products
- 12.1.10.3. Company Financials
- 12.1.10.4. SWOT Analysis
- 12.1.11 Western Dental
- 12.1.11.1. Company Overview
- 12.1.11.2. Products
- 12.1.11.3. Company Financials
- 12.1.11.4. SWOT Analysis
- 12.1.1 Align Technology
- 12.2. Market Entropy
- 12.2.1 Company's Key Areas Served
- 12.2.2 Recent Developments
- 12.3. Company Market Share Analysis 2025
- 12.3.1 Top 5 Companies Market Share Analysis
- 12.3.2 Top 3 Companies Market Share Analysis
- 12.4. List of Potential Customers
- 13. Research Methodology
List of Figures
- Figure 1: Global Mouthguard and Clear Aligners Revenue Breakdown (billion, %) by Region 2025 & 2033
- Figure 2: Global Mouthguard and Clear Aligners Volume Breakdown (K, %) by Region 2025 & 2033
- Figure 3: North America Mouthguard and Clear Aligners Revenue (billion), by Application 2025 & 2033
- Figure 4: North America Mouthguard and Clear Aligners Volume (K), by Application 2025 & 2033
- Figure 5: North America Mouthguard and Clear Aligners Revenue Share (%), by Application 2025 & 2033
- Figure 6: North America Mouthguard and Clear Aligners Volume Share (%), by Application 2025 & 2033
- Figure 7: North America Mouthguard and Clear Aligners Revenue (billion), by Types 2025 & 2033
- Figure 8: North America Mouthguard and Clear Aligners Volume (K), by Types 2025 & 2033
- Figure 9: North America Mouthguard and Clear Aligners Revenue Share (%), by Types 2025 & 2033
- Figure 10: North America Mouthguard and Clear Aligners Volume Share (%), by Types 2025 & 2033
- Figure 11: North America Mouthguard and Clear Aligners Revenue (billion), by Country 2025 & 2033
- Figure 12: North America Mouthguard and Clear Aligners Volume (K), by Country 2025 & 2033
- Figure 13: North America Mouthguard and Clear Aligners Revenue Share (%), by Country 2025 & 2033
- Figure 14: North America Mouthguard and Clear Aligners Volume Share (%), by Country 2025 & 2033
- Figure 15: South America Mouthguard and Clear Aligners Revenue (billion), by Application 2025 & 2033
- Figure 16: South America Mouthguard and Clear Aligners Volume (K), by Application 2025 & 2033
- Figure 17: South America Mouthguard and Clear Aligners Revenue Share (%), by Application 2025 & 2033
- Figure 18: South America Mouthguard and Clear Aligners Volume Share (%), by Application 2025 & 2033
- Figure 19: South America Mouthguard and Clear Aligners Revenue (billion), by Types 2025 & 2033
- Figure 20: South America Mouthguard and Clear Aligners Volume (K), by Types 2025 & 2033
- Figure 21: South America Mouthguard and Clear Aligners Revenue Share (%), by Types 2025 & 2033
- Figure 22: South America Mouthguard and Clear Aligners Volume Share (%), by Types 2025 & 2033
- Figure 23: South America Mouthguard and Clear Aligners Revenue (billion), by Country 2025 & 2033
- Figure 24: South America Mouthguard and Clear Aligners Volume (K), by Country 2025 & 2033
- Figure 25: South America Mouthguard and Clear Aligners Revenue Share (%), by Country 2025 & 2033
- Figure 26: South America Mouthguard and Clear Aligners Volume Share (%), by Country 2025 & 2033
- Figure 27: Europe Mouthguard and Clear Aligners Revenue (billion), by Application 2025 & 2033
- Figure 28: Europe Mouthguard and Clear Aligners Volume (K), by Application 2025 & 2033
- Figure 29: Europe Mouthguard and Clear Aligners Revenue Share (%), by Application 2025 & 2033
- Figure 30: Europe Mouthguard and Clear Aligners Volume Share (%), by Application 2025 & 2033
- Figure 31: Europe Mouthguard and Clear Aligners Revenue (billion), by Types 2025 & 2033
- Figure 32: Europe Mouthguard and Clear Aligners Volume (K), by Types 2025 & 2033
- Figure 33: Europe Mouthguard and Clear Aligners Revenue Share (%), by Types 2025 & 2033
- Figure 34: Europe Mouthguard and Clear Aligners Volume Share (%), by Types 2025 & 2033
- Figure 35: Europe Mouthguard and Clear Aligners Revenue (billion), by Country 2025 & 2033
- Figure 36: Europe Mouthguard and Clear Aligners Volume (K), by Country 2025 & 2033
- Figure 37: Europe Mouthguard and Clear Aligners Revenue Share (%), by Country 2025 & 2033
- Figure 38: Europe Mouthguard and Clear Aligners Volume Share (%), by Country 2025 & 2033
- Figure 39: Middle East & Africa Mouthguard and Clear Aligners Revenue (billion), by Application 2025 & 2033
- Figure 40: Middle East & Africa Mouthguard and Clear Aligners Volume (K), by Application 2025 & 2033
- Figure 41: Middle East & Africa Mouthguard and Clear Aligners Revenue Share (%), by Application 2025 & 2033
- Figure 42: Middle East & Africa Mouthguard and Clear Aligners Volume Share (%), by Application 2025 & 2033
- Figure 43: Middle East & Africa Mouthguard and Clear Aligners Revenue (billion), by Types 2025 & 2033
- Figure 44: Middle East & Africa Mouthguard and Clear Aligners Volume (K), by Types 2025 & 2033
- Figure 45: Middle East & Africa Mouthguard and Clear Aligners Revenue Share (%), by Types 2025 & 2033
- Figure 46: Middle East & Africa Mouthguard and Clear Aligners Volume Share (%), by Types 2025 & 2033
- Figure 47: Middle East & Africa Mouthguard and Clear Aligners Revenue (billion), by Country 2025 & 2033
- Figure 48: Middle East & Africa Mouthguard and Clear Aligners Volume (K), by Country 2025 & 2033
- Figure 49: Middle East & Africa Mouthguard and Clear Aligners Revenue Share (%), by Country 2025 & 2033
- Figure 50: Middle East & Africa Mouthguard and Clear Aligners Volume Share (%), by Country 2025 & 2033
- Figure 51: Asia Pacific Mouthguard and Clear Aligners Revenue (billion), by Application 2025 & 2033
- Figure 52: Asia Pacific Mouthguard and Clear Aligners Volume (K), by Application 2025 & 2033
- Figure 53: Asia Pacific Mouthguard and Clear Aligners Revenue Share (%), by Application 2025 & 2033
- Figure 54: Asia Pacific Mouthguard and Clear Aligners Volume Share (%), by Application 2025 & 2033
- Figure 55: Asia Pacific Mouthguard and Clear Aligners Revenue (billion), by Types 2025 & 2033
- Figure 56: Asia Pacific Mouthguard and Clear Aligners Volume (K), by Types 2025 & 2033
- Figure 57: Asia Pacific Mouthguard and Clear Aligners Revenue Share (%), by Types 2025 & 2033
- Figure 58: Asia Pacific Mouthguard and Clear Aligners Volume Share (%), by Types 2025 & 2033
- Figure 59: Asia Pacific Mouthguard and Clear Aligners Revenue (billion), by Country 2025 & 2033
- Figure 60: Asia Pacific Mouthguard and Clear Aligners Volume (K), by Country 2025 & 2033
- Figure 61: Asia Pacific Mouthguard and Clear Aligners Revenue Share (%), by Country 2025 & 2033
- Figure 62: Asia Pacific Mouthguard and Clear Aligners Volume Share (%), by Country 2025 & 2033
List of Tables
- Table 1: Global Mouthguard and Clear Aligners Revenue billion Forecast, by Application 2020 & 2033
- Table 2: Global Mouthguard and Clear Aligners Volume K Forecast, by Application 2020 & 2033
- Table 3: Global Mouthguard and Clear Aligners Revenue billion Forecast, by Types 2020 & 2033
- Table 4: Global Mouthguard and Clear Aligners Volume K Forecast, by Types 2020 & 2033
- Table 5: Global Mouthguard and Clear Aligners Revenue billion Forecast, by Region 2020 & 2033
- Table 6: Global Mouthguard and Clear Aligners Volume K Forecast, by Region 2020 & 2033
- Table 7: Global Mouthguard and Clear Aligners Revenue billion Forecast, by Application 2020 & 2033
- Table 8: Global Mouthguard and Clear Aligners Volume K Forecast, by Application 2020 & 2033
- Table 9: Global Mouthguard and Clear Aligners Revenue billion Forecast, by Types 2020 & 2033
- Table 10: Global Mouthguard and Clear Aligners Volume K Forecast, by Types 2020 & 2033
- Table 11: Global Mouthguard and Clear Aligners Revenue billion Forecast, by Country 2020 & 2033
- Table 12: Global Mouthguard and Clear Aligners Volume K Forecast, by Country 2020 & 2033
- Table 13: United States Mouthguard and Clear Aligners Revenue (billion) Forecast, by Application 2020 & 2033
- Table 14: United States Mouthguard and Clear Aligners Volume (K) Forecast, by Application 2020 & 2033
- Table 15: Canada Mouthguard and Clear Aligners Revenue (billion) Forecast, by Application 2020 & 2033
- Table 16: Canada Mouthguard and Clear Aligners Volume (K) Forecast, by Application 2020 & 2033
- Table 17: Mexico Mouthguard and Clear Aligners Revenue (billion) Forecast, by Application 2020 & 2033
- Table 18: Mexico Mouthguard and Clear Aligners Volume (K) Forecast, by Application 2020 & 2033
- Table 19: Global Mouthguard and Clear Aligners Revenue billion Forecast, by Application 2020 & 2033
- Table 20: Global Mouthguard and Clear Aligners Volume K Forecast, by Application 2020 & 2033
- Table 21: Global Mouthguard and Clear Aligners Revenue billion Forecast, by Types 2020 & 2033
- Table 22: Global Mouthguard and Clear Aligners Volume K Forecast, by Types 2020 & 2033
- Table 23: Global Mouthguard and Clear Aligners Revenue billion Forecast, by Country 2020 & 2033
- Table 24: Global Mouthguard and Clear Aligners Volume K Forecast, by Country 2020 & 2033
- Table 25: Brazil Mouthguard and Clear Aligners Revenue (billion) Forecast, by Application 2020 & 2033
- Table 26: Brazil Mouthguard and Clear Aligners Volume (K) Forecast, by Application 2020 & 2033
- Table 27: Argentina Mouthguard and Clear Aligners Revenue (billion) Forecast, by Application 2020 & 2033
- Table 28: Argentina Mouthguard and Clear Aligners Volume (K) Forecast, by Application 2020 & 2033
- Table 29: Rest of South America Mouthguard and Clear Aligners Revenue (billion) Forecast, by Application 2020 & 2033
- Table 30: Rest of South America Mouthguard and Clear Aligners Volume (K) Forecast, by Application 2020 & 2033
- Table 31: Global Mouthguard and Clear Aligners Revenue billion Forecast, by Application 2020 & 2033
- Table 32: Global Mouthguard and Clear Aligners Volume K Forecast, by Application 2020 & 2033
- Table 33: Global Mouthguard and Clear Aligners Revenue billion Forecast, by Types 2020 & 2033
- Table 34: Global Mouthguard and Clear Aligners Volume K Forecast, by Types 2020 & 2033
- Table 35: Global Mouthguard and Clear Aligners Revenue billion Forecast, by Country 2020 & 2033
- Table 36: Global Mouthguard and Clear Aligners Volume K Forecast, by Country 2020 & 2033
- Table 37: United Kingdom Mouthguard and Clear Aligners Revenue (billion) Forecast, by Application 2020 & 2033
- Table 38: United Kingdom Mouthguard and Clear Aligners Volume (K) Forecast, by Application 2020 & 2033
- Table 39: Germany Mouthguard and Clear Aligners Revenue (billion) Forecast, by Application 2020 & 2033
- Table 40: Germany Mouthguard and Clear Aligners Volume (K) Forecast, by Application 2020 & 2033
- Table 41: France Mouthguard and Clear Aligners Revenue (billion) Forecast, by Application 2020 & 2033
- Table 42: France Mouthguard and Clear Aligners Volume (K) Forecast, by Application 2020 & 2033
- Table 43: Italy Mouthguard and Clear Aligners Revenue (billion) Forecast, by Application 2020 & 2033
- Table 44: Italy Mouthguard and Clear Aligners Volume (K) Forecast, by Application 2020 & 2033
- Table 45: Spain Mouthguard and Clear Aligners Revenue (billion) Forecast, by Application 2020 & 2033
- Table 46: Spain Mouthguard and Clear Aligners Volume (K) Forecast, by Application 2020 & 2033
- Table 47: Russia Mouthguard and Clear Aligners Revenue (billion) Forecast, by Application 2020 & 2033
- Table 48: Russia Mouthguard and Clear Aligners Volume (K) Forecast, by Application 2020 & 2033
- Table 49: Benelux Mouthguard and Clear Aligners Revenue (billion) Forecast, by Application 2020 & 2033
- Table 50: Benelux Mouthguard and Clear Aligners Volume (K) Forecast, by Application 2020 & 2033
- Table 51: Nordics Mouthguard and Clear Aligners Revenue (billion) Forecast, by Application 2020 & 2033
- Table 52: Nordics Mouthguard and Clear Aligners Volume (K) Forecast, by Application 2020 & 2033
- Table 53: Rest of Europe Mouthguard and Clear Aligners Revenue (billion) Forecast, by Application 2020 & 2033
- Table 54: Rest of Europe Mouthguard and Clear Aligners Volume (K) Forecast, by Application 2020 & 2033
- Table 55: Global Mouthguard and Clear Aligners Revenue billion Forecast, by Application 2020 & 2033
- Table 56: Global Mouthguard and Clear Aligners Volume K Forecast, by Application 2020 & 2033
- Table 57: Global Mouthguard and Clear Aligners Revenue billion Forecast, by Types 2020 & 2033
- Table 58: Global Mouthguard and Clear Aligners Volume K Forecast, by Types 2020 & 2033
- Table 59: Global Mouthguard and Clear Aligners Revenue billion Forecast, by Country 2020 & 2033
- Table 60: Global Mouthguard and Clear Aligners Volume K Forecast, by Country 2020 & 2033
- Table 61: Turkey Mouthguard and Clear Aligners Revenue (billion) Forecast, by Application 2020 & 2033
- Table 62: Turkey Mouthguard and Clear Aligners Volume (K) Forecast, by Application 2020 & 2033
- Table 63: Israel Mouthguard and Clear Aligners Revenue (billion) Forecast, by Application 2020 & 2033
- Table 64: Israel Mouthguard and Clear Aligners Volume (K) Forecast, by Application 2020 & 2033
- Table 65: GCC Mouthguard and Clear Aligners Revenue (billion) Forecast, by Application 2020 & 2033
- Table 66: GCC Mouthguard and Clear Aligners Volume (K) Forecast, by Application 2020 & 2033
- Table 67: North Africa Mouthguard and Clear Aligners Revenue (billion) Forecast, by Application 2020 & 2033
- Table 68: North Africa Mouthguard and Clear Aligners Volume (K) Forecast, by Application 2020 & 2033
- Table 69: South Africa Mouthguard and Clear Aligners Revenue (billion) Forecast, by Application 2020 & 2033
- Table 70: South Africa Mouthguard and Clear Aligners Volume (K) Forecast, by Application 2020 & 2033
- Table 71: Rest of Middle East & Africa Mouthguard and Clear Aligners Revenue (billion) Forecast, by Application 2020 & 2033
- Table 72: Rest of Middle East & Africa Mouthguard and Clear Aligners Volume (K) Forecast, by Application 2020 & 2033
- Table 73: Global Mouthguard and Clear Aligners Revenue billion Forecast, by Application 2020 & 2033
- Table 74: Global Mouthguard and Clear Aligners Volume K Forecast, by Application 2020 & 2033
- Table 75: Global Mouthguard and Clear Aligners Revenue billion Forecast, by Types 2020 & 2033
- Table 76: Global Mouthguard and Clear Aligners Volume K Forecast, by Types 2020 & 2033
- Table 77: Global Mouthguard and Clear Aligners Revenue billion Forecast, by Country 2020 & 2033
- Table 78: Global Mouthguard and Clear Aligners Volume K Forecast, by Country 2020 & 2033
- Table 79: China Mouthguard and Clear Aligners Revenue (billion) Forecast, by Application 2020 & 2033
- Table 80: China Mouthguard and Clear Aligners Volume (K) Forecast, by Application 2020 & 2033
- Table 81: India Mouthguard and Clear Aligners Revenue (billion) Forecast, by Application 2020 & 2033
- Table 82: India Mouthguard and Clear Aligners Volume (K) Forecast, by Application 2020 & 2033
- Table 83: Japan Mouthguard and Clear Aligners Revenue (billion) Forecast, by Application 2020 & 2033
- Table 84: Japan Mouthguard and Clear Aligners Volume (K) Forecast, by Application 2020 & 2033
- Table 85: South Korea Mouthguard and Clear Aligners Revenue (billion) Forecast, by Application 2020 & 2033
- Table 86: South Korea Mouthguard and Clear Aligners Volume (K) Forecast, by Application 2020 & 2033
- Table 87: ASEAN Mouthguard and Clear Aligners Revenue (billion) Forecast, by Application 2020 & 2033
- Table 88: ASEAN Mouthguard and Clear Aligners Volume (K) Forecast, by Application 2020 & 2033
- Table 89: Oceania Mouthguard and Clear Aligners Revenue (billion) Forecast, by Application 2020 & 2033
- Table 90: Oceania Mouthguard and Clear Aligners Volume (K) Forecast, by Application 2020 & 2033
- Table 91: Rest of Asia Pacific Mouthguard and Clear Aligners Revenue (billion) Forecast, by Application 2020 & 2033
- Table 92: Rest of Asia Pacific Mouthguard and Clear Aligners Volume (K) Forecast, by Application 2020 & 2033
Frequently Asked Questions
1. What is the projected Compound Annual Growth Rate (CAGR) of the Mouthguard and Clear Aligners?
The projected CAGR is approximately 13.13%.
2. Which companies are prominent players in the Mouthguard and Clear Aligners?
Key companies in the market include Align Technology, Straumann AG, Dentsply Sirona, Danaher, Akervall Technologies, Apex Sleep, DentCare Dental Lab, Sleep Right, Lumino, DynaFlex, Western Dental.
3. What are the main segments of the Mouthguard and Clear Aligners?
The market segments include Application, Types.
4. Can you provide details about the market size?
The market size is estimated to be USD 3.52 billion as of 2022.
5. What are some drivers contributing to market growth?
N/A
6. What are the notable trends driving market growth?
N/A
7. Are there any restraints impacting market growth?
N/A
8. Can you provide examples of recent developments in the market?
N/A
9. What pricing options are available for accessing the report?
Pricing options include single-user, multi-user, and enterprise licenses priced at USD 4350.00, USD 6525.00, and USD 8700.00 respectively.
10. Is the market size provided in terms of value or volume?
The market size is provided in terms of value, measured in billion and volume, measured in K.
11. Are there any specific market keywords associated with the report?
Yes, the market keyword associated with the report is "Mouthguard and Clear Aligners," which aids in identifying and referencing the specific market segment covered.
12. How do I determine which pricing option suits my needs best?
The pricing options vary based on user requirements and access needs. Individual users may opt for single-user licenses, while businesses requiring broader access may choose multi-user or enterprise licenses for cost-effective access to the report.
13. Are there any additional resources or data provided in the Mouthguard and Clear Aligners report?
While the report offers comprehensive insights, it's advisable to review the specific contents or supplementary materials provided to ascertain if additional resources or data are available.
14. How can I stay updated on further developments or reports in the Mouthguard and Clear Aligners?
To stay informed about further developments, trends, and reports in the Mouthguard and Clear Aligners, consider subscribing to industry newsletters, following relevant companies and organizations, or regularly checking reputable industry news sources and publications.
Methodology
Step 1 - Identification of Relevant Samples Size from Population Database


Step 2 - Approaches for Defining Global Market Size (Value, Volume* & Price*)

Note*: In applicable scenarios
Step 3 - Data Sources
Primary Research
- Web Analytics
- Survey Reports
- Research Institute
- Latest Research Reports
- Opinion Leaders
Secondary Research
- Annual Reports
- White Paper
- Latest Press Release
- Industry Association
- Paid Database
- Investor Presentations

Step 4 - Data Triangulation
Involves using different sources of information in order to increase the validity of a study
These sources are likely to be stakeholders in a program - participants, other researchers, program staff, other community members, and so on.
Then we put all data in single framework & apply various statistical tools to find out the dynamic on the market.
During the analysis stage, feedback from the stakeholder groups would be compared to determine areas of agreement as well as areas of divergence