

Key Insights
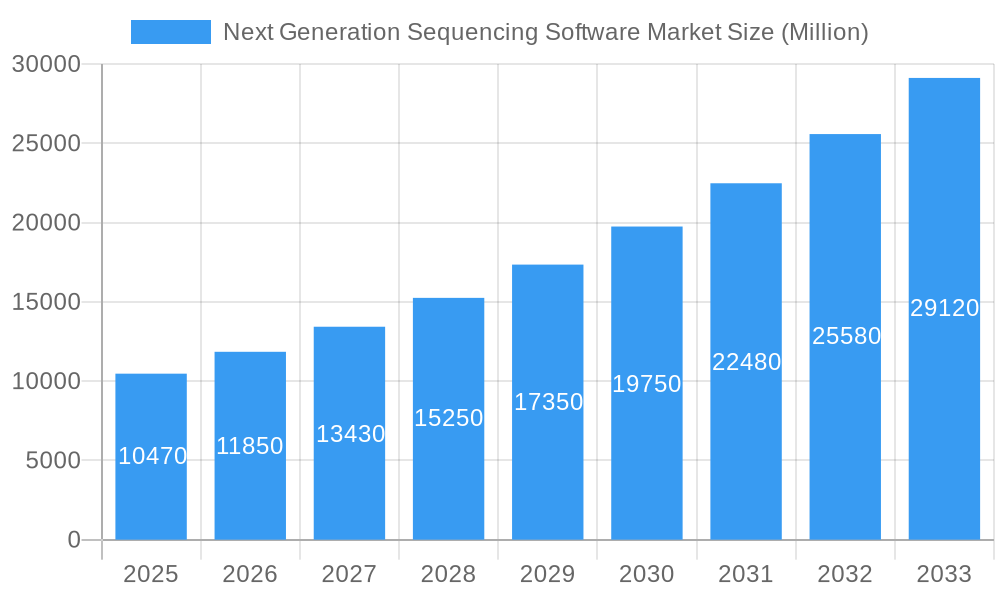
The Next Generation Sequencing (NGS) software market, valued at $10.47 billion in 2025, is poised for robust growth, exhibiting a Compound Annual Growth Rate (CAGR) of 13.43% from 2025 to 2033. This expansion is fueled by several key drivers. The increasing prevalence of genetic disorders and the rising demand for personalized medicine are significantly boosting the adoption of NGS technologies and their associated software solutions. Furthermore, advancements in NGS technologies themselves, leading to faster, more accurate, and cost-effective sequencing, are creating new opportunities for software providers. The growing focus on data analytics and the need for sophisticated tools to manage and interpret the massive datasets generated by NGS are also contributing to market growth. Major market segments include hospitals and clinics, academic and research institutions, and pharmaceutical companies, all actively seeking advanced software for data analysis, interpretation, and management in applications like drug discovery, genetic screening, and precision medicine. The competitive landscape is characterized by a mix of established players like Illumina, Thermo Fisher Scientific, and Roche, alongside innovative smaller companies specializing in niche applications. Geographic growth is expected to be strong across all regions, with North America and Europe maintaining significant market shares due to advanced healthcare infrastructure and robust research activities. However, rapidly developing economies in Asia-Pacific are showing significant potential for future growth.
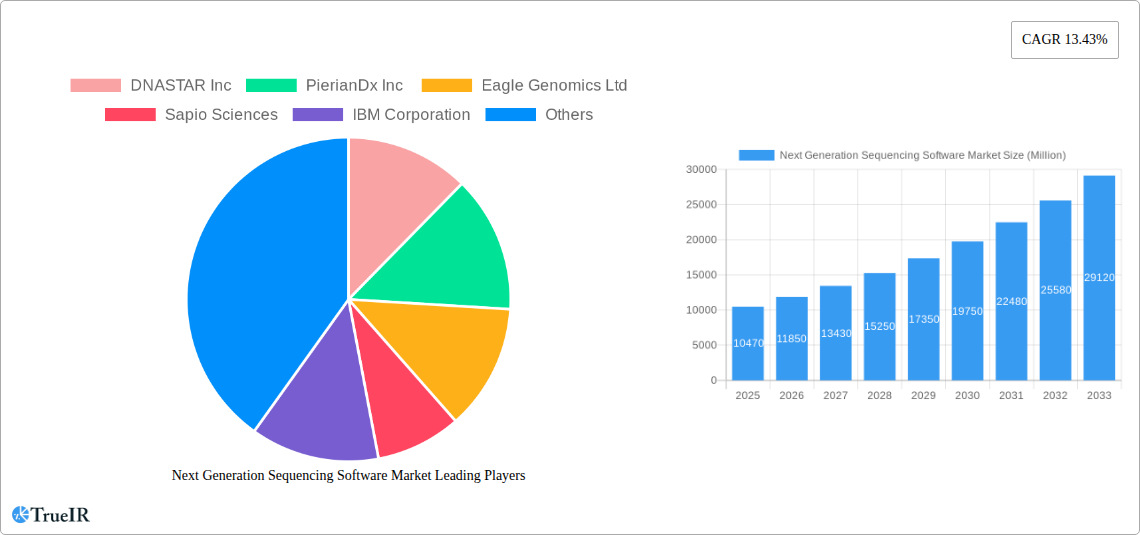
Next Generation Sequencing Software Market Market Size (In Billion)
The market’s future trajectory is likely to be shaped by several trends. The integration of artificial intelligence (AI) and machine learning (ML) into NGS software is expected to enhance data analysis capabilities and improve diagnostic accuracy. Cloud-based solutions are gaining traction, offering scalability and accessibility. Furthermore, the increasing collaboration between software developers and NGS technology providers is fostering the development of integrated workflows and comprehensive solutions. Despite this positive outlook, challenges remain. The complexity of NGS data and the need for specialized expertise can hinder wider adoption, particularly in resource-constrained settings. Data security and privacy concerns also require careful consideration. The ongoing evolution of NGS technologies will require constant adaptation and innovation from software providers to ensure compatibility and maintain market relevance.
Next Generation Sequencing Software Market Company Market Share
Next Generation Sequencing Software Market: A Comprehensive Report (2019-2033)
This dynamic report provides a detailed analysis of the Next Generation Sequencing (NGS) Software market, offering invaluable insights for industry stakeholders. We project a market valued at xx Million in 2025, poised for significant growth throughout the forecast period (2025-2033). The study period covers 2019-2033, with a base year of 2025 and a historical period encompassing 2019-2024. This report leverages comprehensive data and expert analysis to provide a holistic view of this rapidly evolving market.
Next Generation Sequencing Software Market Structure & Competitive Landscape
The NGS software market exhibits a moderately concentrated structure, with several major players holding significant market share. The Herfindahl-Hirschman Index (HHI) is estimated at xx, indicating a competitive yet consolidated landscape. Innovation is a key driver, with companies continuously developing advanced algorithms and user-friendly interfaces to enhance data analysis capabilities. Regulatory approvals and compliance requirements, particularly concerning data privacy and security, significantly impact market dynamics. Product substitutes, such as traditional Sanger sequencing methods, represent a niche competitor segment.
The market is segmented by end-user into Hospitals and Clinics, Academics and Research Institutes, Pharmaceuticals Companies, and Other End Users. Pharmaceutical companies are currently the leading segment, driving approximately xx% of market demand in 2025. Mergers and acquisitions (M&A) activity is relatively high, with an estimated xx number of deals concluded in the past five years, indicating industry consolidation. Key factors driving M&A activity include expansion into new geographic markets and acquisition of proprietary technologies.
- Market Concentration: Moderately Concentrated (HHI: xx)
- Innovation Drivers: Advanced algorithms, user-friendly interfaces.
- Regulatory Impacts: Data privacy, security compliance.
- Product Substitutes: Sanger sequencing methods.
- End-User Segmentation: Pharmaceuticals (xx%), Hospitals & Clinics (xx%), Academics & Research (xx%), Others (xx%).
- M&A Trends: xx deals in the last 5 years, driven by geographic expansion and technology acquisition.
Next Generation Sequencing Software Market Trends & Opportunities
The NGS software market is experiencing robust growth, with a projected Compound Annual Growth Rate (CAGR) of xx% from 2025 to 2033. This growth is fueled by several factors, including the rising adoption of NGS technologies across various applications, an increasing demand for faster and more accurate data analysis, and the growing need for personalized medicine solutions. Technological advancements, such as cloud-based platforms and artificial intelligence (AI)-powered analytics, are driving market penetration, particularly in the pharmaceutical and research sectors. Market penetration is currently estimated at xx% in the key regions but is projected to reach xx% by 2033. Consumer preferences are shifting towards user-friendly, scalable, and cost-effective solutions, pushing software providers to innovate. Competitive dynamics are marked by continuous product development, strategic partnerships, and collaborations to gain a larger market share.
Dominant Markets & Segments in Next Generation Sequencing Software Market
The North American region currently dominates the NGS software market, driven by significant investments in research and development, and the early adoption of advanced technologies. Within North America, the United States holds the largest market share. However, the Asia-Pacific region is witnessing rapid growth due to increasing healthcare expenditure and rising awareness of precision medicine.
- Leading Regions: North America (United States), followed by Asia-Pacific.
- Dominant End-User Segment: Pharmaceutical Companies.
- Fastest Growing Segment: Academics and Research Institutes (driven by government funding and research initiatives).
- Key Growth Drivers in North America: High healthcare spending, robust research infrastructure, stringent regulatory frameworks.
- Key Growth Drivers in Asia-Pacific: Increasing healthcare spending, rising prevalence of chronic diseases, growing adoption of personalized medicine approaches.
Dominant Product and Service Segments:
- NGS Informatics Services: High demand for comprehensive services, including data management, analysis, and interpretation.
- Data Analysis and Management Tools: Market dominance due to the critical role these tools play in handling large NGS datasets.
- Data Interpretation and Reporting Tools: Growth driven by the need for user-friendly tools translating complex data into meaningful insights.
Dominant Application Segment:
- Drug Discovery: The primary application, driving substantial growth due to the development of targeted therapies and personalized medicines.
- Precision Medicine: Significant growth fueled by increasing demand for individualized treatment plans.
- Genetic Screening: Growth driven by the increasing need for early disease detection and prevention.
Next Generation Sequencing Software Market Product Analysis
The NGS software market is characterized by a wide range of products and services, including data management tools, analysis platforms, and interpretation software. Technological advancements, such as cloud-based solutions, AI-powered algorithms, and integration with other laboratory information management systems (LIMS), are key differentiators. The success of NGS software hinges on its accuracy, speed, user-friendliness, and scalability to address the growing volume of genomic data. Companies are increasingly focusing on providing integrated solutions that streamline the entire NGS workflow from sample preparation to report generation, providing a competitive edge.
Key Drivers, Barriers & Challenges in Next Generation Sequencing Software Market
Key Drivers:
- Technological Advancements: AI-powered analytics, cloud-based platforms, improved algorithms.
- Growing Demand for Personalized Medicine: The need for tailored treatment plans fuels market growth.
- Increasing Research Funding: Government and private investment in genomics research drives demand.
Challenges & Restraints:
- High Initial Investment Costs: The cost of NGS software and implementation can be a barrier for smaller organizations.
- Data Security and Privacy Concerns: Protecting sensitive patient data is crucial and requires robust security measures.
- Complexity of Data Analysis: The interpretation of NGS data requires specialized skills, which may limit adoption.
- Regulatory Hurdles: Compliance requirements in different regions add complexity and costs.
- Competitive Pressure: The market's intense competition necessitates continuous innovation.
Growth Drivers in the Next Generation Sequencing Software Market Market
The NGS software market is primarily driven by advancements in NGS technologies, the increasing demand for personalized medicine and diagnostics, and substantial investments in genomic research and development. Government initiatives promoting precision medicine also contribute significantly. The growing availability of high-throughput sequencing systems and decreasing sequencing costs further accelerate market growth.
Challenges Impacting Next Generation Sequencing Software Market Growth
Challenges impacting growth include the high cost of software and implementation, the need for specialized skills for data analysis, and strict data privacy regulations. The complexity of NGS data and the potential for analytical errors also pose significant challenges, impacting market adoption. Furthermore, intense competition necessitates continuous innovation to maintain a competitive advantage.
Key Players Shaping the Next Generation Sequencing Software Market Market
- Dnanexus Inc
- Agilent Technologies Inc
- Illumina Inc
- Thermo Fischer Scientific Inc
- DNASTAR Inc
- PierianDx Inc
- Eagle Genomics Ltd
- Sapio Sciences
- IBM Corporation
- Partek Incorporated
- F Hoffmann-La Roche Ltd
- Intrexon Bioinformatics Germany GmbH (Genomatix AG)
- Real Time Genomics Inc
- GENEWIZ Inc
- BIOVIA(Dassault Systemes)
- PerkinElmer Inc
- Qiagen NV
- Fabric Genomics Inc (Omicia Inc )
- SoftGenetics LLC
Significant Next Generation Sequencing Software Market Industry Milestones
- May 2022: NanoString Technologies, Inc. announced a seamless, cloud-based workflow for improved spatial data analysis using Illumina NextSeq systems and the GeoMx Digital Spatial Profiler. This significantly enhanced the usability and efficiency of spatial genomics data analysis.
- March 2022: ARUP launched a new bioinformatics platform, improving the speed and accuracy of NGS test results, impacting turnaround times and diagnostic capabilities.
Future Outlook for Next Generation Sequencing Software Market Market
The future of the NGS software market is exceptionally promising, driven by ongoing technological innovations, expanding applications, and the growing adoption of precision medicine. Strategic partnerships, collaborations, and continued investment in research and development will fuel further market expansion. The integration of AI and machine learning will enhance data analysis capabilities, leading to more accurate and faster results. The market is poised for substantial growth, with ample opportunities for companies to capitalize on the increasing demand for sophisticated NGS software solutions.
Next Generation Sequencing Software Market Segmentation
-
1. Products and Services
- 1.1. NGS Informatics Services
-
1.2. Data Analysis and Management Tool
- 1.2.1. Storage and Computing Tool
- 1.2.2. Laboratory Information Management System (LIMS)
- 1.2.3. Data Interpretation and Reporting Tools
- 1.3. Primary and Secondary Data Analysis Tools
-
2. Application
- 2.1. Drug Discovery
- 2.2. Genetic Screening
- 2.3. Precision Medicine
- 2.4. Other Applications
-
3. End User
- 3.1. Hospitals and Clinics
- 3.2. Academics and Research Institutes
- 3.3. Pharmaceuticals Companies
- 3.4. Other End Users
Next Generation Sequencing Software Market Segmentation By Geography
-
1. North America
- 1.1. United States
- 1.2. Canada
- 1.3. Mexico
-
2. Europe
- 2.1. Germany
- 2.2. United Kingdom
- 2.3. France
- 2.4. Italy
- 2.5. Spain
- 2.6. Rest of Europe
-
3. Asia pacific
- 3.1. China
- 3.2. Japan
- 3.3. India
- 3.4. Australia
- 3.5. South Korea
- 3.6. Rest of Asia pacific
-
4. Middle East and Africa
- 4.1. GCC
- 4.2. South Africa
- 4.3. Rest of Middle East and Africa
-
5. South America
- 5.1. Brazil
- 5.2. Argentina
- 5.3. Rest of South America
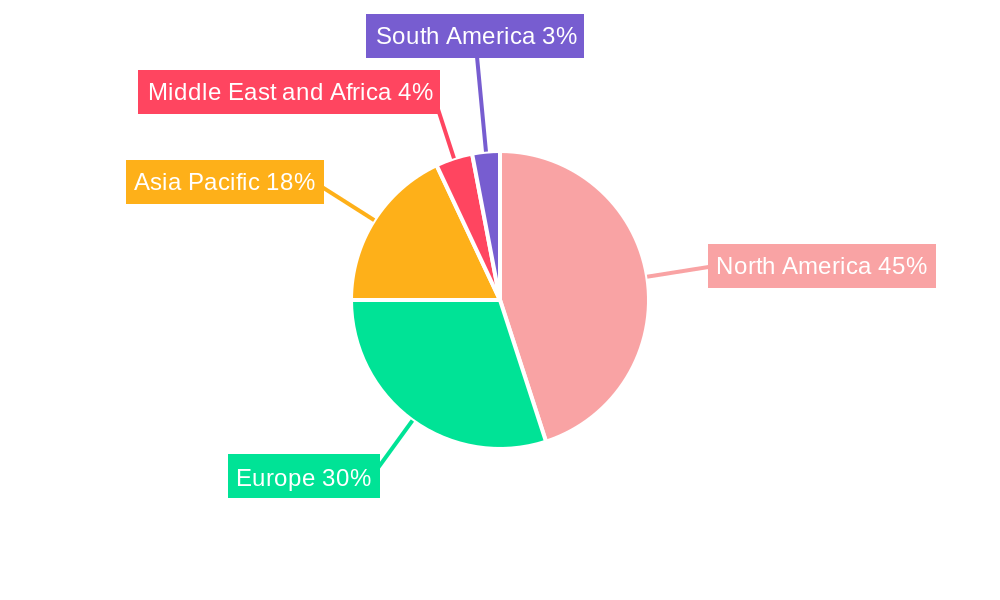
Next Generation Sequencing Software Market Regional Market Share
Geographic Coverage of Next Generation Sequencing Software Market
Next Generation Sequencing Software Market REPORT HIGHLIGHTS
| Aspects | Details |
|---|---|
| Study Period | 2020-2034 |
| Base Year | 2025 |
| Estimated Year | 2026 |
| Forecast Period | 2026-2034 |
| Historical Period | 2020-2025 |
| Growth Rate | CAGR of 13.43% from 2020-2034 |
| Segmentation |
|
Table of Contents
- 1. Introduction
- 1.1. Research Scope
- 1.2. Market Segmentation
- 1.3. Research Objective
- 1.4. Definitions and Assumptions
- 2. Executive Summary
- 2.1. Market Snapshot
- 3. Market Dynamics
- 3.1. Market Drivers
- 3.2. Market Restrains
- 3.3. Market Trends
- 3.4. Market Opportunities
- 4. Market Factor Analysis
- 4.1. Porters Five Forces
- 4.1.1. Bargaining Power of Suppliers
- 4.1.2. Bargaining Power of Buyers
- 4.1.3. Threat of New Entrants
- 4.1.4. Threat of Substitutes
- 4.1.5. Competitive Rivalry
- 4.2. PESTEL analysis
- 4.3. BCG Analysis
- 4.3.1. Stars (High Growth, High Market Share)
- 4.3.2. Cash Cows (Low Growth, High Market Share)
- 4.3.3. Question Mark (High Growth, Low Market Share)
- 4.3.4. Dogs (Low Growth, Low Market Share)
- 4.4. Ansoff Matrix Analysis
- 4.5. Supply Chain Analysis
- 4.6. Regulatory Landscape
- 4.7. Current Market Potential and Opportunity Assessment (TAM–SAM–SOM Framework)
- 4.8. TIR Analyst Note
- 4.1. Porters Five Forces
- 5. Market Analysis, Insights and Forecast 2021-2033
- 5.1. Market Analysis, Insights and Forecast - by Products and Services
- 5.1.1. NGS Informatics Services
- 5.1.2. Data Analysis and Management Tool
- 5.1.2.1. Storage and Computing Tool
- 5.1.2.2. Laboratory Information Management System (LIMS)
- 5.1.2.3. Data Interpretation and Reporting Tools
- 5.1.3. Primary and Secondary Data Analysis Tools
- 5.2. Market Analysis, Insights and Forecast - by Application
- 5.2.1. Drug Discovery
- 5.2.2. Genetic Screening
- 5.2.3. Precision Medicine
- 5.2.4. Other Applications
- 5.3. Market Analysis, Insights and Forecast - by End User
- 5.3.1. Hospitals and Clinics
- 5.3.2. Academics and Research Institutes
- 5.3.3. Pharmaceuticals Companies
- 5.3.4. Other End Users
- 5.4. Market Analysis, Insights and Forecast - by Region
- 5.4.1. North America
- 5.4.2. Europe
- 5.4.3. Asia pacific
- 5.4.4. Middle East and Africa
- 5.4.5. South America
- 5.1. Market Analysis, Insights and Forecast - by Products and Services
- 6. Global Next Generation Sequencing Software Market Analysis, Insights and Forecast, 2021-2033
- 6.1. Market Analysis, Insights and Forecast - by Products and Services
- 6.1.1. NGS Informatics Services
- 6.1.2. Data Analysis and Management Tool
- 6.1.2.1. Storage and Computing Tool
- 6.1.2.2. Laboratory Information Management System (LIMS)
- 6.1.2.3. Data Interpretation and Reporting Tools
- 6.1.3. Primary and Secondary Data Analysis Tools
- 6.2. Market Analysis, Insights and Forecast - by Application
- 6.2.1. Drug Discovery
- 6.2.2. Genetic Screening
- 6.2.3. Precision Medicine
- 6.2.4. Other Applications
- 6.3. Market Analysis, Insights and Forecast - by End User
- 6.3.1. Hospitals and Clinics
- 6.3.2. Academics and Research Institutes
- 6.3.3. Pharmaceuticals Companies
- 6.3.4. Other End Users
- 6.1. Market Analysis, Insights and Forecast - by Products and Services
- 7. North America Next Generation Sequencing Software Market Analysis, Insights and Forecast, 2020-2032
- 7.1. Market Analysis, Insights and Forecast - by Products and Services
- 7.1.1. NGS Informatics Services
- 7.1.2. Data Analysis and Management Tool
- 7.1.2.1. Storage and Computing Tool
- 7.1.2.2. Laboratory Information Management System (LIMS)
- 7.1.2.3. Data Interpretation and Reporting Tools
- 7.1.3. Primary and Secondary Data Analysis Tools
- 7.2. Market Analysis, Insights and Forecast - by Application
- 7.2.1. Drug Discovery
- 7.2.2. Genetic Screening
- 7.2.3. Precision Medicine
- 7.2.4. Other Applications
- 7.3. Market Analysis, Insights and Forecast - by End User
- 7.3.1. Hospitals and Clinics
- 7.3.2. Academics and Research Institutes
- 7.3.3. Pharmaceuticals Companies
- 7.3.4. Other End Users
- 7.1. Market Analysis, Insights and Forecast - by Products and Services
- 8. Europe Next Generation Sequencing Software Market Analysis, Insights and Forecast, 2020-2032
- 8.1. Market Analysis, Insights and Forecast - by Products and Services
- 8.1.1. NGS Informatics Services
- 8.1.2. Data Analysis and Management Tool
- 8.1.2.1. Storage and Computing Tool
- 8.1.2.2. Laboratory Information Management System (LIMS)
- 8.1.2.3. Data Interpretation and Reporting Tools
- 8.1.3. Primary and Secondary Data Analysis Tools
- 8.2. Market Analysis, Insights and Forecast - by Application
- 8.2.1. Drug Discovery
- 8.2.2. Genetic Screening
- 8.2.3. Precision Medicine
- 8.2.4. Other Applications
- 8.3. Market Analysis, Insights and Forecast - by End User
- 8.3.1. Hospitals and Clinics
- 8.3.2. Academics and Research Institutes
- 8.3.3. Pharmaceuticals Companies
- 8.3.4. Other End Users
- 8.1. Market Analysis, Insights and Forecast - by Products and Services
- 9. Asia pacific Next Generation Sequencing Software Market Analysis, Insights and Forecast, 2020-2032
- 9.1. Market Analysis, Insights and Forecast - by Products and Services
- 9.1.1. NGS Informatics Services
- 9.1.2. Data Analysis and Management Tool
- 9.1.2.1. Storage and Computing Tool
- 9.1.2.2. Laboratory Information Management System (LIMS)
- 9.1.2.3. Data Interpretation and Reporting Tools
- 9.1.3. Primary and Secondary Data Analysis Tools
- 9.2. Market Analysis, Insights and Forecast - by Application
- 9.2.1. Drug Discovery
- 9.2.2. Genetic Screening
- 9.2.3. Precision Medicine
- 9.2.4. Other Applications
- 9.3. Market Analysis, Insights and Forecast - by End User
- 9.3.1. Hospitals and Clinics
- 9.3.2. Academics and Research Institutes
- 9.3.3. Pharmaceuticals Companies
- 9.3.4. Other End Users
- 9.1. Market Analysis, Insights and Forecast - by Products and Services
- 10. Middle East and Africa Next Generation Sequencing Software Market Analysis, Insights and Forecast, 2020-2032
- 10.1. Market Analysis, Insights and Forecast - by Products and Services
- 10.1.1. NGS Informatics Services
- 10.1.2. Data Analysis and Management Tool
- 10.1.2.1. Storage and Computing Tool
- 10.1.2.2. Laboratory Information Management System (LIMS)
- 10.1.2.3. Data Interpretation and Reporting Tools
- 10.1.3. Primary and Secondary Data Analysis Tools
- 10.2. Market Analysis, Insights and Forecast - by Application
- 10.2.1. Drug Discovery
- 10.2.2. Genetic Screening
- 10.2.3. Precision Medicine
- 10.2.4. Other Applications
- 10.3. Market Analysis, Insights and Forecast - by End User
- 10.3.1. Hospitals and Clinics
- 10.3.2. Academics and Research Institutes
- 10.3.3. Pharmaceuticals Companies
- 10.3.4. Other End Users
- 10.1. Market Analysis, Insights and Forecast - by Products and Services
- 11. South America Next Generation Sequencing Software Market Analysis, Insights and Forecast, 2020-2032
- 11.1. Market Analysis, Insights and Forecast - by Products and Services
- 11.1.1. NGS Informatics Services
- 11.1.2. Data Analysis and Management Tool
- 11.1.2.1. Storage and Computing Tool
- 11.1.2.2. Laboratory Information Management System (LIMS)
- 11.1.2.3. Data Interpretation and Reporting Tools
- 11.1.3. Primary and Secondary Data Analysis Tools
- 11.2. Market Analysis, Insights and Forecast - by Application
- 11.2.1. Drug Discovery
- 11.2.2. Genetic Screening
- 11.2.3. Precision Medicine
- 11.2.4. Other Applications
- 11.3. Market Analysis, Insights and Forecast - by End User
- 11.3.1. Hospitals and Clinics
- 11.3.2. Academics and Research Institutes
- 11.3.3. Pharmaceuticals Companies
- 11.3.4. Other End Users
- 11.1. Market Analysis, Insights and Forecast - by Products and Services
- 12. Competitive Analysis
- 12.1. Company Profiles
- 12.1.1 DNASTAR Inc
- 12.1.1.1. Company Overview
- 12.1.1.2. Products
- 12.1.1.3. Company Financials
- 12.1.1.4. SWOT Analysis
- 12.1.2 PierianDx Inc
- 12.1.2.1. Company Overview
- 12.1.2.2. Products
- 12.1.2.3. Company Financials
- 12.1.2.4. SWOT Analysis
- 12.1.3 Eagle Genomics Ltd
- 12.1.3.1. Company Overview
- 12.1.3.2. Products
- 12.1.3.3. Company Financials
- 12.1.3.4. SWOT Analysis
- 12.1.4 Sapio Sciences
- 12.1.4.1. Company Overview
- 12.1.4.2. Products
- 12.1.4.3. Company Financials
- 12.1.4.4. SWOT Analysis
- 12.1.5 IBM Corporation
- 12.1.5.1. Company Overview
- 12.1.5.2. Products
- 12.1.5.3. Company Financials
- 12.1.5.4. SWOT Analysis
- 12.1.6 Partek Incorporated
- 12.1.6.1. Company Overview
- 12.1.6.2. Products
- 12.1.6.3. Company Financials
- 12.1.6.4. SWOT Analysis
- 12.1.7 F Hoffmann-La Roche Ltd
- 12.1.7.1. Company Overview
- 12.1.7.2. Products
- 12.1.7.3. Company Financials
- 12.1.7.4. SWOT Analysis
- 12.1.8 Intrexon Bioinformatics Germany GmbH (Genomatix AG)
- 12.1.8.1. Company Overview
- 12.1.8.2. Products
- 12.1.8.3. Company Financials
- 12.1.8.4. SWOT Analysis
- 12.1.9 Agilent Technologies Inc
- 12.1.9.1. Company Overview
- 12.1.9.2. Products
- 12.1.9.3. Company Financials
- 12.1.9.4. SWOT Analysis
- 12.1.10 Dnanexus Inc
- 12.1.10.1. Company Overview
- 12.1.10.2. Products
- 12.1.10.3. Company Financials
- 12.1.10.4. SWOT Analysis
- 12.1.11 Real Time Genomics Inc
- 12.1.11.1. Company Overview
- 12.1.11.2. Products
- 12.1.11.3. Company Financials
- 12.1.11.4. SWOT Analysis
- 12.1.12 GENEWIZ Inc
- 12.1.12.1. Company Overview
- 12.1.12.2. Products
- 12.1.12.3. Company Financials
- 12.1.12.4. SWOT Analysis
- 12.1.13 Thermo Fischer Scientific Inc
- 12.1.13.1. Company Overview
- 12.1.13.2. Products
- 12.1.13.3. Company Financials
- 12.1.13.4. SWOT Analysis
- 12.1.14 llumina Inc
- 12.1.14.1. Company Overview
- 12.1.14.2. Products
- 12.1.14.3. Company Financials
- 12.1.14.4. SWOT Analysis
- 12.1.15 BIOVIA(Dassault Systemes)
- 12.1.15.1. Company Overview
- 12.1.15.2. Products
- 12.1.15.3. Company Financials
- 12.1.15.4. SWOT Analysis
- 12.1.16 PerkinElmer Inc
- 12.1.16.1. Company Overview
- 12.1.16.2. Products
- 12.1.16.3. Company Financials
- 12.1.16.4. SWOT Analysis
- 12.1.17 Qiagen NV
- 12.1.17.1. Company Overview
- 12.1.17.2. Products
- 12.1.17.3. Company Financials
- 12.1.17.4. SWOT Analysis
- 12.1.18 Fabric Genomics Inc (Omicia Inc )
- 12.1.18.1. Company Overview
- 12.1.18.2. Products
- 12.1.18.3. Company Financials
- 12.1.18.4. SWOT Analysis
- 12.1.19 SoftGenetics LLC
- 12.1.19.1. Company Overview
- 12.1.19.2. Products
- 12.1.19.3. Company Financials
- 12.1.19.4. SWOT Analysis
- 12.1.1 DNASTAR Inc
- 12.2. Market Entropy
- 12.2.1 Company's Key Areas Served
- 12.2.2 Recent Developments
- 12.3. Company Market Share Analysis 2025
- 12.3.1 Top 5 Companies Market Share Analysis
- 12.3.2 Top 3 Companies Market Share Analysis
- 12.4. List of Potential Customers
- 13. Research Methodology
List of Figures
- Figure 1: Global Next Generation Sequencing Software Market Revenue Breakdown (Million, %) by Region 2025 & 2033
- Figure 2: Global Next Generation Sequencing Software Market Volume Breakdown (K Unit, %) by Region 2025 & 2033
- Figure 3: North America Next Generation Sequencing Software Market Revenue (Million), by Products and Services 2025 & 2033
- Figure 4: North America Next Generation Sequencing Software Market Volume (K Unit), by Products and Services 2025 & 2033
- Figure 5: North America Next Generation Sequencing Software Market Revenue Share (%), by Products and Services 2025 & 2033
- Figure 6: North America Next Generation Sequencing Software Market Volume Share (%), by Products and Services 2025 & 2033
- Figure 7: North America Next Generation Sequencing Software Market Revenue (Million), by Application 2025 & 2033
- Figure 8: North America Next Generation Sequencing Software Market Volume (K Unit), by Application 2025 & 2033
- Figure 9: North America Next Generation Sequencing Software Market Revenue Share (%), by Application 2025 & 2033
- Figure 10: North America Next Generation Sequencing Software Market Volume Share (%), by Application 2025 & 2033
- Figure 11: North America Next Generation Sequencing Software Market Revenue (Million), by End User 2025 & 2033
- Figure 12: North America Next Generation Sequencing Software Market Volume (K Unit), by End User 2025 & 2033
- Figure 13: North America Next Generation Sequencing Software Market Revenue Share (%), by End User 2025 & 2033
- Figure 14: North America Next Generation Sequencing Software Market Volume Share (%), by End User 2025 & 2033
- Figure 15: North America Next Generation Sequencing Software Market Revenue (Million), by Country 2025 & 2033
- Figure 16: North America Next Generation Sequencing Software Market Volume (K Unit), by Country 2025 & 2033
- Figure 17: North America Next Generation Sequencing Software Market Revenue Share (%), by Country 2025 & 2033
- Figure 18: North America Next Generation Sequencing Software Market Volume Share (%), by Country 2025 & 2033
- Figure 19: Europe Next Generation Sequencing Software Market Revenue (Million), by Products and Services 2025 & 2033
- Figure 20: Europe Next Generation Sequencing Software Market Volume (K Unit), by Products and Services 2025 & 2033
- Figure 21: Europe Next Generation Sequencing Software Market Revenue Share (%), by Products and Services 2025 & 2033
- Figure 22: Europe Next Generation Sequencing Software Market Volume Share (%), by Products and Services 2025 & 2033
- Figure 23: Europe Next Generation Sequencing Software Market Revenue (Million), by Application 2025 & 2033
- Figure 24: Europe Next Generation Sequencing Software Market Volume (K Unit), by Application 2025 & 2033
- Figure 25: Europe Next Generation Sequencing Software Market Revenue Share (%), by Application 2025 & 2033
- Figure 26: Europe Next Generation Sequencing Software Market Volume Share (%), by Application 2025 & 2033
- Figure 27: Europe Next Generation Sequencing Software Market Revenue (Million), by End User 2025 & 2033
- Figure 28: Europe Next Generation Sequencing Software Market Volume (K Unit), by End User 2025 & 2033
- Figure 29: Europe Next Generation Sequencing Software Market Revenue Share (%), by End User 2025 & 2033
- Figure 30: Europe Next Generation Sequencing Software Market Volume Share (%), by End User 2025 & 2033
- Figure 31: Europe Next Generation Sequencing Software Market Revenue (Million), by Country 2025 & 2033
- Figure 32: Europe Next Generation Sequencing Software Market Volume (K Unit), by Country 2025 & 2033
- Figure 33: Europe Next Generation Sequencing Software Market Revenue Share (%), by Country 2025 & 2033
- Figure 34: Europe Next Generation Sequencing Software Market Volume Share (%), by Country 2025 & 2033
- Figure 35: Asia pacific Next Generation Sequencing Software Market Revenue (Million), by Products and Services 2025 & 2033
- Figure 36: Asia pacific Next Generation Sequencing Software Market Volume (K Unit), by Products and Services 2025 & 2033
- Figure 37: Asia pacific Next Generation Sequencing Software Market Revenue Share (%), by Products and Services 2025 & 2033
- Figure 38: Asia pacific Next Generation Sequencing Software Market Volume Share (%), by Products and Services 2025 & 2033
- Figure 39: Asia pacific Next Generation Sequencing Software Market Revenue (Million), by Application 2025 & 2033
- Figure 40: Asia pacific Next Generation Sequencing Software Market Volume (K Unit), by Application 2025 & 2033
- Figure 41: Asia pacific Next Generation Sequencing Software Market Revenue Share (%), by Application 2025 & 2033
- Figure 42: Asia pacific Next Generation Sequencing Software Market Volume Share (%), by Application 2025 & 2033
- Figure 43: Asia pacific Next Generation Sequencing Software Market Revenue (Million), by End User 2025 & 2033
- Figure 44: Asia pacific Next Generation Sequencing Software Market Volume (K Unit), by End User 2025 & 2033
- Figure 45: Asia pacific Next Generation Sequencing Software Market Revenue Share (%), by End User 2025 & 2033
- Figure 46: Asia pacific Next Generation Sequencing Software Market Volume Share (%), by End User 2025 & 2033
- Figure 47: Asia pacific Next Generation Sequencing Software Market Revenue (Million), by Country 2025 & 2033
- Figure 48: Asia pacific Next Generation Sequencing Software Market Volume (K Unit), by Country 2025 & 2033
- Figure 49: Asia pacific Next Generation Sequencing Software Market Revenue Share (%), by Country 2025 & 2033
- Figure 50: Asia pacific Next Generation Sequencing Software Market Volume Share (%), by Country 2025 & 2033
- Figure 51: Middle East and Africa Next Generation Sequencing Software Market Revenue (Million), by Products and Services 2025 & 2033
- Figure 52: Middle East and Africa Next Generation Sequencing Software Market Volume (K Unit), by Products and Services 2025 & 2033
- Figure 53: Middle East and Africa Next Generation Sequencing Software Market Revenue Share (%), by Products and Services 2025 & 2033
- Figure 54: Middle East and Africa Next Generation Sequencing Software Market Volume Share (%), by Products and Services 2025 & 2033
- Figure 55: Middle East and Africa Next Generation Sequencing Software Market Revenue (Million), by Application 2025 & 2033
- Figure 56: Middle East and Africa Next Generation Sequencing Software Market Volume (K Unit), by Application 2025 & 2033
- Figure 57: Middle East and Africa Next Generation Sequencing Software Market Revenue Share (%), by Application 2025 & 2033
- Figure 58: Middle East and Africa Next Generation Sequencing Software Market Volume Share (%), by Application 2025 & 2033
- Figure 59: Middle East and Africa Next Generation Sequencing Software Market Revenue (Million), by End User 2025 & 2033
- Figure 60: Middle East and Africa Next Generation Sequencing Software Market Volume (K Unit), by End User 2025 & 2033
- Figure 61: Middle East and Africa Next Generation Sequencing Software Market Revenue Share (%), by End User 2025 & 2033
- Figure 62: Middle East and Africa Next Generation Sequencing Software Market Volume Share (%), by End User 2025 & 2033
- Figure 63: Middle East and Africa Next Generation Sequencing Software Market Revenue (Million), by Country 2025 & 2033
- Figure 64: Middle East and Africa Next Generation Sequencing Software Market Volume (K Unit), by Country 2025 & 2033
- Figure 65: Middle East and Africa Next Generation Sequencing Software Market Revenue Share (%), by Country 2025 & 2033
- Figure 66: Middle East and Africa Next Generation Sequencing Software Market Volume Share (%), by Country 2025 & 2033
- Figure 67: South America Next Generation Sequencing Software Market Revenue (Million), by Products and Services 2025 & 2033
- Figure 68: South America Next Generation Sequencing Software Market Volume (K Unit), by Products and Services 2025 & 2033
- Figure 69: South America Next Generation Sequencing Software Market Revenue Share (%), by Products and Services 2025 & 2033
- Figure 70: South America Next Generation Sequencing Software Market Volume Share (%), by Products and Services 2025 & 2033
- Figure 71: South America Next Generation Sequencing Software Market Revenue (Million), by Application 2025 & 2033
- Figure 72: South America Next Generation Sequencing Software Market Volume (K Unit), by Application 2025 & 2033
- Figure 73: South America Next Generation Sequencing Software Market Revenue Share (%), by Application 2025 & 2033
- Figure 74: South America Next Generation Sequencing Software Market Volume Share (%), by Application 2025 & 2033
- Figure 75: South America Next Generation Sequencing Software Market Revenue (Million), by End User 2025 & 2033
- Figure 76: South America Next Generation Sequencing Software Market Volume (K Unit), by End User 2025 & 2033
- Figure 77: South America Next Generation Sequencing Software Market Revenue Share (%), by End User 2025 & 2033
- Figure 78: South America Next Generation Sequencing Software Market Volume Share (%), by End User 2025 & 2033
- Figure 79: South America Next Generation Sequencing Software Market Revenue (Million), by Country 2025 & 2033
- Figure 80: South America Next Generation Sequencing Software Market Volume (K Unit), by Country 2025 & 2033
- Figure 81: South America Next Generation Sequencing Software Market Revenue Share (%), by Country 2025 & 2033
- Figure 82: South America Next Generation Sequencing Software Market Volume Share (%), by Country 2025 & 2033
List of Tables
- Table 1: Global Next Generation Sequencing Software Market Revenue Million Forecast, by Products and Services 2020 & 2033
- Table 2: Global Next Generation Sequencing Software Market Volume K Unit Forecast, by Products and Services 2020 & 2033
- Table 3: Global Next Generation Sequencing Software Market Revenue Million Forecast, by Application 2020 & 2033
- Table 4: Global Next Generation Sequencing Software Market Volume K Unit Forecast, by Application 2020 & 2033
- Table 5: Global Next Generation Sequencing Software Market Revenue Million Forecast, by End User 2020 & 2033
- Table 6: Global Next Generation Sequencing Software Market Volume K Unit Forecast, by End User 2020 & 2033
- Table 7: Global Next Generation Sequencing Software Market Revenue Million Forecast, by Region 2020 & 2033
- Table 8: Global Next Generation Sequencing Software Market Volume K Unit Forecast, by Region 2020 & 2033
- Table 9: Global Next Generation Sequencing Software Market Revenue Million Forecast, by Products and Services 2020 & 2033
- Table 10: Global Next Generation Sequencing Software Market Volume K Unit Forecast, by Products and Services 2020 & 2033
- Table 11: Global Next Generation Sequencing Software Market Revenue Million Forecast, by Application 2020 & 2033
- Table 12: Global Next Generation Sequencing Software Market Volume K Unit Forecast, by Application 2020 & 2033
- Table 13: Global Next Generation Sequencing Software Market Revenue Million Forecast, by End User 2020 & 2033
- Table 14: Global Next Generation Sequencing Software Market Volume K Unit Forecast, by End User 2020 & 2033
- Table 15: Global Next Generation Sequencing Software Market Revenue Million Forecast, by Country 2020 & 2033
- Table 16: Global Next Generation Sequencing Software Market Volume K Unit Forecast, by Country 2020 & 2033
- Table 17: United States Next Generation Sequencing Software Market Revenue (Million) Forecast, by Application 2020 & 2033
- Table 18: United States Next Generation Sequencing Software Market Volume (K Unit) Forecast, by Application 2020 & 2033
- Table 19: Canada Next Generation Sequencing Software Market Revenue (Million) Forecast, by Application 2020 & 2033
- Table 20: Canada Next Generation Sequencing Software Market Volume (K Unit) Forecast, by Application 2020 & 2033
- Table 21: Mexico Next Generation Sequencing Software Market Revenue (Million) Forecast, by Application 2020 & 2033
- Table 22: Mexico Next Generation Sequencing Software Market Volume (K Unit) Forecast, by Application 2020 & 2033
- Table 23: Global Next Generation Sequencing Software Market Revenue Million Forecast, by Products and Services 2020 & 2033
- Table 24: Global Next Generation Sequencing Software Market Volume K Unit Forecast, by Products and Services 2020 & 2033
- Table 25: Global Next Generation Sequencing Software Market Revenue Million Forecast, by Application 2020 & 2033
- Table 26: Global Next Generation Sequencing Software Market Volume K Unit Forecast, by Application 2020 & 2033
- Table 27: Global Next Generation Sequencing Software Market Revenue Million Forecast, by End User 2020 & 2033
- Table 28: Global Next Generation Sequencing Software Market Volume K Unit Forecast, by End User 2020 & 2033
- Table 29: Global Next Generation Sequencing Software Market Revenue Million Forecast, by Country 2020 & 2033
- Table 30: Global Next Generation Sequencing Software Market Volume K Unit Forecast, by Country 2020 & 2033
- Table 31: Germany Next Generation Sequencing Software Market Revenue (Million) Forecast, by Application 2020 & 2033
- Table 32: Germany Next Generation Sequencing Software Market Volume (K Unit) Forecast, by Application 2020 & 2033
- Table 33: United Kingdom Next Generation Sequencing Software Market Revenue (Million) Forecast, by Application 2020 & 2033
- Table 34: United Kingdom Next Generation Sequencing Software Market Volume (K Unit) Forecast, by Application 2020 & 2033
- Table 35: France Next Generation Sequencing Software Market Revenue (Million) Forecast, by Application 2020 & 2033
- Table 36: France Next Generation Sequencing Software Market Volume (K Unit) Forecast, by Application 2020 & 2033
- Table 37: Italy Next Generation Sequencing Software Market Revenue (Million) Forecast, by Application 2020 & 2033
- Table 38: Italy Next Generation Sequencing Software Market Volume (K Unit) Forecast, by Application 2020 & 2033
- Table 39: Spain Next Generation Sequencing Software Market Revenue (Million) Forecast, by Application 2020 & 2033
- Table 40: Spain Next Generation Sequencing Software Market Volume (K Unit) Forecast, by Application 2020 & 2033
- Table 41: Rest of Europe Next Generation Sequencing Software Market Revenue (Million) Forecast, by Application 2020 & 2033
- Table 42: Rest of Europe Next Generation Sequencing Software Market Volume (K Unit) Forecast, by Application 2020 & 2033
- Table 43: Global Next Generation Sequencing Software Market Revenue Million Forecast, by Products and Services 2020 & 2033
- Table 44: Global Next Generation Sequencing Software Market Volume K Unit Forecast, by Products and Services 2020 & 2033
- Table 45: Global Next Generation Sequencing Software Market Revenue Million Forecast, by Application 2020 & 2033
- Table 46: Global Next Generation Sequencing Software Market Volume K Unit Forecast, by Application 2020 & 2033
- Table 47: Global Next Generation Sequencing Software Market Revenue Million Forecast, by End User 2020 & 2033
- Table 48: Global Next Generation Sequencing Software Market Volume K Unit Forecast, by End User 2020 & 2033
- Table 49: Global Next Generation Sequencing Software Market Revenue Million Forecast, by Country 2020 & 2033
- Table 50: Global Next Generation Sequencing Software Market Volume K Unit Forecast, by Country 2020 & 2033
- Table 51: China Next Generation Sequencing Software Market Revenue (Million) Forecast, by Application 2020 & 2033
- Table 52: China Next Generation Sequencing Software Market Volume (K Unit) Forecast, by Application 2020 & 2033
- Table 53: Japan Next Generation Sequencing Software Market Revenue (Million) Forecast, by Application 2020 & 2033
- Table 54: Japan Next Generation Sequencing Software Market Volume (K Unit) Forecast, by Application 2020 & 2033
- Table 55: India Next Generation Sequencing Software Market Revenue (Million) Forecast, by Application 2020 & 2033
- Table 56: India Next Generation Sequencing Software Market Volume (K Unit) Forecast, by Application 2020 & 2033
- Table 57: Australia Next Generation Sequencing Software Market Revenue (Million) Forecast, by Application 2020 & 2033
- Table 58: Australia Next Generation Sequencing Software Market Volume (K Unit) Forecast, by Application 2020 & 2033
- Table 59: South Korea Next Generation Sequencing Software Market Revenue (Million) Forecast, by Application 2020 & 2033
- Table 60: South Korea Next Generation Sequencing Software Market Volume (K Unit) Forecast, by Application 2020 & 2033
- Table 61: Rest of Asia pacific Next Generation Sequencing Software Market Revenue (Million) Forecast, by Application 2020 & 2033
- Table 62: Rest of Asia pacific Next Generation Sequencing Software Market Volume (K Unit) Forecast, by Application 2020 & 2033
- Table 63: Global Next Generation Sequencing Software Market Revenue Million Forecast, by Products and Services 2020 & 2033
- Table 64: Global Next Generation Sequencing Software Market Volume K Unit Forecast, by Products and Services 2020 & 2033
- Table 65: Global Next Generation Sequencing Software Market Revenue Million Forecast, by Application 2020 & 2033
- Table 66: Global Next Generation Sequencing Software Market Volume K Unit Forecast, by Application 2020 & 2033
- Table 67: Global Next Generation Sequencing Software Market Revenue Million Forecast, by End User 2020 & 2033
- Table 68: Global Next Generation Sequencing Software Market Volume K Unit Forecast, by End User 2020 & 2033
- Table 69: Global Next Generation Sequencing Software Market Revenue Million Forecast, by Country 2020 & 2033
- Table 70: Global Next Generation Sequencing Software Market Volume K Unit Forecast, by Country 2020 & 2033
- Table 71: GCC Next Generation Sequencing Software Market Revenue (Million) Forecast, by Application 2020 & 2033
- Table 72: GCC Next Generation Sequencing Software Market Volume (K Unit) Forecast, by Application 2020 & 2033
- Table 73: South Africa Next Generation Sequencing Software Market Revenue (Million) Forecast, by Application 2020 & 2033
- Table 74: South Africa Next Generation Sequencing Software Market Volume (K Unit) Forecast, by Application 2020 & 2033
- Table 75: Rest of Middle East and Africa Next Generation Sequencing Software Market Revenue (Million) Forecast, by Application 2020 & 2033
- Table 76: Rest of Middle East and Africa Next Generation Sequencing Software Market Volume (K Unit) Forecast, by Application 2020 & 2033
- Table 77: Global Next Generation Sequencing Software Market Revenue Million Forecast, by Products and Services 2020 & 2033
- Table 78: Global Next Generation Sequencing Software Market Volume K Unit Forecast, by Products and Services 2020 & 2033
- Table 79: Global Next Generation Sequencing Software Market Revenue Million Forecast, by Application 2020 & 2033
- Table 80: Global Next Generation Sequencing Software Market Volume K Unit Forecast, by Application 2020 & 2033
- Table 81: Global Next Generation Sequencing Software Market Revenue Million Forecast, by End User 2020 & 2033
- Table 82: Global Next Generation Sequencing Software Market Volume K Unit Forecast, by End User 2020 & 2033
- Table 83: Global Next Generation Sequencing Software Market Revenue Million Forecast, by Country 2020 & 2033
- Table 84: Global Next Generation Sequencing Software Market Volume K Unit Forecast, by Country 2020 & 2033
- Table 85: Brazil Next Generation Sequencing Software Market Revenue (Million) Forecast, by Application 2020 & 2033
- Table 86: Brazil Next Generation Sequencing Software Market Volume (K Unit) Forecast, by Application 2020 & 2033
- Table 87: Argentina Next Generation Sequencing Software Market Revenue (Million) Forecast, by Application 2020 & 2033
- Table 88: Argentina Next Generation Sequencing Software Market Volume (K Unit) Forecast, by Application 2020 & 2033
- Table 89: Rest of South America Next Generation Sequencing Software Market Revenue (Million) Forecast, by Application 2020 & 2033
- Table 90: Rest of South America Next Generation Sequencing Software Market Volume (K Unit) Forecast, by Application 2020 & 2033
Frequently Asked Questions
1. What is the projected Compound Annual Growth Rate (CAGR) of the Next Generation Sequencing Software Market?
The projected CAGR is approximately 13.43%.
2. Which companies are prominent players in the Next Generation Sequencing Software Market?
Key companies in the market include DNASTAR Inc, PierianDx Inc , Eagle Genomics Ltd, Sapio Sciences, IBM Corporation, Partek Incorporated, F Hoffmann-La Roche Ltd, Intrexon Bioinformatics Germany GmbH (Genomatix AG), Agilent Technologies Inc, Dnanexus Inc, Real Time Genomics Inc, GENEWIZ Inc, Thermo Fischer Scientific Inc, llumina Inc, BIOVIA(Dassault Systemes), PerkinElmer Inc, Qiagen NV, Fabric Genomics Inc (Omicia Inc ), SoftGenetics LLC.
3. What are the main segments of the Next Generation Sequencing Software Market?
The market segments include Products and Services, Application, End User.
4. Can you provide details about the market size?
The market size is estimated to be USD 10.47 Million as of 2022.
5. What are some drivers contributing to market growth?
Increasing Clinical Applications of NGS; Technological Advancements in NGS Informatics Tools; Growing Preference toward Personalized Medicines and Early Disease Diagnosis; Increasing Demand for NGS Services and Rising Investment by Key Players.
6. What are the notable trends driving market growth?
Genetic Screening Segment. by Application. is Expected to Experience the Fastest Growth in the Market.
7. Are there any restraints impacting market growth?
Lack of Skilled Technicians for NGS Informatics Services; Challenges Associated with Data Storage and Integration.
8. Can you provide examples of recent developments in the market?
May 2022: NanoString Technologies, Inc. announced a seamless, cloud-based workflow that improves customers' spatial data analysis experience using Illumina NextSeq 1000 and NextSeq 2000 sequencing systems and the GeoMx Digital Spatial Profiler.
9. What pricing options are available for accessing the report?
Pricing options include single-user, multi-user, and enterprise licenses priced at USD 4750, USD 5250, and USD 8750 respectively.
10. Is the market size provided in terms of value or volume?
The market size is provided in terms of value, measured in Million and volume, measured in K Unit.
11. Are there any specific market keywords associated with the report?
Yes, the market keyword associated with the report is "Next Generation Sequencing Software Market," which aids in identifying and referencing the specific market segment covered.
12. How do I determine which pricing option suits my needs best?
The pricing options vary based on user requirements and access needs. Individual users may opt for single-user licenses, while businesses requiring broader access may choose multi-user or enterprise licenses for cost-effective access to the report.
13. Are there any additional resources or data provided in the Next Generation Sequencing Software Market report?
While the report offers comprehensive insights, it's advisable to review the specific contents or supplementary materials provided to ascertain if additional resources or data are available.
14. How can I stay updated on further developments or reports in the Next Generation Sequencing Software Market?
To stay informed about further developments, trends, and reports in the Next Generation Sequencing Software Market, consider subscribing to industry newsletters, following relevant companies and organizations, or regularly checking reputable industry news sources and publications.
Methodology
Step 1 - Identification of Relevant Samples Size from Population Database


Step 2 - Approaches for Defining Global Market Size (Value, Volume* & Price*)

Note*: In applicable scenarios
Step 3 - Data Sources
Primary Research
- Web Analytics
- Survey Reports
- Research Institute
- Latest Research Reports
- Opinion Leaders
Secondary Research
- Annual Reports
- White Paper
- Latest Press Release
- Industry Association
- Paid Database
- Investor Presentations

Step 4 - Data Triangulation
Involves using different sources of information in order to increase the validity of a study
These sources are likely to be stakeholders in a program - participants, other researchers, program staff, other community members, and so on.
Then we put all data in single framework & apply various statistical tools to find out the dynamic on the market.
During the analysis stage, feedback from the stakeholder groups would be compared to determine areas of agreement as well as areas of divergence