

Key Insights
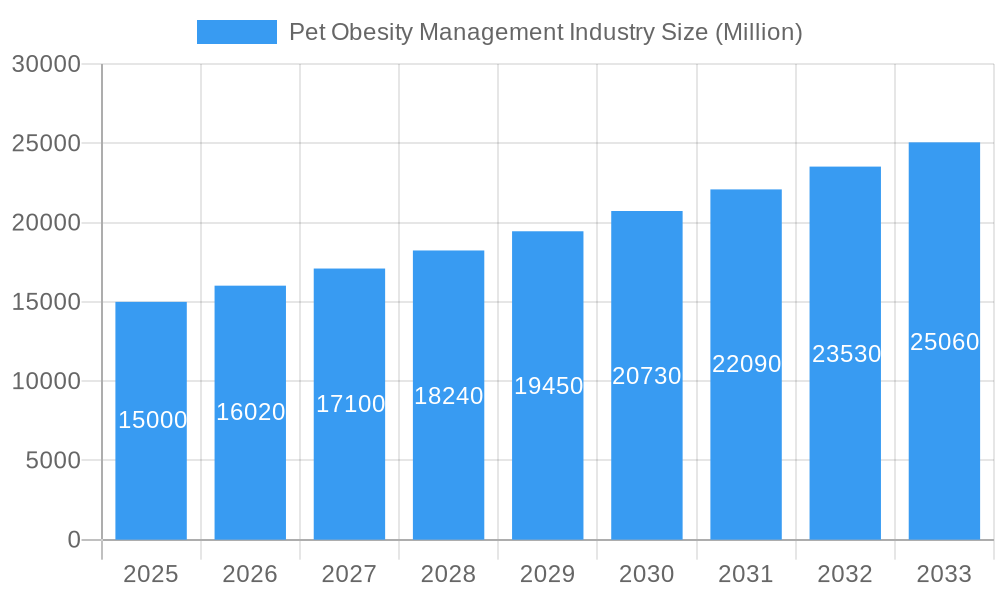
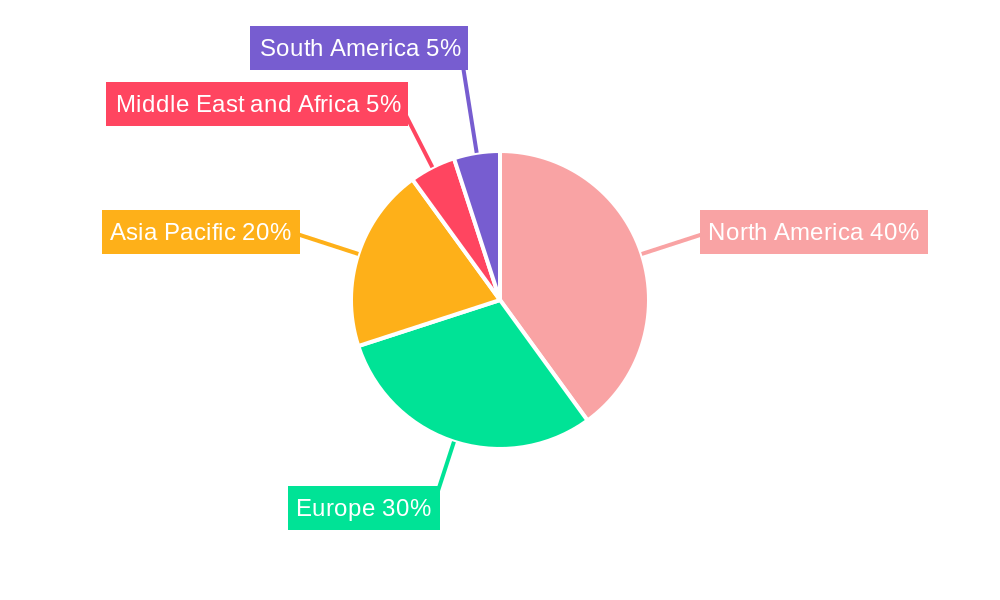
The global pet obesity management market is poised for substantial expansion, driven by escalating pet ownership, the profound humanization of pets, and heightened awareness of obesity-related health risks in companion animals. With a projected Compound Annual Growth Rate (CAGR) of 13.83%, the market is expected to grow from its current size of $9.67 billion in 2025 to a significant valuation by 2033. This upward trajectory is attributed to the increasing availability of specialized products, including prescription diets, supplements, and advanced monitoring technologies. The rising incidence of obesity-related chronic conditions such as diabetes and osteoarthritis in pets further fuels demand for effective management solutions. Segmentation data indicates a strong preference for canine and feline products, with pet specialty stores and e-commerce platforms leading in sales channels. Major contributors like Hill's Pet Nutrition, Royal Canin, and Pfizer Animal Health are instrumental in market advancement through product innovation and strategic alliances. While North America and Europe currently dominate the market share, the Asia-Pacific region is anticipated to exhibit considerable growth, fueled by increasing pet adoption and rising disposable incomes.
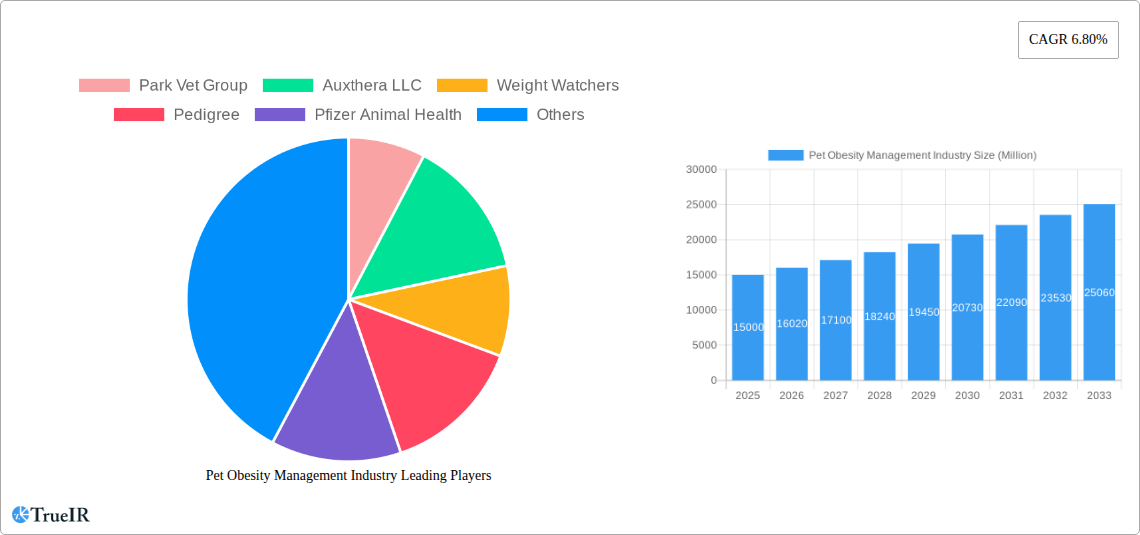
Pet Obesity Management Industry Market Size (In Billion)
The competitive arena features a dynamic interplay between established industry leaders and innovative emerging companies. Leading players leverage their extensive distribution networks and strong brand equity, while new entrants introduce novel products and services, fostering market dynamism. Future market evolution will be shaped by continuous innovation in pet nutrition, advancements in pet health monitoring technology, and increased veterinary recommendations for weight management programs. Key challenges include enhancing consumer education on the long-term consequences of pet obesity and ensuring the accessibility of specialized weight management solutions. Despite these hurdles, the growing emphasis on pet well-being and heightened awareness of health issues strongly support a positive market outlook. The market is forecasted to reach a size exceeding $20 billion by 2033, based on the current growth drivers and projected CAGR.
Pet Obesity Management Industry Company Market Share
Pet Obesity Management Industry: A Comprehensive Market Report (2019-2033)
This comprehensive report provides a detailed analysis of the Pet Obesity Management industry, encompassing market size, segmentation, competitive landscape, key trends, and future outlook. With a study period spanning 2019-2033, a base year of 2025, and a forecast period of 2025-2033, this report offers invaluable insights for industry stakeholders, investors, and strategic decision-makers. The global market is estimated to reach xx Million by 2025 and is projected to grow at a CAGR of xx% during the forecast period.
Pet Obesity Management Industry Market Structure & Competitive Landscape
The Pet Obesity Management market is characterized by a moderately concentrated structure, with several large players and a multitude of smaller niche businesses. Concentration ratios, while varying by segment, indicate a moderate level of competition. For example, the top 5 players in the drug segment may account for approximately xx% of the market share in 2025, suggesting room for both consolidation and new entrants. Innovation plays a significant role, driven by the development of new drugs, food supplements, and technological solutions for pet weight management. Regulatory approvals, especially for new drugs, represent a crucial hurdle, influencing market entry and product lifecycle management. Substitutes, such as lifestyle changes and alternative therapies, exert a degree of pressure, although the efficacy and convenience of specialized products contribute to their market dominance.
Market segmentation is notable, with variations across animal type (dogs, cats, other animals), end-user (pet specialty stores, e-commerce, other end-users), and product type (drugs, food supplements). Mergers and acquisitions (M&A) activity has been relatively consistent in recent years, with approximately xx M&A deals recorded between 2019 and 2024, primarily involving smaller companies being acquired by larger players to expand product portfolios or geographic reach. This trend is expected to continue, driven by the desire for market expansion and diversification.
- Market Concentration: Moderate, with xx% market share held by top 5 players in the drug segment (2025 estimate).
- Innovation Drivers: New drug formulations, advanced food supplement technology, and digital health solutions.
- Regulatory Impact: Stringent approval processes for new drugs, influencing market entry and product lifecycles.
- Product Substitutes: Lifestyle changes, alternative therapies, posing moderate competitive pressure.
- End-User Segmentation: Significant differences in demand and preferences across pet specialty stores, e-commerce, and other end-users.
- M&A Trends: Consistent M&A activity, with approximately xx deals (2019-2024), reflecting consolidation and expansion strategies.
Pet Obesity Management Industry Market Trends & Opportunities
The Pet Obesity Management market is experiencing robust growth, driven by increasing pet ownership, rising pet healthcare expenditure, and growing awareness of pet obesity's health consequences. The market size is projected to reach xx Million by 2025, reflecting a significant expansion in recent years. Technological advancements in areas like pet health monitoring devices and personalized nutrition solutions are reshaping the industry. Consumers are increasingly demanding specialized and convenient products, leading to innovation in food supplements and drug delivery systems. E-commerce channels are gaining traction, offering broader reach and convenient access to pet obesity management products. Competitive dynamics are characterized by both established players leveraging brand recognition and new entrants offering innovative solutions. This leads to considerable price competition and drives innovation to maintain market share. The overall market shows positive growth trajectory, with a predicted CAGR of xx% from 2025 to 2033. Market penetration rates are expected to increase steadily due to expanding awareness campaigns and product diversification.
Dominant Markets & Segments in Pet Obesity Management Industry
The global Pet Obesity Management market is dominated by the dog segment within the animal type category, contributing xx% to the overall market revenue in 2025. The North American region holds significant market share, driven by higher pet ownership rates, greater disposable income, and increased awareness of pet health. Within the end-user segment, pet specialty stores maintain a strong position due to their expertise and personalized service offerings. However, e-commerce is experiencing rapid growth, with projections to reach xx Million by 2033, fueled by increased online shopping trends and convenience. The food supplements segment holds the largest market share by product type, benefiting from the wide availability and affordability of such products.
- Key Growth Drivers (Dog Segment): Higher pet ownership rates, increased pet healthcare spending, and growing consumer awareness of the link between obesity and canine health issues.
- Key Growth Drivers (North American Region): High pet ownership rates, disposable income, and extensive marketing and awareness campaigns on pet health.
- Key Growth Drivers (Pet Specialty Stores): Expertise and personalized customer service, fostering trust and loyalty among pet owners.
- Key Growth Drivers (E-commerce): Convenience, broader product availability, and competitive pricing.
- Key Growth Drivers (Food Supplements): Affordability, accessibility, and perceived ease of integration into pet diets.
Pet Obesity Management Industry Product Analysis
The Pet Obesity Management industry offers a diverse range of products, including prescription and over-the-counter drugs targeting specific metabolic pathways, and food supplements formulated to manage weight and improve overall health. Technological advancements in areas like targeted nutrient delivery, advanced flavoring systems, and personalized nutrition plans are driving product innovation. The competitive advantage often lies in the efficacy and safety of products, supported by scientific research and endorsements from veterinary professionals. Products tailored to specific breeds and life stages are gaining popularity, reflecting the increasing demand for personalized solutions.
Key Drivers, Barriers & Challenges in Pet Obesity Management Industry
Key Drivers: Rising pet ownership, increasing pet healthcare expenditure, growing awareness of pet obesity, and technological advancements in pet health monitoring and personalized nutrition solutions. Government initiatives and awareness campaigns focused on responsible pet ownership also contribute to market growth.
Challenges: Regulatory hurdles for new drug approvals, potential supply chain disruptions impacting ingredient sourcing and manufacturing, and intense competition from both established players and emerging companies. The effectiveness of existing treatments also remains an ongoing challenge and requires further research and development. These factors significantly affect product availability and pricing, influencing market dynamics.
Growth Drivers in the Pet Obesity Management Industry Market
The Pet Obesity Management industry is propelled by several key factors: rising pet ownership globally, increased disposable income in many regions, increasing pet health awareness, and technological advancements allowing for tailored pet care and weight management products. Regulatory changes promoting pet health and stricter guidelines on pet food manufacturing also contribute to market growth.
Challenges Impacting Pet Obesity Management Industry Growth
Significant challenges impede the Pet Obesity Management industry's growth: stringent regulations for drug approvals increase costs and time to market; supply chain vulnerabilities, particularly concerning raw materials, can cause production delays and shortages; and intense competition from many players leads to price pressure and makes maintaining market share difficult.
Key Players Shaping the Pet Obesity Management Industry Market
- Park Vet Group
- Auxthera LLC
- Weight Watchers
- Pedigree
- Pfizer Animal Health
- Vivaldis
- KONG Company
- Hills Pet Nutrition Inc
- Royal Canin
Significant Pet Obesity Management Industry Milestones
- May 2022: Park Vet Group launched the Veterinary Nursing Awareness campaign, highlighting the importance of veterinary nursing in pet nutrition balance.
- January 2022: Alton Brown partnered with Hill's Pet Nutrition to combat pet obesity, providing pet owners with free educational resources.
Future Outlook for Pet Obesity Management Industry Market
The Pet Obesity Management market is poised for continued growth, driven by several key factors. Technological advancements will lead to more effective and personalized solutions, while increasing consumer awareness of pet health and the rising prevalence of pet obesity will drive demand for specialized products. Strategic partnerships between veterinary professionals and industry players will further enhance market penetration and adoption rates. The market is expected to experience significant expansion during the forecast period, offering substantial opportunities for innovation and growth.
Pet Obesity Management Industry Segmentation
-
1. Products
- 1.1. Drugs
- 1.2. Food Supplements
-
2. Animal Type
- 2.1. Dogs
- 2.2. Cats
- 2.3. Other Animals
-
3. End User
- 3.1. Pet Specialty Stores
- 3.2. E-commerce
- 3.3. Other End Users
Pet Obesity Management Industry Segmentation By Geography
-
1. North America
- 1.1. United States
- 1.2. Canada
- 1.3. Mexico
-
2. Europe
- 2.1. Germany
- 2.2. United Kingdom
- 2.3. France
- 2.4. Italy
- 2.5. Spain
- 2.6. Rest of Europe
-
3. Asia Pacific
- 3.1. China
- 3.2. Japan
- 3.3. India
- 3.4. Australia
- 3.5. South Korea
- 3.6. Rest of Asia Pacific
-
4. Middle East and Africa
- 4.1. GCC
- 4.2. South Africa
- 4.3. Rest of Middle East and Africa
-
5. South America
- 5.1. Brazil
- 5.2. Argentina
- 5.3. Rest of South America
Pet Obesity Management Industry Regional Market Share
Geographic Coverage of Pet Obesity Management Industry
Pet Obesity Management Industry REPORT HIGHLIGHTS
| Aspects | Details |
|---|---|
| Study Period | 2020-2034 |
| Base Year | 2025 |
| Estimated Year | 2026 |
| Forecast Period | 2026-2034 |
| Historical Period | 2020-2025 |
| Growth Rate | CAGR of 13.83% from 2020-2034 |
| Segmentation |
|
Table of Contents
- 1. Introduction
- 1.1. Research Scope
- 1.2. Market Segmentation
- 1.3. Research Objective
- 1.4. Definitions and Assumptions
- 2. Executive Summary
- 2.1. Market Snapshot
- 3. Market Dynamics
- 3.1. Market Drivers
- 3.2. Market Restrains
- 3.3. Market Trends
- 3.4. Market Opportunities
- 4. Market Factor Analysis
- 4.1. Porters Five Forces
- 4.1.1. Bargaining Power of Suppliers
- 4.1.2. Bargaining Power of Buyers
- 4.1.3. Threat of New Entrants
- 4.1.4. Threat of Substitutes
- 4.1.5. Competitive Rivalry
- 4.2. PESTEL analysis
- 4.3. BCG Analysis
- 4.3.1. Stars (High Growth, High Market Share)
- 4.3.2. Cash Cows (Low Growth, High Market Share)
- 4.3.3. Question Mark (High Growth, Low Market Share)
- 4.3.4. Dogs (Low Growth, Low Market Share)
- 4.4. Ansoff Matrix Analysis
- 4.5. Supply Chain Analysis
- 4.6. Regulatory Landscape
- 4.7. Current Market Potential and Opportunity Assessment (TAM–SAM–SOM Framework)
- 4.8. TIR Analyst Note
- 4.1. Porters Five Forces
- 5. Market Analysis, Insights and Forecast 2021-2033
- 5.1. Market Analysis, Insights and Forecast - by Products
- 5.1.1. Drugs
- 5.1.2. Food Supplements
- 5.2. Market Analysis, Insights and Forecast - by Animal Type
- 5.2.1. Dogs
- 5.2.2. Cats
- 5.2.3. Other Animals
- 5.3. Market Analysis, Insights and Forecast - by End User
- 5.3.1. Pet Specialty Stores
- 5.3.2. E-commerce
- 5.3.3. Other End Users
- 5.4. Market Analysis, Insights and Forecast - by Region
- 5.4.1. North America
- 5.4.2. Europe
- 5.4.3. Asia Pacific
- 5.4.4. Middle East and Africa
- 5.4.5. South America
- 5.1. Market Analysis, Insights and Forecast - by Products
- 6. Global Pet Obesity Management Industry Analysis, Insights and Forecast, 2021-2033
- 6.1. Market Analysis, Insights and Forecast - by Products
- 6.1.1. Drugs
- 6.1.2. Food Supplements
- 6.2. Market Analysis, Insights and Forecast - by Animal Type
- 6.2.1. Dogs
- 6.2.2. Cats
- 6.2.3. Other Animals
- 6.3. Market Analysis, Insights and Forecast - by End User
- 6.3.1. Pet Specialty Stores
- 6.3.2. E-commerce
- 6.3.3. Other End Users
- 6.1. Market Analysis, Insights and Forecast - by Products
- 7. North America Pet Obesity Management Industry Analysis, Insights and Forecast, 2020-2032
- 7.1. Market Analysis, Insights and Forecast - by Products
- 7.1.1. Drugs
- 7.1.2. Food Supplements
- 7.2. Market Analysis, Insights and Forecast - by Animal Type
- 7.2.1. Dogs
- 7.2.2. Cats
- 7.2.3. Other Animals
- 7.3. Market Analysis, Insights and Forecast - by End User
- 7.3.1. Pet Specialty Stores
- 7.3.2. E-commerce
- 7.3.3. Other End Users
- 7.1. Market Analysis, Insights and Forecast - by Products
- 8. Europe Pet Obesity Management Industry Analysis, Insights and Forecast, 2020-2032
- 8.1. Market Analysis, Insights and Forecast - by Products
- 8.1.1. Drugs
- 8.1.2. Food Supplements
- 8.2. Market Analysis, Insights and Forecast - by Animal Type
- 8.2.1. Dogs
- 8.2.2. Cats
- 8.2.3. Other Animals
- 8.3. Market Analysis, Insights and Forecast - by End User
- 8.3.1. Pet Specialty Stores
- 8.3.2. E-commerce
- 8.3.3. Other End Users
- 8.1. Market Analysis, Insights and Forecast - by Products
- 9. Asia Pacific Pet Obesity Management Industry Analysis, Insights and Forecast, 2020-2032
- 9.1. Market Analysis, Insights and Forecast - by Products
- 9.1.1. Drugs
- 9.1.2. Food Supplements
- 9.2. Market Analysis, Insights and Forecast - by Animal Type
- 9.2.1. Dogs
- 9.2.2. Cats
- 9.2.3. Other Animals
- 9.3. Market Analysis, Insights and Forecast - by End User
- 9.3.1. Pet Specialty Stores
- 9.3.2. E-commerce
- 9.3.3. Other End Users
- 9.1. Market Analysis, Insights and Forecast - by Products
- 10. Middle East and Africa Pet Obesity Management Industry Analysis, Insights and Forecast, 2020-2032
- 10.1. Market Analysis, Insights and Forecast - by Products
- 10.1.1. Drugs
- 10.1.2. Food Supplements
- 10.2. Market Analysis, Insights and Forecast - by Animal Type
- 10.2.1. Dogs
- 10.2.2. Cats
- 10.2.3. Other Animals
- 10.3. Market Analysis, Insights and Forecast - by End User
- 10.3.1. Pet Specialty Stores
- 10.3.2. E-commerce
- 10.3.3. Other End Users
- 10.1. Market Analysis, Insights and Forecast - by Products
- 11. South America Pet Obesity Management Industry Analysis, Insights and Forecast, 2020-2032
- 11.1. Market Analysis, Insights and Forecast - by Products
- 11.1.1. Drugs
- 11.1.2. Food Supplements
- 11.2. Market Analysis, Insights and Forecast - by Animal Type
- 11.2.1. Dogs
- 11.2.2. Cats
- 11.2.3. Other Animals
- 11.3. Market Analysis, Insights and Forecast - by End User
- 11.3.1. Pet Specialty Stores
- 11.3.2. E-commerce
- 11.3.3. Other End Users
- 11.1. Market Analysis, Insights and Forecast - by Products
- 12. Competitive Analysis
- 12.1. Company Profiles
- 12.1.1 Park Vet Group
- 12.1.1.1. Company Overview
- 12.1.1.2. Products
- 12.1.1.3. Company Financials
- 12.1.1.4. SWOT Analysis
- 12.1.2 Auxthera LLC
- 12.1.2.1. Company Overview
- 12.1.2.2. Products
- 12.1.2.3. Company Financials
- 12.1.2.4. SWOT Analysis
- 12.1.3 Weight Watchers
- 12.1.3.1. Company Overview
- 12.1.3.2. Products
- 12.1.3.3. Company Financials
- 12.1.3.4. SWOT Analysis
- 12.1.4 Pedigree
- 12.1.4.1. Company Overview
- 12.1.4.2. Products
- 12.1.4.3. Company Financials
- 12.1.4.4. SWOT Analysis
- 12.1.5 Pfizer Animal Health
- 12.1.5.1. Company Overview
- 12.1.5.2. Products
- 12.1.5.3. Company Financials
- 12.1.5.4. SWOT Analysis
- 12.1.6 Vivaldis
- 12.1.6.1. Company Overview
- 12.1.6.2. Products
- 12.1.6.3. Company Financials
- 12.1.6.4. SWOT Analysis
- 12.1.7 KONG Company
- 12.1.7.1. Company Overview
- 12.1.7.2. Products
- 12.1.7.3. Company Financials
- 12.1.7.4. SWOT Analysis
- 12.1.8 Hills Pet Nutrition Inc
- 12.1.8.1. Company Overview
- 12.1.8.2. Products
- 12.1.8.3. Company Financials
- 12.1.8.4. SWOT Analysis
- 12.1.9 Royal Canin
- 12.1.9.1. Company Overview
- 12.1.9.2. Products
- 12.1.9.3. Company Financials
- 12.1.9.4. SWOT Analysis
- 12.1.1 Park Vet Group
- 12.2. Market Entropy
- 12.2.1 Company's Key Areas Served
- 12.2.2 Recent Developments
- 12.3. Company Market Share Analysis 2025
- 12.3.1 Top 5 Companies Market Share Analysis
- 12.3.2 Top 3 Companies Market Share Analysis
- 12.4. List of Potential Customers
- 13. Research Methodology
List of Figures
- Figure 1: Global Pet Obesity Management Industry Revenue Breakdown (billion, %) by Region 2025 & 2033
- Figure 2: Global Pet Obesity Management Industry Volume Breakdown (K Unit, %) by Region 2025 & 2033
- Figure 3: North America Pet Obesity Management Industry Revenue (billion), by Products 2025 & 2033
- Figure 4: North America Pet Obesity Management Industry Volume (K Unit), by Products 2025 & 2033
- Figure 5: North America Pet Obesity Management Industry Revenue Share (%), by Products 2025 & 2033
- Figure 6: North America Pet Obesity Management Industry Volume Share (%), by Products 2025 & 2033
- Figure 7: North America Pet Obesity Management Industry Revenue (billion), by Animal Type 2025 & 2033
- Figure 8: North America Pet Obesity Management Industry Volume (K Unit), by Animal Type 2025 & 2033
- Figure 9: North America Pet Obesity Management Industry Revenue Share (%), by Animal Type 2025 & 2033
- Figure 10: North America Pet Obesity Management Industry Volume Share (%), by Animal Type 2025 & 2033
- Figure 11: North America Pet Obesity Management Industry Revenue (billion), by End User 2025 & 2033
- Figure 12: North America Pet Obesity Management Industry Volume (K Unit), by End User 2025 & 2033
- Figure 13: North America Pet Obesity Management Industry Revenue Share (%), by End User 2025 & 2033
- Figure 14: North America Pet Obesity Management Industry Volume Share (%), by End User 2025 & 2033
- Figure 15: North America Pet Obesity Management Industry Revenue (billion), by Country 2025 & 2033
- Figure 16: North America Pet Obesity Management Industry Volume (K Unit), by Country 2025 & 2033
- Figure 17: North America Pet Obesity Management Industry Revenue Share (%), by Country 2025 & 2033
- Figure 18: North America Pet Obesity Management Industry Volume Share (%), by Country 2025 & 2033
- Figure 19: Europe Pet Obesity Management Industry Revenue (billion), by Products 2025 & 2033
- Figure 20: Europe Pet Obesity Management Industry Volume (K Unit), by Products 2025 & 2033
- Figure 21: Europe Pet Obesity Management Industry Revenue Share (%), by Products 2025 & 2033
- Figure 22: Europe Pet Obesity Management Industry Volume Share (%), by Products 2025 & 2033
- Figure 23: Europe Pet Obesity Management Industry Revenue (billion), by Animal Type 2025 & 2033
- Figure 24: Europe Pet Obesity Management Industry Volume (K Unit), by Animal Type 2025 & 2033
- Figure 25: Europe Pet Obesity Management Industry Revenue Share (%), by Animal Type 2025 & 2033
- Figure 26: Europe Pet Obesity Management Industry Volume Share (%), by Animal Type 2025 & 2033
- Figure 27: Europe Pet Obesity Management Industry Revenue (billion), by End User 2025 & 2033
- Figure 28: Europe Pet Obesity Management Industry Volume (K Unit), by End User 2025 & 2033
- Figure 29: Europe Pet Obesity Management Industry Revenue Share (%), by End User 2025 & 2033
- Figure 30: Europe Pet Obesity Management Industry Volume Share (%), by End User 2025 & 2033
- Figure 31: Europe Pet Obesity Management Industry Revenue (billion), by Country 2025 & 2033
- Figure 32: Europe Pet Obesity Management Industry Volume (K Unit), by Country 2025 & 2033
- Figure 33: Europe Pet Obesity Management Industry Revenue Share (%), by Country 2025 & 2033
- Figure 34: Europe Pet Obesity Management Industry Volume Share (%), by Country 2025 & 2033
- Figure 35: Asia Pacific Pet Obesity Management Industry Revenue (billion), by Products 2025 & 2033
- Figure 36: Asia Pacific Pet Obesity Management Industry Volume (K Unit), by Products 2025 & 2033
- Figure 37: Asia Pacific Pet Obesity Management Industry Revenue Share (%), by Products 2025 & 2033
- Figure 38: Asia Pacific Pet Obesity Management Industry Volume Share (%), by Products 2025 & 2033
- Figure 39: Asia Pacific Pet Obesity Management Industry Revenue (billion), by Animal Type 2025 & 2033
- Figure 40: Asia Pacific Pet Obesity Management Industry Volume (K Unit), by Animal Type 2025 & 2033
- Figure 41: Asia Pacific Pet Obesity Management Industry Revenue Share (%), by Animal Type 2025 & 2033
- Figure 42: Asia Pacific Pet Obesity Management Industry Volume Share (%), by Animal Type 2025 & 2033
- Figure 43: Asia Pacific Pet Obesity Management Industry Revenue (billion), by End User 2025 & 2033
- Figure 44: Asia Pacific Pet Obesity Management Industry Volume (K Unit), by End User 2025 & 2033
- Figure 45: Asia Pacific Pet Obesity Management Industry Revenue Share (%), by End User 2025 & 2033
- Figure 46: Asia Pacific Pet Obesity Management Industry Volume Share (%), by End User 2025 & 2033
- Figure 47: Asia Pacific Pet Obesity Management Industry Revenue (billion), by Country 2025 & 2033
- Figure 48: Asia Pacific Pet Obesity Management Industry Volume (K Unit), by Country 2025 & 2033
- Figure 49: Asia Pacific Pet Obesity Management Industry Revenue Share (%), by Country 2025 & 2033
- Figure 50: Asia Pacific Pet Obesity Management Industry Volume Share (%), by Country 2025 & 2033
- Figure 51: Middle East and Africa Pet Obesity Management Industry Revenue (billion), by Products 2025 & 2033
- Figure 52: Middle East and Africa Pet Obesity Management Industry Volume (K Unit), by Products 2025 & 2033
- Figure 53: Middle East and Africa Pet Obesity Management Industry Revenue Share (%), by Products 2025 & 2033
- Figure 54: Middle East and Africa Pet Obesity Management Industry Volume Share (%), by Products 2025 & 2033
- Figure 55: Middle East and Africa Pet Obesity Management Industry Revenue (billion), by Animal Type 2025 & 2033
- Figure 56: Middle East and Africa Pet Obesity Management Industry Volume (K Unit), by Animal Type 2025 & 2033
- Figure 57: Middle East and Africa Pet Obesity Management Industry Revenue Share (%), by Animal Type 2025 & 2033
- Figure 58: Middle East and Africa Pet Obesity Management Industry Volume Share (%), by Animal Type 2025 & 2033
- Figure 59: Middle East and Africa Pet Obesity Management Industry Revenue (billion), by End User 2025 & 2033
- Figure 60: Middle East and Africa Pet Obesity Management Industry Volume (K Unit), by End User 2025 & 2033
- Figure 61: Middle East and Africa Pet Obesity Management Industry Revenue Share (%), by End User 2025 & 2033
- Figure 62: Middle East and Africa Pet Obesity Management Industry Volume Share (%), by End User 2025 & 2033
- Figure 63: Middle East and Africa Pet Obesity Management Industry Revenue (billion), by Country 2025 & 2033
- Figure 64: Middle East and Africa Pet Obesity Management Industry Volume (K Unit), by Country 2025 & 2033
- Figure 65: Middle East and Africa Pet Obesity Management Industry Revenue Share (%), by Country 2025 & 2033
- Figure 66: Middle East and Africa Pet Obesity Management Industry Volume Share (%), by Country 2025 & 2033
- Figure 67: South America Pet Obesity Management Industry Revenue (billion), by Products 2025 & 2033
- Figure 68: South America Pet Obesity Management Industry Volume (K Unit), by Products 2025 & 2033
- Figure 69: South America Pet Obesity Management Industry Revenue Share (%), by Products 2025 & 2033
- Figure 70: South America Pet Obesity Management Industry Volume Share (%), by Products 2025 & 2033
- Figure 71: South America Pet Obesity Management Industry Revenue (billion), by Animal Type 2025 & 2033
- Figure 72: South America Pet Obesity Management Industry Volume (K Unit), by Animal Type 2025 & 2033
- Figure 73: South America Pet Obesity Management Industry Revenue Share (%), by Animal Type 2025 & 2033
- Figure 74: South America Pet Obesity Management Industry Volume Share (%), by Animal Type 2025 & 2033
- Figure 75: South America Pet Obesity Management Industry Revenue (billion), by End User 2025 & 2033
- Figure 76: South America Pet Obesity Management Industry Volume (K Unit), by End User 2025 & 2033
- Figure 77: South America Pet Obesity Management Industry Revenue Share (%), by End User 2025 & 2033
- Figure 78: South America Pet Obesity Management Industry Volume Share (%), by End User 2025 & 2033
- Figure 79: South America Pet Obesity Management Industry Revenue (billion), by Country 2025 & 2033
- Figure 80: South America Pet Obesity Management Industry Volume (K Unit), by Country 2025 & 2033
- Figure 81: South America Pet Obesity Management Industry Revenue Share (%), by Country 2025 & 2033
- Figure 82: South America Pet Obesity Management Industry Volume Share (%), by Country 2025 & 2033
List of Tables
- Table 1: Global Pet Obesity Management Industry Revenue billion Forecast, by Products 2020 & 2033
- Table 2: Global Pet Obesity Management Industry Volume K Unit Forecast, by Products 2020 & 2033
- Table 3: Global Pet Obesity Management Industry Revenue billion Forecast, by Animal Type 2020 & 2033
- Table 4: Global Pet Obesity Management Industry Volume K Unit Forecast, by Animal Type 2020 & 2033
- Table 5: Global Pet Obesity Management Industry Revenue billion Forecast, by End User 2020 & 2033
- Table 6: Global Pet Obesity Management Industry Volume K Unit Forecast, by End User 2020 & 2033
- Table 7: Global Pet Obesity Management Industry Revenue billion Forecast, by Region 2020 & 2033
- Table 8: Global Pet Obesity Management Industry Volume K Unit Forecast, by Region 2020 & 2033
- Table 9: Global Pet Obesity Management Industry Revenue billion Forecast, by Products 2020 & 2033
- Table 10: Global Pet Obesity Management Industry Volume K Unit Forecast, by Products 2020 & 2033
- Table 11: Global Pet Obesity Management Industry Revenue billion Forecast, by Animal Type 2020 & 2033
- Table 12: Global Pet Obesity Management Industry Volume K Unit Forecast, by Animal Type 2020 & 2033
- Table 13: Global Pet Obesity Management Industry Revenue billion Forecast, by End User 2020 & 2033
- Table 14: Global Pet Obesity Management Industry Volume K Unit Forecast, by End User 2020 & 2033
- Table 15: Global Pet Obesity Management Industry Revenue billion Forecast, by Country 2020 & 2033
- Table 16: Global Pet Obesity Management Industry Volume K Unit Forecast, by Country 2020 & 2033
- Table 17: United States Pet Obesity Management Industry Revenue (billion) Forecast, by Application 2020 & 2033
- Table 18: United States Pet Obesity Management Industry Volume (K Unit) Forecast, by Application 2020 & 2033
- Table 19: Canada Pet Obesity Management Industry Revenue (billion) Forecast, by Application 2020 & 2033
- Table 20: Canada Pet Obesity Management Industry Volume (K Unit) Forecast, by Application 2020 & 2033
- Table 21: Mexico Pet Obesity Management Industry Revenue (billion) Forecast, by Application 2020 & 2033
- Table 22: Mexico Pet Obesity Management Industry Volume (K Unit) Forecast, by Application 2020 & 2033
- Table 23: Global Pet Obesity Management Industry Revenue billion Forecast, by Products 2020 & 2033
- Table 24: Global Pet Obesity Management Industry Volume K Unit Forecast, by Products 2020 & 2033
- Table 25: Global Pet Obesity Management Industry Revenue billion Forecast, by Animal Type 2020 & 2033
- Table 26: Global Pet Obesity Management Industry Volume K Unit Forecast, by Animal Type 2020 & 2033
- Table 27: Global Pet Obesity Management Industry Revenue billion Forecast, by End User 2020 & 2033
- Table 28: Global Pet Obesity Management Industry Volume K Unit Forecast, by End User 2020 & 2033
- Table 29: Global Pet Obesity Management Industry Revenue billion Forecast, by Country 2020 & 2033
- Table 30: Global Pet Obesity Management Industry Volume K Unit Forecast, by Country 2020 & 2033
- Table 31: Germany Pet Obesity Management Industry Revenue (billion) Forecast, by Application 2020 & 2033
- Table 32: Germany Pet Obesity Management Industry Volume (K Unit) Forecast, by Application 2020 & 2033
- Table 33: United Kingdom Pet Obesity Management Industry Revenue (billion) Forecast, by Application 2020 & 2033
- Table 34: United Kingdom Pet Obesity Management Industry Volume (K Unit) Forecast, by Application 2020 & 2033
- Table 35: France Pet Obesity Management Industry Revenue (billion) Forecast, by Application 2020 & 2033
- Table 36: France Pet Obesity Management Industry Volume (K Unit) Forecast, by Application 2020 & 2033
- Table 37: Italy Pet Obesity Management Industry Revenue (billion) Forecast, by Application 2020 & 2033
- Table 38: Italy Pet Obesity Management Industry Volume (K Unit) Forecast, by Application 2020 & 2033
- Table 39: Spain Pet Obesity Management Industry Revenue (billion) Forecast, by Application 2020 & 2033
- Table 40: Spain Pet Obesity Management Industry Volume (K Unit) Forecast, by Application 2020 & 2033
- Table 41: Rest of Europe Pet Obesity Management Industry Revenue (billion) Forecast, by Application 2020 & 2033
- Table 42: Rest of Europe Pet Obesity Management Industry Volume (K Unit) Forecast, by Application 2020 & 2033
- Table 43: Global Pet Obesity Management Industry Revenue billion Forecast, by Products 2020 & 2033
- Table 44: Global Pet Obesity Management Industry Volume K Unit Forecast, by Products 2020 & 2033
- Table 45: Global Pet Obesity Management Industry Revenue billion Forecast, by Animal Type 2020 & 2033
- Table 46: Global Pet Obesity Management Industry Volume K Unit Forecast, by Animal Type 2020 & 2033
- Table 47: Global Pet Obesity Management Industry Revenue billion Forecast, by End User 2020 & 2033
- Table 48: Global Pet Obesity Management Industry Volume K Unit Forecast, by End User 2020 & 2033
- Table 49: Global Pet Obesity Management Industry Revenue billion Forecast, by Country 2020 & 2033
- Table 50: Global Pet Obesity Management Industry Volume K Unit Forecast, by Country 2020 & 2033
- Table 51: China Pet Obesity Management Industry Revenue (billion) Forecast, by Application 2020 & 2033
- Table 52: China Pet Obesity Management Industry Volume (K Unit) Forecast, by Application 2020 & 2033
- Table 53: Japan Pet Obesity Management Industry Revenue (billion) Forecast, by Application 2020 & 2033
- Table 54: Japan Pet Obesity Management Industry Volume (K Unit) Forecast, by Application 2020 & 2033
- Table 55: India Pet Obesity Management Industry Revenue (billion) Forecast, by Application 2020 & 2033
- Table 56: India Pet Obesity Management Industry Volume (K Unit) Forecast, by Application 2020 & 2033
- Table 57: Australia Pet Obesity Management Industry Revenue (billion) Forecast, by Application 2020 & 2033
- Table 58: Australia Pet Obesity Management Industry Volume (K Unit) Forecast, by Application 2020 & 2033
- Table 59: South Korea Pet Obesity Management Industry Revenue (billion) Forecast, by Application 2020 & 2033
- Table 60: South Korea Pet Obesity Management Industry Volume (K Unit) Forecast, by Application 2020 & 2033
- Table 61: Rest of Asia Pacific Pet Obesity Management Industry Revenue (billion) Forecast, by Application 2020 & 2033
- Table 62: Rest of Asia Pacific Pet Obesity Management Industry Volume (K Unit) Forecast, by Application 2020 & 2033
- Table 63: Global Pet Obesity Management Industry Revenue billion Forecast, by Products 2020 & 2033
- Table 64: Global Pet Obesity Management Industry Volume K Unit Forecast, by Products 2020 & 2033
- Table 65: Global Pet Obesity Management Industry Revenue billion Forecast, by Animal Type 2020 & 2033
- Table 66: Global Pet Obesity Management Industry Volume K Unit Forecast, by Animal Type 2020 & 2033
- Table 67: Global Pet Obesity Management Industry Revenue billion Forecast, by End User 2020 & 2033
- Table 68: Global Pet Obesity Management Industry Volume K Unit Forecast, by End User 2020 & 2033
- Table 69: Global Pet Obesity Management Industry Revenue billion Forecast, by Country 2020 & 2033
- Table 70: Global Pet Obesity Management Industry Volume K Unit Forecast, by Country 2020 & 2033
- Table 71: GCC Pet Obesity Management Industry Revenue (billion) Forecast, by Application 2020 & 2033
- Table 72: GCC Pet Obesity Management Industry Volume (K Unit) Forecast, by Application 2020 & 2033
- Table 73: South Africa Pet Obesity Management Industry Revenue (billion) Forecast, by Application 2020 & 2033
- Table 74: South Africa Pet Obesity Management Industry Volume (K Unit) Forecast, by Application 2020 & 2033
- Table 75: Rest of Middle East and Africa Pet Obesity Management Industry Revenue (billion) Forecast, by Application 2020 & 2033
- Table 76: Rest of Middle East and Africa Pet Obesity Management Industry Volume (K Unit) Forecast, by Application 2020 & 2033
- Table 77: Global Pet Obesity Management Industry Revenue billion Forecast, by Products 2020 & 2033
- Table 78: Global Pet Obesity Management Industry Volume K Unit Forecast, by Products 2020 & 2033
- Table 79: Global Pet Obesity Management Industry Revenue billion Forecast, by Animal Type 2020 & 2033
- Table 80: Global Pet Obesity Management Industry Volume K Unit Forecast, by Animal Type 2020 & 2033
- Table 81: Global Pet Obesity Management Industry Revenue billion Forecast, by End User 2020 & 2033
- Table 82: Global Pet Obesity Management Industry Volume K Unit Forecast, by End User 2020 & 2033
- Table 83: Global Pet Obesity Management Industry Revenue billion Forecast, by Country 2020 & 2033
- Table 84: Global Pet Obesity Management Industry Volume K Unit Forecast, by Country 2020 & 2033
- Table 85: Brazil Pet Obesity Management Industry Revenue (billion) Forecast, by Application 2020 & 2033
- Table 86: Brazil Pet Obesity Management Industry Volume (K Unit) Forecast, by Application 2020 & 2033
- Table 87: Argentina Pet Obesity Management Industry Revenue (billion) Forecast, by Application 2020 & 2033
- Table 88: Argentina Pet Obesity Management Industry Volume (K Unit) Forecast, by Application 2020 & 2033
- Table 89: Rest of South America Pet Obesity Management Industry Revenue (billion) Forecast, by Application 2020 & 2033
- Table 90: Rest of South America Pet Obesity Management Industry Volume (K Unit) Forecast, by Application 2020 & 2033
Frequently Asked Questions
1. What is the projected Compound Annual Growth Rate (CAGR) of the Pet Obesity Management Industry?
The projected CAGR is approximately 13.83%.
2. Which companies are prominent players in the Pet Obesity Management Industry?
Key companies in the market include Park Vet Group, Auxthera LLC, Weight Watchers, Pedigree, Pfizer Animal Health, Vivaldis, KONG Company, Hills Pet Nutrition Inc, Royal Canin.
3. What are the main segments of the Pet Obesity Management Industry?
The market segments include Products, Animal Type, End User.
4. Can you provide details about the market size?
The market size is estimated to be USD 9.67 billion as of 2022.
5. What are some drivers contributing to market growth?
Increasing Pet Ownership; Increasing Prevalence of Diabetes and Other Chronic Diseases Among Pets; Increasing Pet Insurance Policies and Coverage.
6. What are the notable trends driving market growth?
Dogs Segment is Expected to Hold a Major Share in the Pet Obesity Management Market.
7. Are there any restraints impacting market growth?
Lack of Awareness About Pet Obesity Management in Developing Economies.
8. Can you provide examples of recent developments in the market?
In May 2022, Park Vet Group launched the Veterinary Nursing Awareness campaign to raise awareness regarding the importance of veterinary nursing and pet nutrition balances.
9. What pricing options are available for accessing the report?
Pricing options include single-user, multi-user, and enterprise licenses priced at USD 4750, USD 5250, and USD 8750 respectively.
10. Is the market size provided in terms of value or volume?
The market size is provided in terms of value, measured in billion and volume, measured in K Unit.
11. Are there any specific market keywords associated with the report?
Yes, the market keyword associated with the report is "Pet Obesity Management Industry," which aids in identifying and referencing the specific market segment covered.
12. How do I determine which pricing option suits my needs best?
The pricing options vary based on user requirements and access needs. Individual users may opt for single-user licenses, while businesses requiring broader access may choose multi-user or enterprise licenses for cost-effective access to the report.
13. Are there any additional resources or data provided in the Pet Obesity Management Industry report?
While the report offers comprehensive insights, it's advisable to review the specific contents or supplementary materials provided to ascertain if additional resources or data are available.
14. How can I stay updated on further developments or reports in the Pet Obesity Management Industry?
To stay informed about further developments, trends, and reports in the Pet Obesity Management Industry, consider subscribing to industry newsletters, following relevant companies and organizations, or regularly checking reputable industry news sources and publications.
Methodology
Step 1 - Identification of Relevant Samples Size from Population Database


Step 2 - Approaches for Defining Global Market Size (Value, Volume* & Price*)

Note*: In applicable scenarios
Step 3 - Data Sources
Primary Research
- Web Analytics
- Survey Reports
- Research Institute
- Latest Research Reports
- Opinion Leaders
Secondary Research
- Annual Reports
- White Paper
- Latest Press Release
- Industry Association
- Paid Database
- Investor Presentations

Step 4 - Data Triangulation
Involves using different sources of information in order to increase the validity of a study
These sources are likely to be stakeholders in a program - participants, other researchers, program staff, other community members, and so on.
Then we put all data in single framework & apply various statistical tools to find out the dynamic on the market.
During the analysis stage, feedback from the stakeholder groups would be compared to determine areas of agreement as well as areas of divergence