

Key Insights
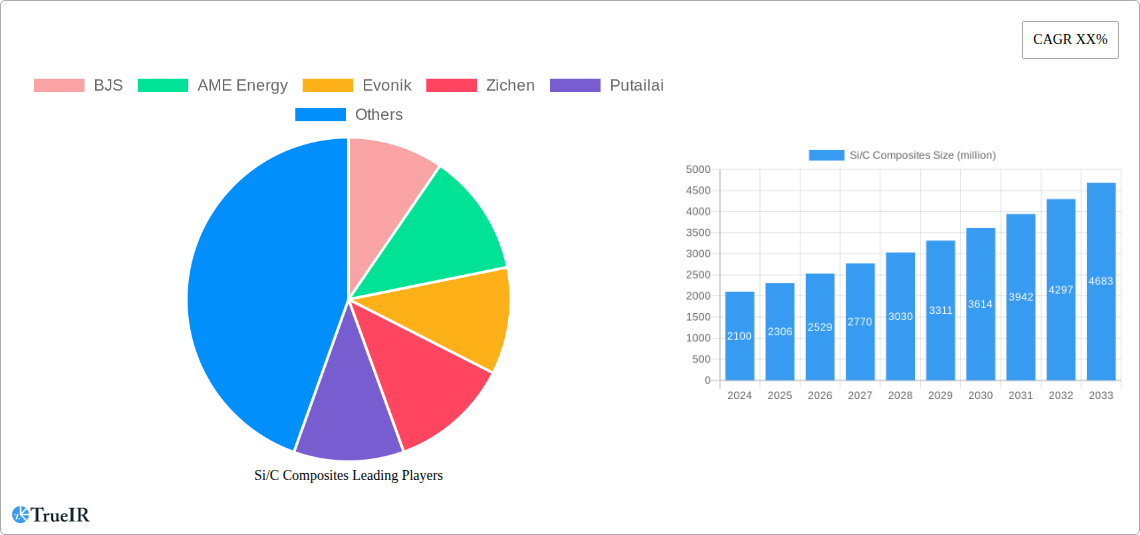
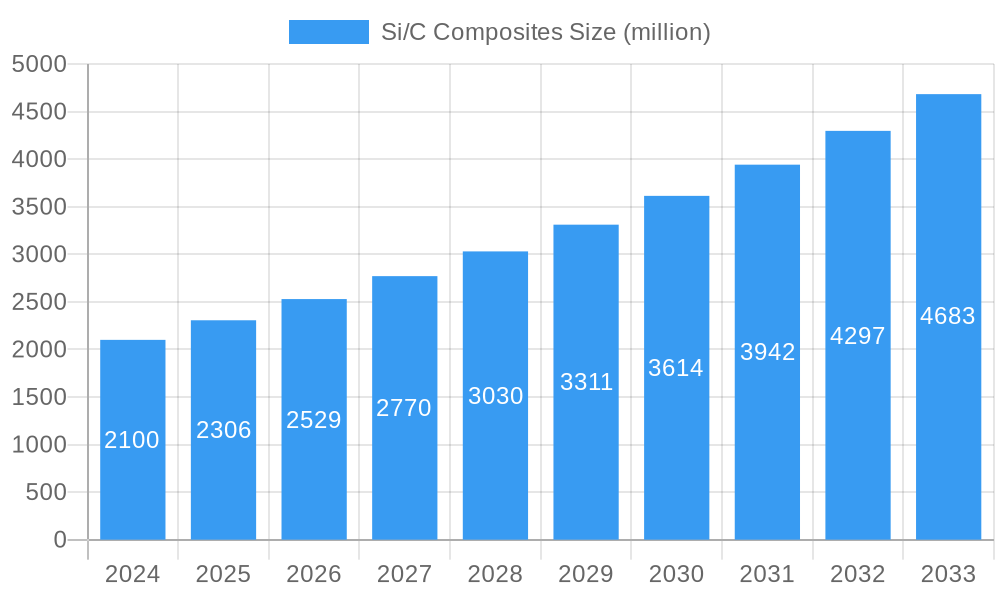
The Si/C composites market is poised for substantial growth, driven by the increasing demand for high-performance lithium-ion batteries in electric vehicles (EVs), consumer electronics, and energy storage systems. With a projected market size of approximately $2.1 billion in 2024, the market is expected to witness a robust Compound Annual Growth Rate (CAGR) of 9.8% during the forecast period of 2025-2033. Silicon's superior theoretical capacity compared to graphite makes Si/C composites a crucial anode material for achieving higher energy densities in next-generation batteries. This surge in demand is further fueled by advancements in battery technology that are addressing the inherent challenges of silicon, such as volume expansion during charging and discharging, through innovative composite designs. The market is segmenting significantly, with applications in cylindrical and square lithium-ion batteries demonstrating strong adoption.
Si/C Composites Market Size (In Billion)
The market's trajectory is also influenced by a dynamic interplay of drivers and restraints. Key drivers include the accelerating global adoption of EVs, stringent government regulations promoting clean energy, and continuous innovation in battery materials science aimed at enhancing performance and reducing costs. Emerging trends like the development of advanced Si/C formulations with improved cycling stability and faster charging capabilities are shaping the competitive landscape. However, challenges such as the high cost of silicon precursors and the complexity of manufacturing processes remain factors that could temper growth. Despite these restraints, the ongoing research and development efforts by leading companies like BTR New Energy Material, Putailai, and Shanshan Technology are actively working to overcome these hurdles, ensuring the continued expansion of the Si/C composites market into new applications and regions.
Si/C Composites Company Market Share
Si/C Composites Market: A Definitive Industry Analysis (2019-2033)
Unlock unparalleled insights into the rapidly evolving Si/C composites market, a critical component for next-generation lithium-ion battery technology. This comprehensive report delves deep into market dynamics, technological advancements, and future projections, empowering stakeholders to navigate this high-growth sector. With a study period spanning from 2019 to 2033, and a focus on the base year 2025, this analysis provides a robust understanding of historical trends, current scenarios, and future opportunities. Invest in this essential report to gain a competitive edge in the billion-dollar silicon-carbon composite battery industry.
Si/C Composites Market Structure & Competitive Landscape
The global Si/C composites market exhibits a moderate to high concentration, with key players investing heavily in research and development to achieve higher energy densities and improved cycle life for silicon anode materials. Innovation is primarily driven by the relentless pursuit of performance enhancements in electric vehicles (EVs) and portable electronics, pushing the boundaries of silicon carbide anode technology. Regulatory impacts, particularly those related to battery safety standards and environmental sustainability, are shaping product development and market entry strategies. Product substitutes, though emerging, are yet to match the compelling performance-to-cost ratio offered by advanced Si/C composites. End-user segmentation is increasingly dominated by the automotive sector, followed by consumer electronics and grid storage. Mergers and acquisitions (M&A) activity is projected to remain significant, with an estimated USD 5 billion in M&A volume anticipated between 2025 and 2033, as larger entities seek to consolidate market share and acquire cutting-edge technologies.
Si/C Composites Market Trends & Opportunities
The Si/C composites market is poised for explosive growth, driven by the insatiable demand for higher-performing lithium-ion battery anodes. Market size is projected to surge from an estimated USD 25 billion in 2025 to over USD 150 billion by 2033, representing a formidable Compound Annual Growth Rate (CAGR) of approximately 20%. This expansion is fueled by significant technological shifts in battery chemistry, moving beyond traditional graphite anodes to embrace silicon's superior theoretical capacity. Consumer preferences are increasingly leaning towards longer-range EVs and more durable consumer electronics, directly translating into a demand for batteries with greater energy density, a forte of Si/C composites. Competitive dynamics are intensifying, with established chemical companies and emerging battery material specialists vying for dominance. Opportunities abound in developing novel Si/C composite formulations that address challenges like volume expansion and electrolyte compatibility, thereby enhancing cycle life and safety. The market penetration rate for Si/C composites is expected to climb from an estimated 15% in 2025 to over 50% by 2033, signifying a fundamental shift in battery anode technology. The integration of advanced manufacturing techniques will further streamline production, reducing costs and increasing accessibility. Strategic partnerships between material suppliers and battery manufacturers will be crucial for scaling up production and accelerating market adoption.
Dominant Markets & Segments in Si/C Composites
The Cylindrical Lithium-ion Battery segment is currently the dominant market for Si/C composites, driven by their widespread adoption in the burgeoning electric vehicle (EV) sector. The continuous advancements in silicon anode for EV batteries have made them a preferred choice for manufacturers seeking to maximize range and performance. Within this segment, the More than 800 mAh/g type of Si/C composites is experiencing the most rapid growth, indicating a strong demand for ultra-high energy density solutions.
- Asia Pacific region, particularly China, stands as the leading market and production hub for Si/C composites. The presence of major battery manufacturers and significant government support for EV adoption are key growth drivers. The region's infrastructure development and favorable policies for battery manufacturing contribute to its dominance.
- The United States and Europe are emerging as significant growth markets, propelled by stringent emission regulations and substantial investments in battery gigafactories. The push for battery independence and supply chain diversification further bolsters demand.
- The Square Lithium-ion Battery segment is also witnessing considerable growth, especially in consumer electronics and certain specialized EV applications. Innovations in these battery formats are also leveraging Si/C composites for enhanced performance.
- The 400-800 mAh/g type of Si/C composites continues to hold a substantial market share, offering a balanced performance and cost advantage for a wide range of applications.
Si/C Composites Product Analysis
Si/C composites represent a significant leap forward in lithium-ion battery anode materials, offering a compelling blend of enhanced energy density and improved cycle life. Innovations focus on nano-structuring silicon particles and incorporating carbon matrices to mitigate the volume expansion challenges inherent in silicon. These advanced composites enable batteries to store considerably more energy, translating to longer driving ranges for EVs and extended usage times for portable devices. Their competitive advantage lies in their superior theoretical capacity compared to traditional graphite, paving the way for next-generation battery solutions.
Key Drivers, Barriers & Challenges in Si/C Composites
Growth Drivers in the Si/C Composites Market: The primary forces propelling the Si/C composites market are technological advancements in silicon anodes, the exponential growth of the electric vehicle (EV) sector, and supportive government policies promoting sustainable energy solutions. The increasing consumer demand for longer battery life and faster charging capabilities directly fuels the need for higher energy-density materials like Si/C composites.
Challenges Impacting Si/C Composites Growth: Key challenges include the inherent volume expansion of silicon during cycling, which can degrade battery performance and lifespan. High manufacturing costs for advanced Si/C composites and the need for specialized electrolyte formulations to ensure stability pose significant restraints. Regulatory hurdles related to battery safety and recycling processes also require careful navigation. Supply chain complexities for raw materials and the competitive pressure from other advanced anode materials further impact market growth.
Key Players Shaping the Si/C Composites Market
- BJS
- AME Energy
- Evonik
- Zichen
- Putailai
- Shanshan Technology
- BTR New Energy Material
- ZETO
- Hunan Shinzoom Technology
- Sinuo
- Li-Chen New Materials
Significant Si/C Composites Industry Milestones
- 2020: Introduction of commercially viable silicon-rich anodes with >5% silicon content by major manufacturers.
- 2021: Development of nano-structured silicon-carbon composites achieving over 700 mAh/g capacity.
- 2022: Strategic partnerships formed between Si/C composite suppliers and leading EV manufacturers for large-scale adoption.
- 2023: Breakthroughs in electrolyte additives to significantly improve the cycle life of silicon-based anodes.
- 2024: Increased investment in R&D for scalable and cost-effective manufacturing processes for Si/C composites.
Future Outlook for Si/C Composites Market
The future outlook for the Si/C composites market is exceptionally bright, driven by ongoing technological innovation and the accelerating global transition towards electrification. Strategic opportunities lie in further enhancing energy density, improving cycle life, and reducing manufacturing costs. The increasing adoption in EVs, consumer electronics, and grid-scale energy storage systems will fuel substantial market growth. As research progresses, we can expect to see Si/C composites become a dominant anode material, revolutionizing battery performance and contributing significantly to a sustainable energy future.
Si/C Composites Segmentation
-
1. Application
- 1.1. Cylindrical Lithium-ion Battery
- 1.2. Square Lithium-ion Battery
- 1.3. Other
-
2. Types
- 2.1. Below 400 mAh/g
- 2.2. 400-800 mAh/g
- 2.3. More than 800 mAh/g
Si/C Composites Segmentation By Geography
-
1. North America
- 1.1. United States
- 1.2. Canada
- 1.3. Mexico
-
2. South America
- 2.1. Brazil
- 2.2. Argentina
- 2.3. Rest of South America
-
3. Europe
- 3.1. United Kingdom
- 3.2. Germany
- 3.3. France
- 3.4. Italy
- 3.5. Spain
- 3.6. Russia
- 3.7. Benelux
- 3.8. Nordics
- 3.9. Rest of Europe
-
4. Middle East & Africa
- 4.1. Turkey
- 4.2. Israel
- 4.3. GCC
- 4.4. North Africa
- 4.5. South Africa
- 4.6. Rest of Middle East & Africa
-
5. Asia Pacific
- 5.1. China
- 5.2. India
- 5.3. Japan
- 5.4. South Korea
- 5.5. ASEAN
- 5.6. Oceania
- 5.7. Rest of Asia Pacific
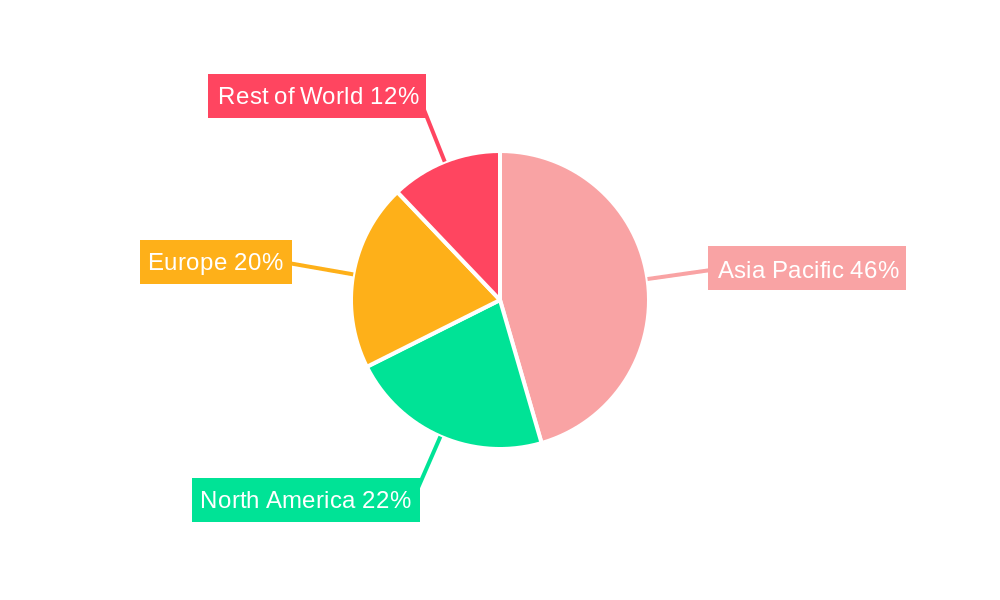
Si/C Composites Regional Market Share
Geographic Coverage of Si/C Composites
Si/C Composites REPORT HIGHLIGHTS
| Aspects | Details |
|---|---|
| Study Period | 2020-2034 |
| Base Year | 2025 |
| Estimated Year | 2026 |
| Forecast Period | 2026-2034 |
| Historical Period | 2020-2025 |
| Growth Rate | CAGR of 9.87% from 2020-2034 |
| Segmentation |
|
Table of Contents
- 1. Introduction
- 1.1. Research Scope
- 1.2. Market Segmentation
- 1.3. Research Methodology
- 1.4. Definitions and Assumptions
- 2. Executive Summary
- 2.1. Introduction
- 3. Market Dynamics
- 3.1. Introduction
- 3.2. Market Drivers
- 3.3. Market Restrains
- 3.4. Market Trends
- 4. Market Factor Analysis
- 4.1. Porters Five Forces
- 4.2. Supply/Value Chain
- 4.3. PESTEL analysis
- 4.4. Market Entropy
- 4.5. Patent/Trademark Analysis
- 5. Global Si/C Composites Analysis, Insights and Forecast, 2020-2032
- 5.1. Market Analysis, Insights and Forecast - by Application
- 5.1.1. Cylindrical Lithium-ion Battery
- 5.1.2. Square Lithium-ion Battery
- 5.1.3. Other
- 5.2. Market Analysis, Insights and Forecast - by Types
- 5.2.1. Below 400 mAh/g
- 5.2.2. 400-800 mAh/g
- 5.2.3. More than 800 mAh/g
- 5.3. Market Analysis, Insights and Forecast - by Region
- 5.3.1. North America
- 5.3.2. South America
- 5.3.3. Europe
- 5.3.4. Middle East & Africa
- 5.3.5. Asia Pacific
- 5.1. Market Analysis, Insights and Forecast - by Application
- 6. North America Si/C Composites Analysis, Insights and Forecast, 2020-2032
- 6.1. Market Analysis, Insights and Forecast - by Application
- 6.1.1. Cylindrical Lithium-ion Battery
- 6.1.2. Square Lithium-ion Battery
- 6.1.3. Other
- 6.2. Market Analysis, Insights and Forecast - by Types
- 6.2.1. Below 400 mAh/g
- 6.2.2. 400-800 mAh/g
- 6.2.3. More than 800 mAh/g
- 6.1. Market Analysis, Insights and Forecast - by Application
- 7. South America Si/C Composites Analysis, Insights and Forecast, 2020-2032
- 7.1. Market Analysis, Insights and Forecast - by Application
- 7.1.1. Cylindrical Lithium-ion Battery
- 7.1.2. Square Lithium-ion Battery
- 7.1.3. Other
- 7.2. Market Analysis, Insights and Forecast - by Types
- 7.2.1. Below 400 mAh/g
- 7.2.2. 400-800 mAh/g
- 7.2.3. More than 800 mAh/g
- 7.1. Market Analysis, Insights and Forecast - by Application
- 8. Europe Si/C Composites Analysis, Insights and Forecast, 2020-2032
- 8.1. Market Analysis, Insights and Forecast - by Application
- 8.1.1. Cylindrical Lithium-ion Battery
- 8.1.2. Square Lithium-ion Battery
- 8.1.3. Other
- 8.2. Market Analysis, Insights and Forecast - by Types
- 8.2.1. Below 400 mAh/g
- 8.2.2. 400-800 mAh/g
- 8.2.3. More than 800 mAh/g
- 8.1. Market Analysis, Insights and Forecast - by Application
- 9. Middle East & Africa Si/C Composites Analysis, Insights and Forecast, 2020-2032
- 9.1. Market Analysis, Insights and Forecast - by Application
- 9.1.1. Cylindrical Lithium-ion Battery
- 9.1.2. Square Lithium-ion Battery
- 9.1.3. Other
- 9.2. Market Analysis, Insights and Forecast - by Types
- 9.2.1. Below 400 mAh/g
- 9.2.2. 400-800 mAh/g
- 9.2.3. More than 800 mAh/g
- 9.1. Market Analysis, Insights and Forecast - by Application
- 10. Asia Pacific Si/C Composites Analysis, Insights and Forecast, 2020-2032
- 10.1. Market Analysis, Insights and Forecast - by Application
- 10.1.1. Cylindrical Lithium-ion Battery
- 10.1.2. Square Lithium-ion Battery
- 10.1.3. Other
- 10.2. Market Analysis, Insights and Forecast - by Types
- 10.2.1. Below 400 mAh/g
- 10.2.2. 400-800 mAh/g
- 10.2.3. More than 800 mAh/g
- 10.1. Market Analysis, Insights and Forecast - by Application
- 11. Competitive Analysis
- 11.1. Global Market Share Analysis 2025
- 11.2. Company Profiles
- 11.2.1 BJS
- 11.2.1.1. Overview
- 11.2.1.2. Products
- 11.2.1.3. SWOT Analysis
- 11.2.1.4. Recent Developments
- 11.2.1.5. Financials (Based on Availability)
- 11.2.2 AME Energy
- 11.2.2.1. Overview
- 11.2.2.2. Products
- 11.2.2.3. SWOT Analysis
- 11.2.2.4. Recent Developments
- 11.2.2.5. Financials (Based on Availability)
- 11.2.3 Evonik
- 11.2.3.1. Overview
- 11.2.3.2. Products
- 11.2.3.3. SWOT Analysis
- 11.2.3.4. Recent Developments
- 11.2.3.5. Financials (Based on Availability)
- 11.2.4 Zichen
- 11.2.4.1. Overview
- 11.2.4.2. Products
- 11.2.4.3. SWOT Analysis
- 11.2.4.4. Recent Developments
- 11.2.4.5. Financials (Based on Availability)
- 11.2.5 Putailai
- 11.2.5.1. Overview
- 11.2.5.2. Products
- 11.2.5.3. SWOT Analysis
- 11.2.5.4. Recent Developments
- 11.2.5.5. Financials (Based on Availability)
- 11.2.6 Shanshan Technology
- 11.2.6.1. Overview
- 11.2.6.2. Products
- 11.2.6.3. SWOT Analysis
- 11.2.6.4. Recent Developments
- 11.2.6.5. Financials (Based on Availability)
- 11.2.7 BTR New Energy Material
- 11.2.7.1. Overview
- 11.2.7.2. Products
- 11.2.7.3. SWOT Analysis
- 11.2.7.4. Recent Developments
- 11.2.7.5. Financials (Based on Availability)
- 11.2.8 ZETO
- 11.2.8.1. Overview
- 11.2.8.2. Products
- 11.2.8.3. SWOT Analysis
- 11.2.8.4. Recent Developments
- 11.2.8.5. Financials (Based on Availability)
- 11.2.9 Hunan Shinzoom Technology
- 11.2.9.1. Overview
- 11.2.9.2. Products
- 11.2.9.3. SWOT Analysis
- 11.2.9.4. Recent Developments
- 11.2.9.5. Financials (Based on Availability)
- 11.2.10 Sinuo
- 11.2.10.1. Overview
- 11.2.10.2. Products
- 11.2.10.3. SWOT Analysis
- 11.2.10.4. Recent Developments
- 11.2.10.5. Financials (Based on Availability)
- 11.2.11 Li-Chen New Materials
- 11.2.11.1. Overview
- 11.2.11.2. Products
- 11.2.11.3. SWOT Analysis
- 11.2.11.4. Recent Developments
- 11.2.11.5. Financials (Based on Availability)
- 11.2.1 BJS
List of Figures
- Figure 1: Global Si/C Composites Revenue Breakdown (undefined, %) by Region 2025 & 2033
- Figure 2: North America Si/C Composites Revenue (undefined), by Application 2025 & 2033
- Figure 3: North America Si/C Composites Revenue Share (%), by Application 2025 & 2033
- Figure 4: North America Si/C Composites Revenue (undefined), by Types 2025 & 2033
- Figure 5: North America Si/C Composites Revenue Share (%), by Types 2025 & 2033
- Figure 6: North America Si/C Composites Revenue (undefined), by Country 2025 & 2033
- Figure 7: North America Si/C Composites Revenue Share (%), by Country 2025 & 2033
- Figure 8: South America Si/C Composites Revenue (undefined), by Application 2025 & 2033
- Figure 9: South America Si/C Composites Revenue Share (%), by Application 2025 & 2033
- Figure 10: South America Si/C Composites Revenue (undefined), by Types 2025 & 2033
- Figure 11: South America Si/C Composites Revenue Share (%), by Types 2025 & 2033
- Figure 12: South America Si/C Composites Revenue (undefined), by Country 2025 & 2033
- Figure 13: South America Si/C Composites Revenue Share (%), by Country 2025 & 2033
- Figure 14: Europe Si/C Composites Revenue (undefined), by Application 2025 & 2033
- Figure 15: Europe Si/C Composites Revenue Share (%), by Application 2025 & 2033
- Figure 16: Europe Si/C Composites Revenue (undefined), by Types 2025 & 2033
- Figure 17: Europe Si/C Composites Revenue Share (%), by Types 2025 & 2033
- Figure 18: Europe Si/C Composites Revenue (undefined), by Country 2025 & 2033
- Figure 19: Europe Si/C Composites Revenue Share (%), by Country 2025 & 2033
- Figure 20: Middle East & Africa Si/C Composites Revenue (undefined), by Application 2025 & 2033
- Figure 21: Middle East & Africa Si/C Composites Revenue Share (%), by Application 2025 & 2033
- Figure 22: Middle East & Africa Si/C Composites Revenue (undefined), by Types 2025 & 2033
- Figure 23: Middle East & Africa Si/C Composites Revenue Share (%), by Types 2025 & 2033
- Figure 24: Middle East & Africa Si/C Composites Revenue (undefined), by Country 2025 & 2033
- Figure 25: Middle East & Africa Si/C Composites Revenue Share (%), by Country 2025 & 2033
- Figure 26: Asia Pacific Si/C Composites Revenue (undefined), by Application 2025 & 2033
- Figure 27: Asia Pacific Si/C Composites Revenue Share (%), by Application 2025 & 2033
- Figure 28: Asia Pacific Si/C Composites Revenue (undefined), by Types 2025 & 2033
- Figure 29: Asia Pacific Si/C Composites Revenue Share (%), by Types 2025 & 2033
- Figure 30: Asia Pacific Si/C Composites Revenue (undefined), by Country 2025 & 2033
- Figure 31: Asia Pacific Si/C Composites Revenue Share (%), by Country 2025 & 2033
List of Tables
- Table 1: Global Si/C Composites Revenue undefined Forecast, by Application 2020 & 2033
- Table 2: Global Si/C Composites Revenue undefined Forecast, by Types 2020 & 2033
- Table 3: Global Si/C Composites Revenue undefined Forecast, by Region 2020 & 2033
- Table 4: Global Si/C Composites Revenue undefined Forecast, by Application 2020 & 2033
- Table 5: Global Si/C Composites Revenue undefined Forecast, by Types 2020 & 2033
- Table 6: Global Si/C Composites Revenue undefined Forecast, by Country 2020 & 2033
- Table 7: United States Si/C Composites Revenue (undefined) Forecast, by Application 2020 & 2033
- Table 8: Canada Si/C Composites Revenue (undefined) Forecast, by Application 2020 & 2033
- Table 9: Mexico Si/C Composites Revenue (undefined) Forecast, by Application 2020 & 2033
- Table 10: Global Si/C Composites Revenue undefined Forecast, by Application 2020 & 2033
- Table 11: Global Si/C Composites Revenue undefined Forecast, by Types 2020 & 2033
- Table 12: Global Si/C Composites Revenue undefined Forecast, by Country 2020 & 2033
- Table 13: Brazil Si/C Composites Revenue (undefined) Forecast, by Application 2020 & 2033
- Table 14: Argentina Si/C Composites Revenue (undefined) Forecast, by Application 2020 & 2033
- Table 15: Rest of South America Si/C Composites Revenue (undefined) Forecast, by Application 2020 & 2033
- Table 16: Global Si/C Composites Revenue undefined Forecast, by Application 2020 & 2033
- Table 17: Global Si/C Composites Revenue undefined Forecast, by Types 2020 & 2033
- Table 18: Global Si/C Composites Revenue undefined Forecast, by Country 2020 & 2033
- Table 19: United Kingdom Si/C Composites Revenue (undefined) Forecast, by Application 2020 & 2033
- Table 20: Germany Si/C Composites Revenue (undefined) Forecast, by Application 2020 & 2033
- Table 21: France Si/C Composites Revenue (undefined) Forecast, by Application 2020 & 2033
- Table 22: Italy Si/C Composites Revenue (undefined) Forecast, by Application 2020 & 2033
- Table 23: Spain Si/C Composites Revenue (undefined) Forecast, by Application 2020 & 2033
- Table 24: Russia Si/C Composites Revenue (undefined) Forecast, by Application 2020 & 2033
- Table 25: Benelux Si/C Composites Revenue (undefined) Forecast, by Application 2020 & 2033
- Table 26: Nordics Si/C Composites Revenue (undefined) Forecast, by Application 2020 & 2033
- Table 27: Rest of Europe Si/C Composites Revenue (undefined) Forecast, by Application 2020 & 2033
- Table 28: Global Si/C Composites Revenue undefined Forecast, by Application 2020 & 2033
- Table 29: Global Si/C Composites Revenue undefined Forecast, by Types 2020 & 2033
- Table 30: Global Si/C Composites Revenue undefined Forecast, by Country 2020 & 2033
- Table 31: Turkey Si/C Composites Revenue (undefined) Forecast, by Application 2020 & 2033
- Table 32: Israel Si/C Composites Revenue (undefined) Forecast, by Application 2020 & 2033
- Table 33: GCC Si/C Composites Revenue (undefined) Forecast, by Application 2020 & 2033
- Table 34: North Africa Si/C Composites Revenue (undefined) Forecast, by Application 2020 & 2033
- Table 35: South Africa Si/C Composites Revenue (undefined) Forecast, by Application 2020 & 2033
- Table 36: Rest of Middle East & Africa Si/C Composites Revenue (undefined) Forecast, by Application 2020 & 2033
- Table 37: Global Si/C Composites Revenue undefined Forecast, by Application 2020 & 2033
- Table 38: Global Si/C Composites Revenue undefined Forecast, by Types 2020 & 2033
- Table 39: Global Si/C Composites Revenue undefined Forecast, by Country 2020 & 2033
- Table 40: China Si/C Composites Revenue (undefined) Forecast, by Application 2020 & 2033
- Table 41: India Si/C Composites Revenue (undefined) Forecast, by Application 2020 & 2033
- Table 42: Japan Si/C Composites Revenue (undefined) Forecast, by Application 2020 & 2033
- Table 43: South Korea Si/C Composites Revenue (undefined) Forecast, by Application 2020 & 2033
- Table 44: ASEAN Si/C Composites Revenue (undefined) Forecast, by Application 2020 & 2033
- Table 45: Oceania Si/C Composites Revenue (undefined) Forecast, by Application 2020 & 2033
- Table 46: Rest of Asia Pacific Si/C Composites Revenue (undefined) Forecast, by Application 2020 & 2033
Frequently Asked Questions
1. What is the projected Compound Annual Growth Rate (CAGR) of the Si/C Composites?
The projected CAGR is approximately 9.87%.
2. Which companies are prominent players in the Si/C Composites?
Key companies in the market include BJS, AME Energy, Evonik, Zichen, Putailai, Shanshan Technology, BTR New Energy Material, ZETO, Hunan Shinzoom Technology, Sinuo, Li-Chen New Materials.
3. What are the main segments of the Si/C Composites?
The market segments include Application, Types.
4. Can you provide details about the market size?
The market size is estimated to be USD XXX N/A as of 2022.
5. What are some drivers contributing to market growth?
N/A
6. What are the notable trends driving market growth?
N/A
7. Are there any restraints impacting market growth?
N/A
8. Can you provide examples of recent developments in the market?
N/A
9. What pricing options are available for accessing the report?
Pricing options include single-user, multi-user, and enterprise licenses priced at USD 2900.00, USD 4350.00, and USD 5800.00 respectively.
10. Is the market size provided in terms of value or volume?
The market size is provided in terms of value, measured in N/A.
11. Are there any specific market keywords associated with the report?
Yes, the market keyword associated with the report is "Si/C Composites," which aids in identifying and referencing the specific market segment covered.
12. How do I determine which pricing option suits my needs best?
The pricing options vary based on user requirements and access needs. Individual users may opt for single-user licenses, while businesses requiring broader access may choose multi-user or enterprise licenses for cost-effective access to the report.
13. Are there any additional resources or data provided in the Si/C Composites report?
While the report offers comprehensive insights, it's advisable to review the specific contents or supplementary materials provided to ascertain if additional resources or data are available.
14. How can I stay updated on further developments or reports in the Si/C Composites?
To stay informed about further developments, trends, and reports in the Si/C Composites, consider subscribing to industry newsletters, following relevant companies and organizations, or regularly checking reputable industry news sources and publications.
Methodology
Step 1 - Identification of Relevant Samples Size from Population Database


Step 2 - Approaches for Defining Global Market Size (Value, Volume* & Price*)

Note*: In applicable scenarios
Step 3 - Data Sources
Primary Research
- Web Analytics
- Survey Reports
- Research Institute
- Latest Research Reports
- Opinion Leaders
Secondary Research
- Annual Reports
- White Paper
- Latest Press Release
- Industry Association
- Paid Database
- Investor Presentations

Step 4 - Data Triangulation
Involves using different sources of information in order to increase the validity of a study
These sources are likely to be stakeholders in a program - participants, other researchers, program staff, other community members, and so on.
Then we put all data in single framework & apply various statistical tools to find out the dynamic on the market.
During the analysis stage, feedback from the stakeholder groups would be compared to determine areas of agreement as well as areas of divergence