

Key Insights
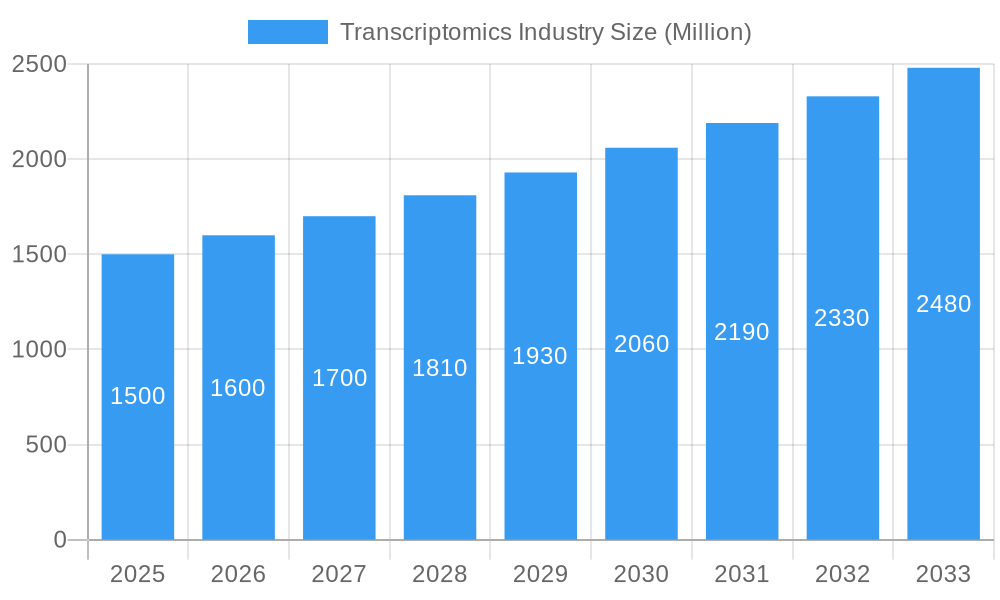
The global transcriptomics market is projected for robust expansion, driven by advancements in sequencing technologies, growing demand for personalized medicine, and the increasing incidence of chronic diseases. The market, valued at $8.31 billion in 2025, is expected to exhibit a Compound Annual Growth Rate (CAGR) of 6.3% from 2025 to 2033. Key growth drivers include the adoption of next-generation sequencing (NGS) for its high throughput and reduced costs, the development of sophisticated bioinformatics tools, and the expanding applications in drug discovery, diagnostics, and disease profiling. The sequencing technologies segment leads the market, followed by microarrays and Q-PCR. Consumables represent the largest product segment due to the significant demand for reagents and kits. In terms of applications, diagnostics and disease profiling hold a substantial share, underscoring transcriptomics' role in personalized medicine and early disease detection. North America and Europe currently dominate the market due to strong healthcare infrastructure, substantial R&D investments, and the presence of key industry players. However, the Asia-Pacific region is anticipated to experience significant growth, supported by increasing healthcare expenditure and rising awareness of advanced diagnostic solutions. Despite challenges such as high technology costs and the need for skilled professionals, the market outlook remains positive for sustained growth.
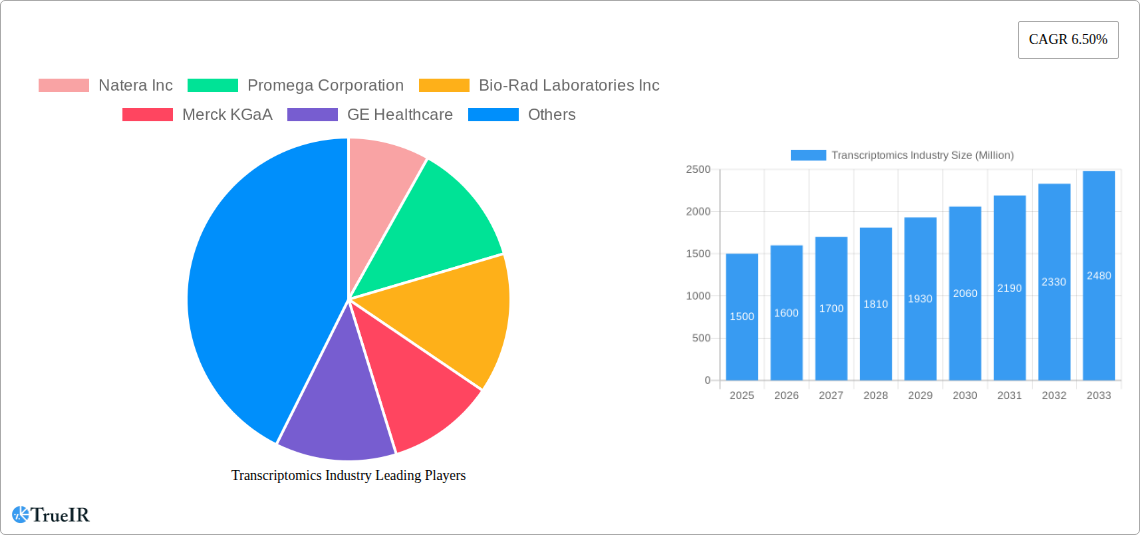
Transcriptomics Industry Market Size (In Billion)
The competitive landscape features established companies including Illumina, Thermo Fisher Scientific, and Roche, alongside innovative emerging players. These entities are focused on R&D, strategic collaborations, and acquisitions to strengthen their market presence and product portfolios. Ongoing technological advancements are expected to reduce costs and increase accessibility, further stimulating market expansion. The development of user-friendly software and analytical tools will also facilitate broader adoption across research and clinical settings. Future growth will be further shaped by collaborations between academic institutions, pharmaceutical companies, and biotech firms, accelerating the translation of research into clinical applications.
Transcriptomics Industry Company Market Share
Transcriptomics Industry Market Report: 2019-2033
This comprehensive report provides a detailed analysis of the global transcriptomics industry, projecting a market value exceeding $XX Billion by 2033. The study covers the historical period (2019-2024), base year (2025), and forecast period (2025-2033), offering invaluable insights for investors, researchers, and industry stakeholders. The report delves into market segmentation, competitive dynamics, technological advancements, and future growth projections, making it an essential resource for navigating this rapidly evolving field.
Transcriptomics Industry Market Structure & Competitive Landscape
The transcriptomics market is characterized by a moderately concentrated structure, with a few major players holding significant market share. However, the presence of numerous smaller companies, particularly in the specialized niche areas, fosters intense competition. Concentration ratios, while varying across segments, are estimated at approximately XX% for the top 5 players in 2025. Innovation, particularly in sequencing technologies and single-cell analysis, is a key driver, pushing companies to continuously develop more advanced and efficient tools.
Regulatory landscapes significantly impact market growth, with varying approval processes and guidelines across different geographies. The industry is witnessing increasing regulatory scrutiny, particularly concerning data privacy and the clinical application of transcriptomics technologies. Product substitutes, such as alternative genomic technologies, present a level of competitive pressure, although transcriptomics remains the dominant method for studying gene expression.
End-user segmentation spans diverse sectors, including academic research, pharmaceutical companies, and diagnostic laboratories. The industry's robust growth is further fueled by strategic mergers and acquisitions (M&A) activity. The total M&A volume in the transcriptomics sector from 2019-2024 is estimated at $XX Billion, indicating a strong appetite for consolidation and expansion among key players.
- High Innovation: Continuous advancements in sequencing technologies drive market expansion.
- Stringent Regulations: Varying regulatory landscapes influence market access and growth across regions.
- Competitive Landscape: A mix of established players and emerging companies create dynamic competition.
- Strategic M&A Activity: Significant M&A activity indicates market consolidation and expansion.
Transcriptomics Industry Market Trends & Opportunities
The global transcriptomics market is experiencing robust growth, driven by several key trends. The market size is projected to reach $XX Billion by 2033, exhibiting a Compound Annual Growth Rate (CAGR) of XX% during the forecast period. Technological advancements, particularly the rise of next-generation sequencing (NGS) and single-cell analysis, are major catalysts. The shift towards personalized medicine is fueling the demand for transcriptomics-based diagnostics and disease profiling. Consumer preferences are increasingly focused on faster, more accurate, and cost-effective solutions, placing pressure on companies to innovate continuously.
The market is also witnessing increased adoption of cloud-based data analysis platforms, simplifying data management and analysis. This trend, combined with the increasing availability of large-scale genomic datasets, is creating new opportunities for data-driven insights and predictive analytics in healthcare and drug discovery. Competitive dynamics remain fierce, with companies constantly striving for innovation and differentiation to gain market share. Market penetration rates for NGS-based transcriptomics are increasing rapidly, particularly in research and diagnostics, while the penetration of single-cell analysis technology is still relatively low but showing substantial growth potential.
Dominant Markets & Segments in Transcriptomics Industry
North America currently dominates the transcriptomics market, driven by robust R&D investments, advanced healthcare infrastructure, and a supportive regulatory environment. Within the segments:
By Technology: Sequencing technologies represent the largest segment, driven by technological advancements and decreasing costs. Q-PCR maintains a significant share, particularly in clinical diagnostics. Microarray technology, while mature, continues to find applications in specific research areas.
By Product: Instruments constitute the largest revenue segment, reflecting the high capital investment in advanced transcriptomics platforms. Consumables are another significant segment, representing recurring revenue streams for manufacturers.
By Application: Diagnostics and disease profiling is currently the largest application segment, fueled by the growing demand for personalized medicine. Drug discovery and development represent a rapidly growing segment, utilizing transcriptomics data for target identification and validation.
Key Growth Drivers:
- Strong R&D Investment: Significant investments in research and development drive innovation and market expansion.
- Favorable Regulatory Environment: Supportive regulations accelerate the adoption of transcriptomics technologies.
- Growing Healthcare Spending: Increased healthcare expenditure supports the growth of diagnostic and therapeutic applications.
- Technological Advancements: Continuous innovation in sequencing and analysis methods fuels market growth.
Transcriptomics Industry Product Analysis
The transcriptomics industry showcases significant technological advancements, particularly in sequencing platforms, single-cell analysis techniques, and bioinformatics tools. Companies are continuously developing more efficient, cost-effective, and accurate tools to meet growing demand. This includes improved sample preparation methods, higher throughput sequencing platforms, and sophisticated bioinformatics software for data analysis. Key competitive advantages lie in the speed, accuracy, sensitivity, and cost-effectiveness of the technologies offered. The market success of new products hinges on ease of use, data quality, and integration with existing workflows within research and clinical settings.
Key Drivers, Barriers & Challenges in Transcriptomics Industry
Key Drivers:
The transcriptomics market is propelled by factors such as increasing demand for personalized medicine, advancements in sequencing technologies, growing research funding in genomics, and expanding applications in drug discovery and diagnostics. The decreasing cost of sequencing, coupled with improving data analysis capabilities, makes transcriptomics more accessible and affordable. Government initiatives supporting genomics research further contribute to industry growth.
Challenges:
Challenges include high initial investment costs associated with instruments and software, the complexity of data analysis requiring specialized expertise, and regulatory hurdles in clinical applications. Supply chain disruptions can affect the availability of consumables and reagents, impacting research and diagnostic workflows. Furthermore, intense competition necessitates continuous innovation and cost optimization to maintain market share.
Growth Drivers in the Transcriptomics Industry Market
Key drivers include the rising prevalence of chronic diseases, accelerating adoption of personalized medicine, continuous advancements in sequencing technologies offering higher throughput and lower costs, and expanding applications in various fields such as oncology, immunology, and infectious diseases. Government funding for genomics research and the development of supportive regulatory frameworks further fuel market growth.
Challenges Impacting Transcriptomics Industry Growth
High initial investment costs for instruments and software, the need for specialized expertise in data analysis, regulatory complexities in clinical applications, and supply chain disruptions impacting reagent availability pose significant challenges. Furthermore, intense competition among manufacturers necessitates continuous innovation and cost optimization.
Key Players Shaping the Transcriptomics Industry Market
Significant Transcriptomics Industry Milestones
May 2022: BioSkryb Genomics launched the Early Access Program (EAP) for ResolveOME, a unified single-cell workflow amplifying the complete genome and full-length mRNA transcripts from the same cell. This represents a significant advancement in single-cell transcriptomics.
January 2022: Parse Biosciences partnered with Research Instruments Pte Ltd to distribute its Evercode Whole Transcriptome Kits, Cell Fixation Kits, and Nuclei Fixation Kits in Singapore and Southeast Asia, expanding market access for its single-cell sequencing solutions.
Future Outlook for Transcriptomics Industry Market
The transcriptomics market is poised for sustained growth, driven by continuous technological innovations, expanding applications in personalized medicine and drug discovery, and increasing global investment in genomics research. Strategic partnerships, collaborations, and M&A activity will further shape the industry landscape. The market is expected to witness the emergence of more sophisticated and integrated platforms, combining various technologies and data analysis tools to provide comprehensive insights into gene expression and its role in health and disease. The integration of artificial intelligence and machine learning will enhance data analysis capabilities and unlock new diagnostic and therapeutic opportunities.
Transcriptomics Industry Segmentation
-
1. Technology
- 1.1. Microarray
- 1.2. Real-tim
- 1.3. Sequencing Technologies
-
2. Product
- 2.1. Consumables
- 2.2. Instruments
- 2.3. Other Products
-
3. Application
- 3.1. Diagnostics and Disease Profiling
- 3.2. Drug Discovery
- 3.3. Other Applications
Transcriptomics Industry Segmentation By Geography
-
1. North America
- 1.1. United States
- 1.2. Canada
- 1.3. Mexico
-
2. Europe
- 2.1. Germany
- 2.2. United Kingdom
- 2.3. France
- 2.4. Italy
- 2.5. Spain
- 2.6. Rest of Europe
-
3. Asia Pacific
- 3.1. China
- 3.2. Japan
- 3.3. India
- 3.4. Australia
- 3.5. South Korea
- 3.6. Rest of Asia Pacific
-
4. Middle East and Africa
- 4.1. GCC
- 4.2. South Africa
- 4.3. Rest of Middle East and Africa
-
5. South America
- 5.1. Brazil
- 5.2. Argentina
- 5.3. Rest of South America
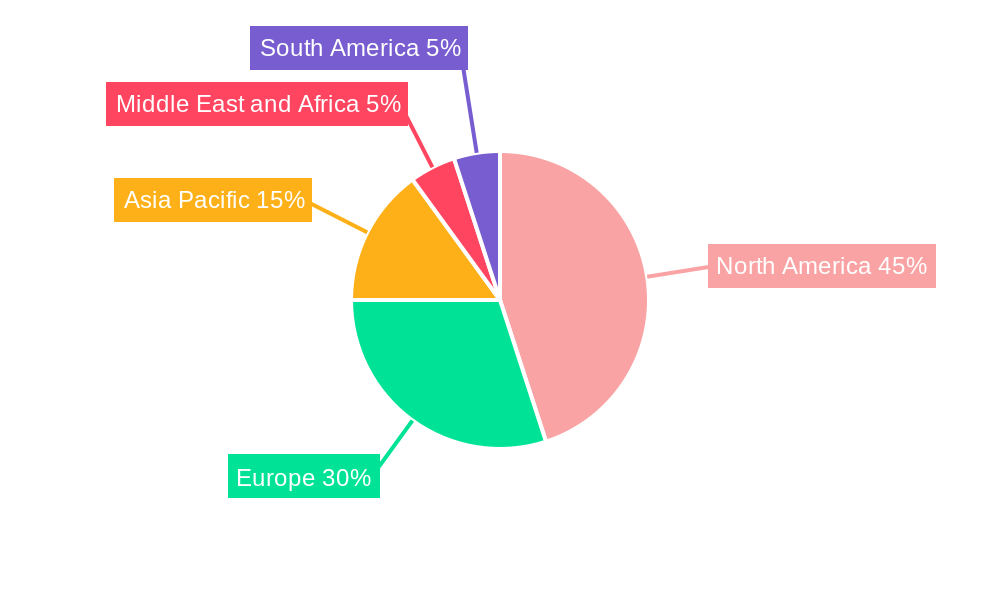
Transcriptomics Industry Regional Market Share
Geographic Coverage of Transcriptomics Industry
Transcriptomics Industry REPORT HIGHLIGHTS
| Aspects | Details |
|---|---|
| Study Period | 2020-2034 |
| Base Year | 2025 |
| Estimated Year | 2026 |
| Forecast Period | 2026-2034 |
| Historical Period | 2020-2025 |
| Growth Rate | CAGR of 6.3% from 2020-2034 |
| Segmentation |
|
Table of Contents
- 1. Introduction
- 1.1. Research Scope
- 1.2. Market Segmentation
- 1.3. Research Objective
- 1.4. Definitions and Assumptions
- 2. Executive Summary
- 2.1. Market Snapshot
- 3. Market Dynamics
- 3.1. Market Drivers
- 3.2. Market Restrains
- 3.3. Market Trends
- 3.4. Market Opportunities
- 4. Market Factor Analysis
- 4.1. Porters Five Forces
- 4.1.1. Bargaining Power of Suppliers
- 4.1.2. Bargaining Power of Buyers
- 4.1.3. Threat of New Entrants
- 4.1.4. Threat of Substitutes
- 4.1.5. Competitive Rivalry
- 4.2. PESTEL analysis
- 4.3. BCG Analysis
- 4.3.1. Stars (High Growth, High Market Share)
- 4.3.2. Cash Cows (Low Growth, High Market Share)
- 4.3.3. Question Mark (High Growth, Low Market Share)
- 4.3.4. Dogs (Low Growth, Low Market Share)
- 4.4. Ansoff Matrix Analysis
- 4.5. Supply Chain Analysis
- 4.6. Regulatory Landscape
- 4.7. Current Market Potential and Opportunity Assessment (TAM–SAM–SOM Framework)
- 4.8. TIR Analyst Note
- 4.1. Porters Five Forces
- 5. Market Analysis, Insights and Forecast 2021-2033
- 5.1. Market Analysis, Insights and Forecast - by Technology
- 5.1.1. Microarray
- 5.1.2. Real-tim
- 5.1.3. Sequencing Technologies
- 5.2. Market Analysis, Insights and Forecast - by Product
- 5.2.1. Consumables
- 5.2.2. Instruments
- 5.2.3. Other Products
- 5.3. Market Analysis, Insights and Forecast - by Application
- 5.3.1. Diagnostics and Disease Profiling
- 5.3.2. Drug Discovery
- 5.3.3. Other Applications
- 5.4. Market Analysis, Insights and Forecast - by Region
- 5.4.1. North America
- 5.4.2. Europe
- 5.4.3. Asia Pacific
- 5.4.4. Middle East and Africa
- 5.4.5. South America
- 5.1. Market Analysis, Insights and Forecast - by Technology
- 6. Global Transcriptomics Industry Analysis, Insights and Forecast, 2021-2033
- 6.1. Market Analysis, Insights and Forecast - by Technology
- 6.1.1. Microarray
- 6.1.2. Real-tim
- 6.1.3. Sequencing Technologies
- 6.2. Market Analysis, Insights and Forecast - by Product
- 6.2.1. Consumables
- 6.2.2. Instruments
- 6.2.3. Other Products
- 6.3. Market Analysis, Insights and Forecast - by Application
- 6.3.1. Diagnostics and Disease Profiling
- 6.3.2. Drug Discovery
- 6.3.3. Other Applications
- 6.1. Market Analysis, Insights and Forecast - by Technology
- 7. North America Transcriptomics Industry Analysis, Insights and Forecast, 2020-2032
- 7.1. Market Analysis, Insights and Forecast - by Technology
- 7.1.1. Microarray
- 7.1.2. Real-tim
- 7.1.3. Sequencing Technologies
- 7.2. Market Analysis, Insights and Forecast - by Product
- 7.2.1. Consumables
- 7.2.2. Instruments
- 7.2.3. Other Products
- 7.3. Market Analysis, Insights and Forecast - by Application
- 7.3.1. Diagnostics and Disease Profiling
- 7.3.2. Drug Discovery
- 7.3.3. Other Applications
- 7.1. Market Analysis, Insights and Forecast - by Technology
- 8. Europe Transcriptomics Industry Analysis, Insights and Forecast, 2020-2032
- 8.1. Market Analysis, Insights and Forecast - by Technology
- 8.1.1. Microarray
- 8.1.2. Real-tim
- 8.1.3. Sequencing Technologies
- 8.2. Market Analysis, Insights and Forecast - by Product
- 8.2.1. Consumables
- 8.2.2. Instruments
- 8.2.3. Other Products
- 8.3. Market Analysis, Insights and Forecast - by Application
- 8.3.1. Diagnostics and Disease Profiling
- 8.3.2. Drug Discovery
- 8.3.3. Other Applications
- 8.1. Market Analysis, Insights and Forecast - by Technology
- 9. Asia Pacific Transcriptomics Industry Analysis, Insights and Forecast, 2020-2032
- 9.1. Market Analysis, Insights and Forecast - by Technology
- 9.1.1. Microarray
- 9.1.2. Real-tim
- 9.1.3. Sequencing Technologies
- 9.2. Market Analysis, Insights and Forecast - by Product
- 9.2.1. Consumables
- 9.2.2. Instruments
- 9.2.3. Other Products
- 9.3. Market Analysis, Insights and Forecast - by Application
- 9.3.1. Diagnostics and Disease Profiling
- 9.3.2. Drug Discovery
- 9.3.3. Other Applications
- 9.1. Market Analysis, Insights and Forecast - by Technology
- 10. Middle East and Africa Transcriptomics Industry Analysis, Insights and Forecast, 2020-2032
- 10.1. Market Analysis, Insights and Forecast - by Technology
- 10.1.1. Microarray
- 10.1.2. Real-tim
- 10.1.3. Sequencing Technologies
- 10.2. Market Analysis, Insights and Forecast - by Product
- 10.2.1. Consumables
- 10.2.2. Instruments
- 10.2.3. Other Products
- 10.3. Market Analysis, Insights and Forecast - by Application
- 10.3.1. Diagnostics and Disease Profiling
- 10.3.2. Drug Discovery
- 10.3.3. Other Applications
- 10.1. Market Analysis, Insights and Forecast - by Technology
- 11. South America Transcriptomics Industry Analysis, Insights and Forecast, 2020-2032
- 11.1. Market Analysis, Insights and Forecast - by Technology
- 11.1.1. Microarray
- 11.1.2. Real-tim
- 11.1.3. Sequencing Technologies
- 11.2. Market Analysis, Insights and Forecast - by Product
- 11.2.1. Consumables
- 11.2.2. Instruments
- 11.2.3. Other Products
- 11.3. Market Analysis, Insights and Forecast - by Application
- 11.3.1. Diagnostics and Disease Profiling
- 11.3.2. Drug Discovery
- 11.3.3. Other Applications
- 11.1. Market Analysis, Insights and Forecast - by Technology
- 12. Competitive Analysis
- 12.1. Company Profiles
- 12.1.1 Natera Inc
- 12.1.1.1. Company Overview
- 12.1.1.2. Products
- 12.1.1.3. Company Financials
- 12.1.1.4. SWOT Analysis
- 12.1.2 Promega Corporation
- 12.1.2.1. Company Overview
- 12.1.2.2. Products
- 12.1.2.3. Company Financials
- 12.1.2.4. SWOT Analysis
- 12.1.3 Bio-Rad Laboratories Inc
- 12.1.3.1. Company Overview
- 12.1.3.2. Products
- 12.1.3.3. Company Financials
- 12.1.3.4. SWOT Analysis
- 12.1.4 Merck KGaA
- 12.1.4.1. Company Overview
- 12.1.4.2. Products
- 12.1.4.3. Company Financials
- 12.1.4.4. SWOT Analysis
- 12.1.5 GE Healthcare
- 12.1.5.1. Company Overview
- 12.1.5.2. Products
- 12.1.5.3. Company Financials
- 12.1.5.4. SWOT Analysis
- 12.1.6 BGI Genomics
- 12.1.6.1. Company Overview
- 12.1.6.2. Products
- 12.1.6.3. Company Financials
- 12.1.6.4. SWOT Analysis
- 12.1.7 Thermo Fisher Scientific*List Not Exhaustive
- 12.1.7.1. Company Overview
- 12.1.7.2. Products
- 12.1.7.3. Company Financials
- 12.1.7.4. SWOT Analysis
- 12.1.8 F Hoffmann-La Roche AG
- 12.1.8.1. Company Overview
- 12.1.8.2. Products
- 12.1.8.3. Company Financials
- 12.1.8.4. SWOT Analysis
- 12.1.9 Agilent Technologies Inc
- 12.1.9.1. Company Overview
- 12.1.9.2. Products
- 12.1.9.3. Company Financials
- 12.1.9.4. SWOT Analysis
- 12.1.10 10x Genomics
- 12.1.10.1. Company Overview
- 12.1.10.2. Products
- 12.1.10.3. Company Financials
- 12.1.10.4. SWOT Analysis
- 12.1.11 PerkinElmer Inc
- 12.1.11.1. Company Overview
- 12.1.11.2. Products
- 12.1.11.3. Company Financials
- 12.1.11.4. SWOT Analysis
- 12.1.12 Qiagen NV
- 12.1.12.1. Company Overview
- 12.1.12.2. Products
- 12.1.12.3. Company Financials
- 12.1.12.4. SWOT Analysis
- 12.1.13 Illumina Inc
- 12.1.13.1. Company Overview
- 12.1.13.2. Products
- 12.1.13.3. Company Financials
- 12.1.13.4. SWOT Analysis
- 12.1.14 Fluidigm Corporation
- 12.1.14.1. Company Overview
- 12.1.14.2. Products
- 12.1.14.3. Company Financials
- 12.1.14.4. SWOT Analysis
- 12.1.15 Dovetail Genomics
- 12.1.15.1. Company Overview
- 12.1.15.2. Products
- 12.1.15.3. Company Financials
- 12.1.15.4. SWOT Analysis
- 12.1.1 Natera Inc
- 12.2. Market Entropy
- 12.2.1 Company's Key Areas Served
- 12.2.2 Recent Developments
- 12.3. Company Market Share Analysis 2025
- 12.3.1 Top 5 Companies Market Share Analysis
- 12.3.2 Top 3 Companies Market Share Analysis
- 12.4. List of Potential Customers
- 13. Research Methodology
List of Figures
- Figure 1: Global Transcriptomics Industry Revenue Breakdown (billion, %) by Region 2025 & 2033
- Figure 2: North America Transcriptomics Industry Revenue (billion), by Technology 2025 & 2033
- Figure 3: North America Transcriptomics Industry Revenue Share (%), by Technology 2025 & 2033
- Figure 4: North America Transcriptomics Industry Revenue (billion), by Product 2025 & 2033
- Figure 5: North America Transcriptomics Industry Revenue Share (%), by Product 2025 & 2033
- Figure 6: North America Transcriptomics Industry Revenue (billion), by Application 2025 & 2033
- Figure 7: North America Transcriptomics Industry Revenue Share (%), by Application 2025 & 2033
- Figure 8: North America Transcriptomics Industry Revenue (billion), by Country 2025 & 2033
- Figure 9: North America Transcriptomics Industry Revenue Share (%), by Country 2025 & 2033
- Figure 10: Europe Transcriptomics Industry Revenue (billion), by Technology 2025 & 2033
- Figure 11: Europe Transcriptomics Industry Revenue Share (%), by Technology 2025 & 2033
- Figure 12: Europe Transcriptomics Industry Revenue (billion), by Product 2025 & 2033
- Figure 13: Europe Transcriptomics Industry Revenue Share (%), by Product 2025 & 2033
- Figure 14: Europe Transcriptomics Industry Revenue (billion), by Application 2025 & 2033
- Figure 15: Europe Transcriptomics Industry Revenue Share (%), by Application 2025 & 2033
- Figure 16: Europe Transcriptomics Industry Revenue (billion), by Country 2025 & 2033
- Figure 17: Europe Transcriptomics Industry Revenue Share (%), by Country 2025 & 2033
- Figure 18: Asia Pacific Transcriptomics Industry Revenue (billion), by Technology 2025 & 2033
- Figure 19: Asia Pacific Transcriptomics Industry Revenue Share (%), by Technology 2025 & 2033
- Figure 20: Asia Pacific Transcriptomics Industry Revenue (billion), by Product 2025 & 2033
- Figure 21: Asia Pacific Transcriptomics Industry Revenue Share (%), by Product 2025 & 2033
- Figure 22: Asia Pacific Transcriptomics Industry Revenue (billion), by Application 2025 & 2033
- Figure 23: Asia Pacific Transcriptomics Industry Revenue Share (%), by Application 2025 & 2033
- Figure 24: Asia Pacific Transcriptomics Industry Revenue (billion), by Country 2025 & 2033
- Figure 25: Asia Pacific Transcriptomics Industry Revenue Share (%), by Country 2025 & 2033
- Figure 26: Middle East and Africa Transcriptomics Industry Revenue (billion), by Technology 2025 & 2033
- Figure 27: Middle East and Africa Transcriptomics Industry Revenue Share (%), by Technology 2025 & 2033
- Figure 28: Middle East and Africa Transcriptomics Industry Revenue (billion), by Product 2025 & 2033
- Figure 29: Middle East and Africa Transcriptomics Industry Revenue Share (%), by Product 2025 & 2033
- Figure 30: Middle East and Africa Transcriptomics Industry Revenue (billion), by Application 2025 & 2033
- Figure 31: Middle East and Africa Transcriptomics Industry Revenue Share (%), by Application 2025 & 2033
- Figure 32: Middle East and Africa Transcriptomics Industry Revenue (billion), by Country 2025 & 2033
- Figure 33: Middle East and Africa Transcriptomics Industry Revenue Share (%), by Country 2025 & 2033
- Figure 34: South America Transcriptomics Industry Revenue (billion), by Technology 2025 & 2033
- Figure 35: South America Transcriptomics Industry Revenue Share (%), by Technology 2025 & 2033
- Figure 36: South America Transcriptomics Industry Revenue (billion), by Product 2025 & 2033
- Figure 37: South America Transcriptomics Industry Revenue Share (%), by Product 2025 & 2033
- Figure 38: South America Transcriptomics Industry Revenue (billion), by Application 2025 & 2033
- Figure 39: South America Transcriptomics Industry Revenue Share (%), by Application 2025 & 2033
- Figure 40: South America Transcriptomics Industry Revenue (billion), by Country 2025 & 2033
- Figure 41: South America Transcriptomics Industry Revenue Share (%), by Country 2025 & 2033
List of Tables
- Table 1: Global Transcriptomics Industry Revenue billion Forecast, by Technology 2020 & 2033
- Table 2: Global Transcriptomics Industry Revenue billion Forecast, by Product 2020 & 2033
- Table 3: Global Transcriptomics Industry Revenue billion Forecast, by Application 2020 & 2033
- Table 4: Global Transcriptomics Industry Revenue billion Forecast, by Region 2020 & 2033
- Table 5: Global Transcriptomics Industry Revenue billion Forecast, by Technology 2020 & 2033
- Table 6: Global Transcriptomics Industry Revenue billion Forecast, by Product 2020 & 2033
- Table 7: Global Transcriptomics Industry Revenue billion Forecast, by Application 2020 & 2033
- Table 8: Global Transcriptomics Industry Revenue billion Forecast, by Country 2020 & 2033
- Table 9: United States Transcriptomics Industry Revenue (billion) Forecast, by Application 2020 & 2033
- Table 10: Canada Transcriptomics Industry Revenue (billion) Forecast, by Application 2020 & 2033
- Table 11: Mexico Transcriptomics Industry Revenue (billion) Forecast, by Application 2020 & 2033
- Table 12: Global Transcriptomics Industry Revenue billion Forecast, by Technology 2020 & 2033
- Table 13: Global Transcriptomics Industry Revenue billion Forecast, by Product 2020 & 2033
- Table 14: Global Transcriptomics Industry Revenue billion Forecast, by Application 2020 & 2033
- Table 15: Global Transcriptomics Industry Revenue billion Forecast, by Country 2020 & 2033
- Table 16: Germany Transcriptomics Industry Revenue (billion) Forecast, by Application 2020 & 2033
- Table 17: United Kingdom Transcriptomics Industry Revenue (billion) Forecast, by Application 2020 & 2033
- Table 18: France Transcriptomics Industry Revenue (billion) Forecast, by Application 2020 & 2033
- Table 19: Italy Transcriptomics Industry Revenue (billion) Forecast, by Application 2020 & 2033
- Table 20: Spain Transcriptomics Industry Revenue (billion) Forecast, by Application 2020 & 2033
- Table 21: Rest of Europe Transcriptomics Industry Revenue (billion) Forecast, by Application 2020 & 2033
- Table 22: Global Transcriptomics Industry Revenue billion Forecast, by Technology 2020 & 2033
- Table 23: Global Transcriptomics Industry Revenue billion Forecast, by Product 2020 & 2033
- Table 24: Global Transcriptomics Industry Revenue billion Forecast, by Application 2020 & 2033
- Table 25: Global Transcriptomics Industry Revenue billion Forecast, by Country 2020 & 2033
- Table 26: China Transcriptomics Industry Revenue (billion) Forecast, by Application 2020 & 2033
- Table 27: Japan Transcriptomics Industry Revenue (billion) Forecast, by Application 2020 & 2033
- Table 28: India Transcriptomics Industry Revenue (billion) Forecast, by Application 2020 & 2033
- Table 29: Australia Transcriptomics Industry Revenue (billion) Forecast, by Application 2020 & 2033
- Table 30: South Korea Transcriptomics Industry Revenue (billion) Forecast, by Application 2020 & 2033
- Table 31: Rest of Asia Pacific Transcriptomics Industry Revenue (billion) Forecast, by Application 2020 & 2033
- Table 32: Global Transcriptomics Industry Revenue billion Forecast, by Technology 2020 & 2033
- Table 33: Global Transcriptomics Industry Revenue billion Forecast, by Product 2020 & 2033
- Table 34: Global Transcriptomics Industry Revenue billion Forecast, by Application 2020 & 2033
- Table 35: Global Transcriptomics Industry Revenue billion Forecast, by Country 2020 & 2033
- Table 36: GCC Transcriptomics Industry Revenue (billion) Forecast, by Application 2020 & 2033
- Table 37: South Africa Transcriptomics Industry Revenue (billion) Forecast, by Application 2020 & 2033
- Table 38: Rest of Middle East and Africa Transcriptomics Industry Revenue (billion) Forecast, by Application 2020 & 2033
- Table 39: Global Transcriptomics Industry Revenue billion Forecast, by Technology 2020 & 2033
- Table 40: Global Transcriptomics Industry Revenue billion Forecast, by Product 2020 & 2033
- Table 41: Global Transcriptomics Industry Revenue billion Forecast, by Application 2020 & 2033
- Table 42: Global Transcriptomics Industry Revenue billion Forecast, by Country 2020 & 2033
- Table 43: Brazil Transcriptomics Industry Revenue (billion) Forecast, by Application 2020 & 2033
- Table 44: Argentina Transcriptomics Industry Revenue (billion) Forecast, by Application 2020 & 2033
- Table 45: Rest of South America Transcriptomics Industry Revenue (billion) Forecast, by Application 2020 & 2033
Frequently Asked Questions
1. What is the projected Compound Annual Growth Rate (CAGR) of the Transcriptomics Industry?
The projected CAGR is approximately 6.3%.
2. Which companies are prominent players in the Transcriptomics Industry?
Key companies in the market include Natera Inc, Promega Corporation, Bio-Rad Laboratories Inc, Merck KGaA, GE Healthcare, BGI Genomics, Thermo Fisher Scientific*List Not Exhaustive, F Hoffmann-La Roche AG, Agilent Technologies Inc, 10x Genomics, PerkinElmer Inc, Qiagen NV, Illumina Inc, Fluidigm Corporation, Dovetail Genomics.
3. What are the main segments of the Transcriptomics Industry?
The market segments include Technology, Product, Application.
4. Can you provide details about the market size?
The market size is estimated to be USD 8.31 billion as of 2022.
5. What are some drivers contributing to market growth?
Increasing Research and Development in Transciptomics; Increasing Prevalence of Chronic Illnesses; Increase in Applications of Transcriptomics.
6. What are the notable trends driving market growth?
Diagnostics and Disease Profiling is Expected to Witness Growth Over The Forecast Period.
7. Are there any restraints impacting market growth?
Lack of Awareness Regarding the Technology; Stringent Regulatory Policies.
8. Can you provide examples of recent developments in the market?
In May 2022, BioSkryb Genomics launched the Early Access Program (EAP) for ResolveOME. This unified, single-cell workflow amplifies the complete genome and full-length mRNA transcripts of the entire transcriptome from the same cell.
9. What pricing options are available for accessing the report?
Pricing options include single-user, multi-user, and enterprise licenses priced at USD 4750, USD 5250, and USD 8750 respectively.
10. Is the market size provided in terms of value or volume?
The market size is provided in terms of value, measured in billion.
11. Are there any specific market keywords associated with the report?
Yes, the market keyword associated with the report is "Transcriptomics Industry," which aids in identifying and referencing the specific market segment covered.
12. How do I determine which pricing option suits my needs best?
The pricing options vary based on user requirements and access needs. Individual users may opt for single-user licenses, while businesses requiring broader access may choose multi-user or enterprise licenses for cost-effective access to the report.
13. Are there any additional resources or data provided in the Transcriptomics Industry report?
While the report offers comprehensive insights, it's advisable to review the specific contents or supplementary materials provided to ascertain if additional resources or data are available.
14. How can I stay updated on further developments or reports in the Transcriptomics Industry?
To stay informed about further developments, trends, and reports in the Transcriptomics Industry, consider subscribing to industry newsletters, following relevant companies and organizations, or regularly checking reputable industry news sources and publications.
Methodology
Step 1 - Identification of Relevant Samples Size from Population Database


Step 2 - Approaches for Defining Global Market Size (Value, Volume* & Price*)

Note*: In applicable scenarios
Step 3 - Data Sources
Primary Research
- Web Analytics
- Survey Reports
- Research Institute
- Latest Research Reports
- Opinion Leaders
Secondary Research
- Annual Reports
- White Paper
- Latest Press Release
- Industry Association
- Paid Database
- Investor Presentations

Step 4 - Data Triangulation
Involves using different sources of information in order to increase the validity of a study
These sources are likely to be stakeholders in a program - participants, other researchers, program staff, other community members, and so on.
Then we put all data in single framework & apply various statistical tools to find out the dynamic on the market.
During the analysis stage, feedback from the stakeholder groups would be compared to determine areas of agreement as well as areas of divergence