

Key Insights
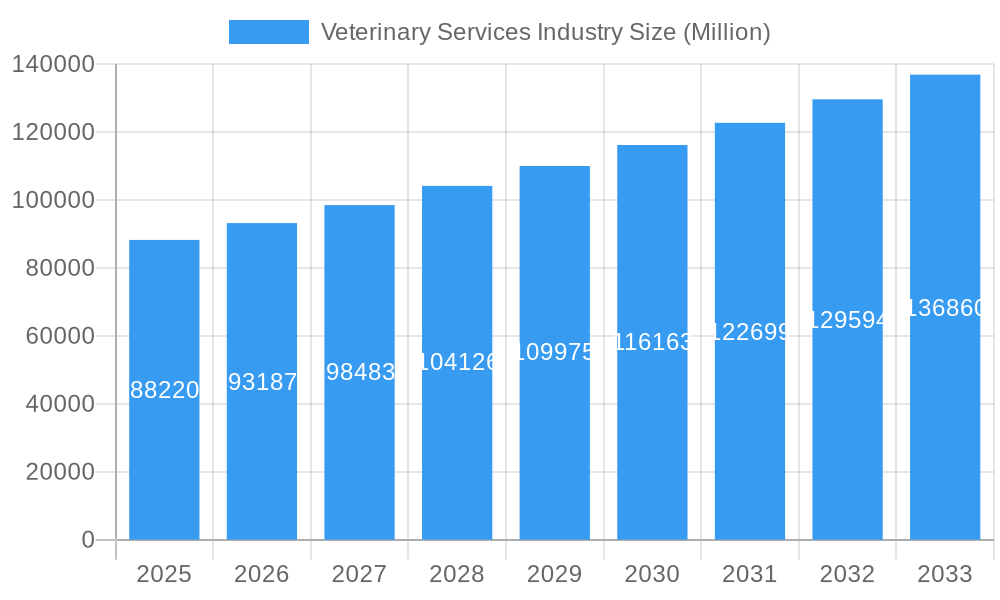
The global veterinary services market, valued at $88.22 billion in 2025, is projected to experience robust growth, driven by several key factors. The increasing humanization of pets, coupled with rising pet ownership worldwide, fuels demand for advanced veterinary care, including specialized services like diagnostic imaging, surgery, and oncology. This trend is particularly pronounced in developed nations like those in North America and Europe, where pet owners are more willing and able to invest in their animals' health. Furthermore, the growing awareness of animal welfare and the increasing availability of pet insurance are contributing to market expansion. Technological advancements, such as improved diagnostic tools and minimally invasive surgical techniques, are also enhancing the quality and efficiency of veterinary services, further boosting market growth. The market is segmented by animal type (companion animals holding the largest share due to higher pet ownership and spending), type of care (emergency and specialty services showing higher growth due to increasing complexity of cases), and geographic region (North America currently dominating due to high pet ownership and veterinary infrastructure).
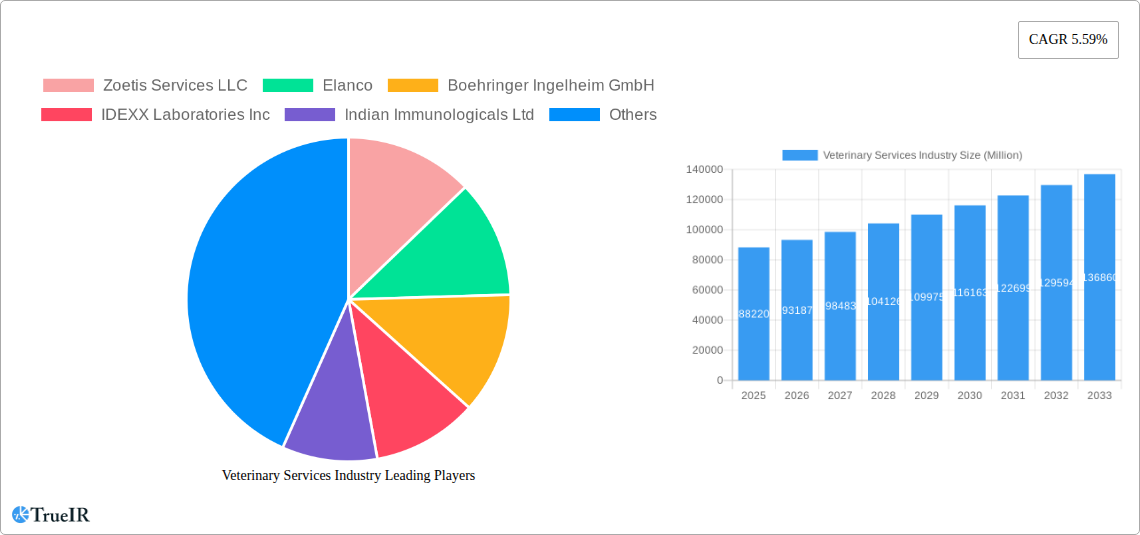
Veterinary Services Industry Market Size (In Billion)
However, several factors could restrain market growth. High veterinary service costs, particularly for specialized care, may limit access for some pet owners. Additionally, regional variations in veterinary infrastructure and access to skilled professionals create disparities in service availability and affordability. While the market is projected to grow at a CAGR of 5.59% from 2025 to 2033, overcoming these challenges will be crucial for sustained and equitable growth across all regions. Emerging markets in Asia-Pacific and other developing regions present significant opportunities, albeit with the need for increased veterinary infrastructure investment and professional training. The competitive landscape is marked by a mix of large multinational corporations and smaller regional players, leading to continuous innovation and service diversification.
Veterinary Services Industry Company Market Share
Veterinary Services Industry Market Report: 2019-2033
This comprehensive report provides a detailed analysis of the global Veterinary Services industry, projecting a market value of $XX Million by 2033. The report covers the period from 2019 to 2033, with a base year of 2025 and a forecast period of 2025-2033. It offers in-depth insights into market structure, competitive dynamics, growth drivers, challenges, and future outlook, providing valuable intelligence for stakeholders across the veterinary services ecosystem.
Veterinary Services Industry Market Structure & Competitive Landscape
The veterinary services market is characterized by a moderately concentrated structure, with a few large multinational corporations holding significant market share. The Herfindahl-Hirschman Index (HHI) is estimated at xx, indicating a moderately consolidated market. Key players such as Zoetis, Elanco, and Boehringer Ingelheim dominate through their extensive product portfolios and global reach. However, the market also exhibits a fragmented landscape with numerous smaller regional players catering to specific niches.
Innovation is a key driver, with continuous advancements in diagnostics, therapeutics, and surgical procedures shaping market growth. Stringent regulatory frameworks, varying across regions, influence product approvals and market access. Substitute products, such as home remedies and alternative therapies, pose a limited challenge, particularly in the companion animal segment.
The market is segmented by animal type (companion and production animals) and type of care (primary, emergency, critical, specialty, and others including diagnostic services and pet care counselling). Mergers and acquisitions (M&A) are frequent, with larger companies strategically acquiring smaller specialized firms to expand their service offerings and geographical footprint. The M&A volume from 2019-2024 reached approximately $XX Million, with a projected increase in the forecast period. This strategic expansion reflects the industry's growth potential and competitive intensity.
- High Market Concentration: Dominated by a few major players, with regional variations.
- Innovation-Driven Growth: Continuous advancements in diagnostics, therapeutics, and surgical procedures.
- Stringent Regulatory Landscape: Varying regulations impacting market entry and product approval.
- Active M&A Activity: Companies expanding their reach and service offerings through strategic acquisitions.
- End-User Segmentation: Distinct market segments by animal type and type of care.
Veterinary Services Industry Market Trends & Opportunities
The global veterinary services market is experiencing robust growth, driven by increasing pet ownership, rising disposable incomes, and a growing awareness of animal health. The market size is estimated at $XX Million in 2025, exhibiting a Compound Annual Growth Rate (CAGR) of xx% during the forecast period (2025-2033). Market penetration rates vary significantly across regions, with developed markets exhibiting higher penetration compared to emerging economies. Technological advancements, such as telemedicine and advanced diagnostics, are transforming service delivery, enhancing efficiency, and improving animal care outcomes.
Consumer preferences are shifting towards specialized services, personalized care, and preventive healthcare for both companion and production animals. The rise of pet insurance further fuels demand for higher quality veterinary care. Competitive dynamics are characterized by intense rivalry among established players and the emergence of innovative startups. Strategic partnerships, alliances, and distribution agreements are common strategies employed to gain market share.
Dominant Markets & Segments in Veterinary Services Industry
The companion animal segment holds the largest share of the veterinary services market, driven by increasing pet ownership and humanization of pets. Geographically, North America and Europe are the leading markets, fueled by high pet ownership rates, high per capita disposable income, and advanced veterinary infrastructure.
- Leading Segment: Companion Animal, driven by higher pet ownership and spending.
- Leading Region: North America and Europe, due to high pet ownership rates and advanced infrastructure.
- High-Growth Segments: Specialty services and diagnostic services demonstrate strong growth potential.
- Growth Drivers:
- Rising pet ownership and humanization of pets.
- Increasing disposable incomes.
- Growing awareness of animal health and preventive care.
- Technological advancements in diagnostics and treatment.
- Favorable government policies and regulations in some regions.
Veterinary Services Industry Product Analysis
The veterinary services industry offers a wide range of products, including pharmaceuticals, diagnostics, surgical instruments, and other medical devices. Recent innovations focus on improved efficacy, enhanced diagnostic capabilities, and minimally invasive procedures. The competitive advantage lies in product differentiation, superior quality, technological advancements, and strong distribution networks. Market fit is determined by regulatory approvals, pricing strategies, and effective marketing campaigns. Technological advancements are driving demand for sophisticated diagnostics and specialized treatments.
Key Drivers, Barriers & Challenges in Veterinary Services Industry
Key Drivers: Rising pet ownership globally, increasing disposable incomes, heightened awareness regarding animal health and welfare, technological advancements in diagnostics and treatment, supportive government regulations, and the growing availability of pet insurance are all significant drivers of market growth.
Challenges: Stringent regulatory approvals for new products and services, complexities in supply chains impacting the availability of essential medical supplies, increased competition from new market entrants, and rising costs of veterinary care and insurance are key challenges hindering accelerated market growth. These factors impose a quantifiable impact, potentially slowing the CAGR by xx% in specific regions.
Growth Drivers in the Veterinary Services Industry Market
The rising pet humanization trend and increased pet ownership are primary drivers. Technological advancements, such as telemedicine and improved diagnostic tools, enhance service delivery and market reach. Favorable government policies supporting animal welfare and investment in veterinary infrastructure also contribute positively.
Challenges Impacting Veterinary Services Industry Growth
Regulatory hurdles for new product approvals and escalating costs of veterinary services are prominent challenges. Supply chain disruptions, particularly concerning essential medicines and equipment, impact service delivery and market stability. Increased competition from established players and new market entrants also presents a significant obstacle.
Key Players Shaping the Veterinary Services Industry Market
- Zoetis Services LLC
- Elanco
- Boehringer Ingelheim GmbH
- IDEXX Laboratories Inc
- Indian Immunologicals Ltd
- Vetoquinol S A
- Hester Bioscience
- Heska Corp
- Ceva Sant Animale
- Phibro Animal Health
- Virbac
- Merck Animal Health
Significant Veterinary Services Industry Milestones
- April 2022: Animalcare launched Plaqtiv+, a new range of dental care products for cats and dogs, impacting the companion animal segment's preventative care market.
- April 2022: Aurena Laboratories AB partnered with Emollivet, signifying increased collaboration and innovation in animal healthcare product development.
Future Outlook for Veterinary Services Industry Market
The veterinary services market is poised for continued growth, driven by technological advancements, rising pet ownership, and increasing consumer spending on animal healthcare. Strategic investments in research and development, expansion into emerging markets, and diversification of service offerings will be key success factors for industry players. The market presents significant opportunities for companies to capitalize on the rising demand for advanced veterinary care and personalized pet healthcare solutions.
Veterinary Services Industry Segmentation
-
1. Animal Type
- 1.1. Companion Animal
- 1.2. Production Animal
-
2. Type of Care
- 2.1. Primary
- 2.2. Emergency
- 2.3. Critical
- 2.4. Specialty Services
- 2.5. Others S
Veterinary Services Industry Segmentation By Geography
-
1. North America
- 1.1. United States
- 1.2. Canada
- 1.3. Mexico
-
2. Europe
- 2.1. Germany
- 2.2. United Kingdom
- 2.3. France
- 2.4. Italy
- 2.5. Spain
- 2.6. Rest of Europe
-
3. Asia Pacific
- 3.1. China
- 3.2. Japan
- 3.3. India
- 3.4. Australia
- 3.5. South Korea
- 3.6. Rest of Asia Pacific
-
4. Middle East and Africa
- 4.1. GCC
- 4.2. South Africa
- 4.3. Rest of Middle East and Africa
-
5. South America
- 5.1. Brazil
- 5.2. Argentina
- 5.3. Rest of South America
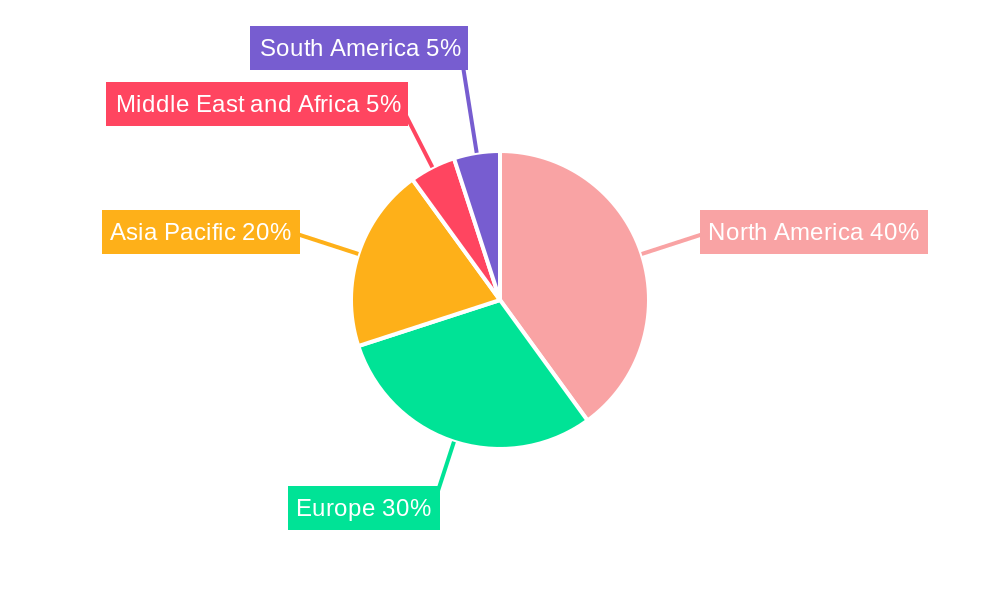
Veterinary Services Industry Regional Market Share
Geographic Coverage of Veterinary Services Industry
Veterinary Services Industry REPORT HIGHLIGHTS
| Aspects | Details |
|---|---|
| Study Period | 2020-2034 |
| Base Year | 2025 |
| Estimated Year | 2026 |
| Forecast Period | 2026-2034 |
| Historical Period | 2020-2025 |
| Growth Rate | CAGR of 5.59% from 2020-2034 |
| Segmentation |
|
Table of Contents
- 1. Introduction
- 1.1. Research Scope
- 1.2. Market Segmentation
- 1.3. Research Objective
- 1.4. Definitions and Assumptions
- 2. Executive Summary
- 2.1. Market Snapshot
- 3. Market Dynamics
- 3.1. Market Drivers
- 3.2. Market Restrains
- 3.3. Market Trends
- 3.4. Market Opportunities
- 4. Market Factor Analysis
- 4.1. Porters Five Forces
- 4.1.1. Bargaining Power of Suppliers
- 4.1.2. Bargaining Power of Buyers
- 4.1.3. Threat of New Entrants
- 4.1.4. Threat of Substitutes
- 4.1.5. Competitive Rivalry
- 4.2. PESTEL analysis
- 4.3. BCG Analysis
- 4.3.1. Stars (High Growth, High Market Share)
- 4.3.2. Cash Cows (Low Growth, High Market Share)
- 4.3.3. Question Mark (High Growth, Low Market Share)
- 4.3.4. Dogs (Low Growth, Low Market Share)
- 4.4. Ansoff Matrix Analysis
- 4.5. Supply Chain Analysis
- 4.6. Regulatory Landscape
- 4.7. Current Market Potential and Opportunity Assessment (TAM–SAM–SOM Framework)
- 4.8. TIR Analyst Note
- 4.1. Porters Five Forces
- 5. Market Analysis, Insights and Forecast 2021-2033
- 5.1. Market Analysis, Insights and Forecast - by Animal Type
- 5.1.1. Companion Animal
- 5.1.2. Production Animal
- 5.2. Market Analysis, Insights and Forecast - by Type of Care
- 5.2.1. Primary
- 5.2.2. Emergency
- 5.2.3. Critical
- 5.2.4. Specialty Services
- 5.2.5. Others S
- 5.3. Market Analysis, Insights and Forecast - by Region
- 5.3.1. North America
- 5.3.2. Europe
- 5.3.3. Asia Pacific
- 5.3.4. Middle East and Africa
- 5.3.5. South America
- 5.1. Market Analysis, Insights and Forecast - by Animal Type
- 6. Global Veterinary Services Industry Analysis, Insights and Forecast, 2021-2033
- 6.1. Market Analysis, Insights and Forecast - by Animal Type
- 6.1.1. Companion Animal
- 6.1.2. Production Animal
- 6.2. Market Analysis, Insights and Forecast - by Type of Care
- 6.2.1. Primary
- 6.2.2. Emergency
- 6.2.3. Critical
- 6.2.4. Specialty Services
- 6.2.5. Others S
- 6.1. Market Analysis, Insights and Forecast - by Animal Type
- 7. North America Veterinary Services Industry Analysis, Insights and Forecast, 2020-2032
- 7.1. Market Analysis, Insights and Forecast - by Animal Type
- 7.1.1. Companion Animal
- 7.1.2. Production Animal
- 7.2. Market Analysis, Insights and Forecast - by Type of Care
- 7.2.1. Primary
- 7.2.2. Emergency
- 7.2.3. Critical
- 7.2.4. Specialty Services
- 7.2.5. Others S
- 7.1. Market Analysis, Insights and Forecast - by Animal Type
- 8. Europe Veterinary Services Industry Analysis, Insights and Forecast, 2020-2032
- 8.1. Market Analysis, Insights and Forecast - by Animal Type
- 8.1.1. Companion Animal
- 8.1.2. Production Animal
- 8.2. Market Analysis, Insights and Forecast - by Type of Care
- 8.2.1. Primary
- 8.2.2. Emergency
- 8.2.3. Critical
- 8.2.4. Specialty Services
- 8.2.5. Others S
- 8.1. Market Analysis, Insights and Forecast - by Animal Type
- 9. Asia Pacific Veterinary Services Industry Analysis, Insights and Forecast, 2020-2032
- 9.1. Market Analysis, Insights and Forecast - by Animal Type
- 9.1.1. Companion Animal
- 9.1.2. Production Animal
- 9.2. Market Analysis, Insights and Forecast - by Type of Care
- 9.2.1. Primary
- 9.2.2. Emergency
- 9.2.3. Critical
- 9.2.4. Specialty Services
- 9.2.5. Others S
- 9.1. Market Analysis, Insights and Forecast - by Animal Type
- 10. Middle East and Africa Veterinary Services Industry Analysis, Insights and Forecast, 2020-2032
- 10.1. Market Analysis, Insights and Forecast - by Animal Type
- 10.1.1. Companion Animal
- 10.1.2. Production Animal
- 10.2. Market Analysis, Insights and Forecast - by Type of Care
- 10.2.1. Primary
- 10.2.2. Emergency
- 10.2.3. Critical
- 10.2.4. Specialty Services
- 10.2.5. Others S
- 10.1. Market Analysis, Insights and Forecast - by Animal Type
- 11. South America Veterinary Services Industry Analysis, Insights and Forecast, 2020-2032
- 11.1. Market Analysis, Insights and Forecast - by Animal Type
- 11.1.1. Companion Animal
- 11.1.2. Production Animal
- 11.2. Market Analysis, Insights and Forecast - by Type of Care
- 11.2.1. Primary
- 11.2.2. Emergency
- 11.2.3. Critical
- 11.2.4. Specialty Services
- 11.2.5. Others S
- 11.1. Market Analysis, Insights and Forecast - by Animal Type
- 12. Competitive Analysis
- 12.1. Company Profiles
- 12.1.1 Zoetis Services LLC
- 12.1.1.1. Company Overview
- 12.1.1.2. Products
- 12.1.1.3. Company Financials
- 12.1.1.4. SWOT Analysis
- 12.1.2 Elanco
- 12.1.2.1. Company Overview
- 12.1.2.2. Products
- 12.1.2.3. Company Financials
- 12.1.2.4. SWOT Analysis
- 12.1.3 Boehringer Ingelheim GmbH
- 12.1.3.1. Company Overview
- 12.1.3.2. Products
- 12.1.3.3. Company Financials
- 12.1.3.4. SWOT Analysis
- 12.1.4 IDEXX Laboratories Inc
- 12.1.4.1. Company Overview
- 12.1.4.2. Products
- 12.1.4.3. Company Financials
- 12.1.4.4. SWOT Analysis
- 12.1.5 Indian Immunologicals Ltd
- 12.1.5.1. Company Overview
- 12.1.5.2. Products
- 12.1.5.3. Company Financials
- 12.1.5.4. SWOT Analysis
- 12.1.6 Vetoquinol S A
- 12.1.6.1. Company Overview
- 12.1.6.2. Products
- 12.1.6.3. Company Financials
- 12.1.6.4. SWOT Analysis
- 12.1.7 Hester Bioscience
- 12.1.7.1. Company Overview
- 12.1.7.2. Products
- 12.1.7.3. Company Financials
- 12.1.7.4. SWOT Analysis
- 12.1.8 Heska Corp
- 12.1.8.1. Company Overview
- 12.1.8.2. Products
- 12.1.8.3. Company Financials
- 12.1.8.4. SWOT Analysis
- 12.1.9 Ceva Sant Animale
- 12.1.9.1. Company Overview
- 12.1.9.2. Products
- 12.1.9.3. Company Financials
- 12.1.9.4. SWOT Analysis
- 12.1.10 Phibro Animal Health
- 12.1.10.1. Company Overview
- 12.1.10.2. Products
- 12.1.10.3. Company Financials
- 12.1.10.4. SWOT Analysis
- 12.1.11 Virbac
- 12.1.11.1. Company Overview
- 12.1.11.2. Products
- 12.1.11.3. Company Financials
- 12.1.11.4. SWOT Analysis
- 12.1.12 Merck Animal Health
- 12.1.12.1. Company Overview
- 12.1.12.2. Products
- 12.1.12.3. Company Financials
- 12.1.12.4. SWOT Analysis
- 12.1.1 Zoetis Services LLC
- 12.2. Market Entropy
- 12.2.1 Company's Key Areas Served
- 12.2.2 Recent Developments
- 12.3. Company Market Share Analysis 2025
- 12.3.1 Top 5 Companies Market Share Analysis
- 12.3.2 Top 3 Companies Market Share Analysis
- 12.4. List of Potential Customers
- 13. Research Methodology
List of Figures
- Figure 1: Global Veterinary Services Industry Revenue Breakdown (Million, %) by Region 2025 & 2033
- Figure 2: Global Veterinary Services Industry Volume Breakdown (K Unit, %) by Region 2025 & 2033
- Figure 3: North America Veterinary Services Industry Revenue (Million), by Animal Type 2025 & 2033
- Figure 4: North America Veterinary Services Industry Volume (K Unit), by Animal Type 2025 & 2033
- Figure 5: North America Veterinary Services Industry Revenue Share (%), by Animal Type 2025 & 2033
- Figure 6: North America Veterinary Services Industry Volume Share (%), by Animal Type 2025 & 2033
- Figure 7: North America Veterinary Services Industry Revenue (Million), by Type of Care 2025 & 2033
- Figure 8: North America Veterinary Services Industry Volume (K Unit), by Type of Care 2025 & 2033
- Figure 9: North America Veterinary Services Industry Revenue Share (%), by Type of Care 2025 & 2033
- Figure 10: North America Veterinary Services Industry Volume Share (%), by Type of Care 2025 & 2033
- Figure 11: North America Veterinary Services Industry Revenue (Million), by Country 2025 & 2033
- Figure 12: North America Veterinary Services Industry Volume (K Unit), by Country 2025 & 2033
- Figure 13: North America Veterinary Services Industry Revenue Share (%), by Country 2025 & 2033
- Figure 14: North America Veterinary Services Industry Volume Share (%), by Country 2025 & 2033
- Figure 15: Europe Veterinary Services Industry Revenue (Million), by Animal Type 2025 & 2033
- Figure 16: Europe Veterinary Services Industry Volume (K Unit), by Animal Type 2025 & 2033
- Figure 17: Europe Veterinary Services Industry Revenue Share (%), by Animal Type 2025 & 2033
- Figure 18: Europe Veterinary Services Industry Volume Share (%), by Animal Type 2025 & 2033
- Figure 19: Europe Veterinary Services Industry Revenue (Million), by Type of Care 2025 & 2033
- Figure 20: Europe Veterinary Services Industry Volume (K Unit), by Type of Care 2025 & 2033
- Figure 21: Europe Veterinary Services Industry Revenue Share (%), by Type of Care 2025 & 2033
- Figure 22: Europe Veterinary Services Industry Volume Share (%), by Type of Care 2025 & 2033
- Figure 23: Europe Veterinary Services Industry Revenue (Million), by Country 2025 & 2033
- Figure 24: Europe Veterinary Services Industry Volume (K Unit), by Country 2025 & 2033
- Figure 25: Europe Veterinary Services Industry Revenue Share (%), by Country 2025 & 2033
- Figure 26: Europe Veterinary Services Industry Volume Share (%), by Country 2025 & 2033
- Figure 27: Asia Pacific Veterinary Services Industry Revenue (Million), by Animal Type 2025 & 2033
- Figure 28: Asia Pacific Veterinary Services Industry Volume (K Unit), by Animal Type 2025 & 2033
- Figure 29: Asia Pacific Veterinary Services Industry Revenue Share (%), by Animal Type 2025 & 2033
- Figure 30: Asia Pacific Veterinary Services Industry Volume Share (%), by Animal Type 2025 & 2033
- Figure 31: Asia Pacific Veterinary Services Industry Revenue (Million), by Type of Care 2025 & 2033
- Figure 32: Asia Pacific Veterinary Services Industry Volume (K Unit), by Type of Care 2025 & 2033
- Figure 33: Asia Pacific Veterinary Services Industry Revenue Share (%), by Type of Care 2025 & 2033
- Figure 34: Asia Pacific Veterinary Services Industry Volume Share (%), by Type of Care 2025 & 2033
- Figure 35: Asia Pacific Veterinary Services Industry Revenue (Million), by Country 2025 & 2033
- Figure 36: Asia Pacific Veterinary Services Industry Volume (K Unit), by Country 2025 & 2033
- Figure 37: Asia Pacific Veterinary Services Industry Revenue Share (%), by Country 2025 & 2033
- Figure 38: Asia Pacific Veterinary Services Industry Volume Share (%), by Country 2025 & 2033
- Figure 39: Middle East and Africa Veterinary Services Industry Revenue (Million), by Animal Type 2025 & 2033
- Figure 40: Middle East and Africa Veterinary Services Industry Volume (K Unit), by Animal Type 2025 & 2033
- Figure 41: Middle East and Africa Veterinary Services Industry Revenue Share (%), by Animal Type 2025 & 2033
- Figure 42: Middle East and Africa Veterinary Services Industry Volume Share (%), by Animal Type 2025 & 2033
- Figure 43: Middle East and Africa Veterinary Services Industry Revenue (Million), by Type of Care 2025 & 2033
- Figure 44: Middle East and Africa Veterinary Services Industry Volume (K Unit), by Type of Care 2025 & 2033
- Figure 45: Middle East and Africa Veterinary Services Industry Revenue Share (%), by Type of Care 2025 & 2033
- Figure 46: Middle East and Africa Veterinary Services Industry Volume Share (%), by Type of Care 2025 & 2033
- Figure 47: Middle East and Africa Veterinary Services Industry Revenue (Million), by Country 2025 & 2033
- Figure 48: Middle East and Africa Veterinary Services Industry Volume (K Unit), by Country 2025 & 2033
- Figure 49: Middle East and Africa Veterinary Services Industry Revenue Share (%), by Country 2025 & 2033
- Figure 50: Middle East and Africa Veterinary Services Industry Volume Share (%), by Country 2025 & 2033
- Figure 51: South America Veterinary Services Industry Revenue (Million), by Animal Type 2025 & 2033
- Figure 52: South America Veterinary Services Industry Volume (K Unit), by Animal Type 2025 & 2033
- Figure 53: South America Veterinary Services Industry Revenue Share (%), by Animal Type 2025 & 2033
- Figure 54: South America Veterinary Services Industry Volume Share (%), by Animal Type 2025 & 2033
- Figure 55: South America Veterinary Services Industry Revenue (Million), by Type of Care 2025 & 2033
- Figure 56: South America Veterinary Services Industry Volume (K Unit), by Type of Care 2025 & 2033
- Figure 57: South America Veterinary Services Industry Revenue Share (%), by Type of Care 2025 & 2033
- Figure 58: South America Veterinary Services Industry Volume Share (%), by Type of Care 2025 & 2033
- Figure 59: South America Veterinary Services Industry Revenue (Million), by Country 2025 & 2033
- Figure 60: South America Veterinary Services Industry Volume (K Unit), by Country 2025 & 2033
- Figure 61: South America Veterinary Services Industry Revenue Share (%), by Country 2025 & 2033
- Figure 62: South America Veterinary Services Industry Volume Share (%), by Country 2025 & 2033
List of Tables
- Table 1: Global Veterinary Services Industry Revenue Million Forecast, by Animal Type 2020 & 2033
- Table 2: Global Veterinary Services Industry Volume K Unit Forecast, by Animal Type 2020 & 2033
- Table 3: Global Veterinary Services Industry Revenue Million Forecast, by Type of Care 2020 & 2033
- Table 4: Global Veterinary Services Industry Volume K Unit Forecast, by Type of Care 2020 & 2033
- Table 5: Global Veterinary Services Industry Revenue Million Forecast, by Region 2020 & 2033
- Table 6: Global Veterinary Services Industry Volume K Unit Forecast, by Region 2020 & 2033
- Table 7: Global Veterinary Services Industry Revenue Million Forecast, by Animal Type 2020 & 2033
- Table 8: Global Veterinary Services Industry Volume K Unit Forecast, by Animal Type 2020 & 2033
- Table 9: Global Veterinary Services Industry Revenue Million Forecast, by Type of Care 2020 & 2033
- Table 10: Global Veterinary Services Industry Volume K Unit Forecast, by Type of Care 2020 & 2033
- Table 11: Global Veterinary Services Industry Revenue Million Forecast, by Country 2020 & 2033
- Table 12: Global Veterinary Services Industry Volume K Unit Forecast, by Country 2020 & 2033
- Table 13: United States Veterinary Services Industry Revenue (Million) Forecast, by Application 2020 & 2033
- Table 14: United States Veterinary Services Industry Volume (K Unit) Forecast, by Application 2020 & 2033
- Table 15: Canada Veterinary Services Industry Revenue (Million) Forecast, by Application 2020 & 2033
- Table 16: Canada Veterinary Services Industry Volume (K Unit) Forecast, by Application 2020 & 2033
- Table 17: Mexico Veterinary Services Industry Revenue (Million) Forecast, by Application 2020 & 2033
- Table 18: Mexico Veterinary Services Industry Volume (K Unit) Forecast, by Application 2020 & 2033
- Table 19: Global Veterinary Services Industry Revenue Million Forecast, by Animal Type 2020 & 2033
- Table 20: Global Veterinary Services Industry Volume K Unit Forecast, by Animal Type 2020 & 2033
- Table 21: Global Veterinary Services Industry Revenue Million Forecast, by Type of Care 2020 & 2033
- Table 22: Global Veterinary Services Industry Volume K Unit Forecast, by Type of Care 2020 & 2033
- Table 23: Global Veterinary Services Industry Revenue Million Forecast, by Country 2020 & 2033
- Table 24: Global Veterinary Services Industry Volume K Unit Forecast, by Country 2020 & 2033
- Table 25: Germany Veterinary Services Industry Revenue (Million) Forecast, by Application 2020 & 2033
- Table 26: Germany Veterinary Services Industry Volume (K Unit) Forecast, by Application 2020 & 2033
- Table 27: United Kingdom Veterinary Services Industry Revenue (Million) Forecast, by Application 2020 & 2033
- Table 28: United Kingdom Veterinary Services Industry Volume (K Unit) Forecast, by Application 2020 & 2033
- Table 29: France Veterinary Services Industry Revenue (Million) Forecast, by Application 2020 & 2033
- Table 30: France Veterinary Services Industry Volume (K Unit) Forecast, by Application 2020 & 2033
- Table 31: Italy Veterinary Services Industry Revenue (Million) Forecast, by Application 2020 & 2033
- Table 32: Italy Veterinary Services Industry Volume (K Unit) Forecast, by Application 2020 & 2033
- Table 33: Spain Veterinary Services Industry Revenue (Million) Forecast, by Application 2020 & 2033
- Table 34: Spain Veterinary Services Industry Volume (K Unit) Forecast, by Application 2020 & 2033
- Table 35: Rest of Europe Veterinary Services Industry Revenue (Million) Forecast, by Application 2020 & 2033
- Table 36: Rest of Europe Veterinary Services Industry Volume (K Unit) Forecast, by Application 2020 & 2033
- Table 37: Global Veterinary Services Industry Revenue Million Forecast, by Animal Type 2020 & 2033
- Table 38: Global Veterinary Services Industry Volume K Unit Forecast, by Animal Type 2020 & 2033
- Table 39: Global Veterinary Services Industry Revenue Million Forecast, by Type of Care 2020 & 2033
- Table 40: Global Veterinary Services Industry Volume K Unit Forecast, by Type of Care 2020 & 2033
- Table 41: Global Veterinary Services Industry Revenue Million Forecast, by Country 2020 & 2033
- Table 42: Global Veterinary Services Industry Volume K Unit Forecast, by Country 2020 & 2033
- Table 43: China Veterinary Services Industry Revenue (Million) Forecast, by Application 2020 & 2033
- Table 44: China Veterinary Services Industry Volume (K Unit) Forecast, by Application 2020 & 2033
- Table 45: Japan Veterinary Services Industry Revenue (Million) Forecast, by Application 2020 & 2033
- Table 46: Japan Veterinary Services Industry Volume (K Unit) Forecast, by Application 2020 & 2033
- Table 47: India Veterinary Services Industry Revenue (Million) Forecast, by Application 2020 & 2033
- Table 48: India Veterinary Services Industry Volume (K Unit) Forecast, by Application 2020 & 2033
- Table 49: Australia Veterinary Services Industry Revenue (Million) Forecast, by Application 2020 & 2033
- Table 50: Australia Veterinary Services Industry Volume (K Unit) Forecast, by Application 2020 & 2033
- Table 51: South Korea Veterinary Services Industry Revenue (Million) Forecast, by Application 2020 & 2033
- Table 52: South Korea Veterinary Services Industry Volume (K Unit) Forecast, by Application 2020 & 2033
- Table 53: Rest of Asia Pacific Veterinary Services Industry Revenue (Million) Forecast, by Application 2020 & 2033
- Table 54: Rest of Asia Pacific Veterinary Services Industry Volume (K Unit) Forecast, by Application 2020 & 2033
- Table 55: Global Veterinary Services Industry Revenue Million Forecast, by Animal Type 2020 & 2033
- Table 56: Global Veterinary Services Industry Volume K Unit Forecast, by Animal Type 2020 & 2033
- Table 57: Global Veterinary Services Industry Revenue Million Forecast, by Type of Care 2020 & 2033
- Table 58: Global Veterinary Services Industry Volume K Unit Forecast, by Type of Care 2020 & 2033
- Table 59: Global Veterinary Services Industry Revenue Million Forecast, by Country 2020 & 2033
- Table 60: Global Veterinary Services Industry Volume K Unit Forecast, by Country 2020 & 2033
- Table 61: GCC Veterinary Services Industry Revenue (Million) Forecast, by Application 2020 & 2033
- Table 62: GCC Veterinary Services Industry Volume (K Unit) Forecast, by Application 2020 & 2033
- Table 63: South Africa Veterinary Services Industry Revenue (Million) Forecast, by Application 2020 & 2033
- Table 64: South Africa Veterinary Services Industry Volume (K Unit) Forecast, by Application 2020 & 2033
- Table 65: Rest of Middle East and Africa Veterinary Services Industry Revenue (Million) Forecast, by Application 2020 & 2033
- Table 66: Rest of Middle East and Africa Veterinary Services Industry Volume (K Unit) Forecast, by Application 2020 & 2033
- Table 67: Global Veterinary Services Industry Revenue Million Forecast, by Animal Type 2020 & 2033
- Table 68: Global Veterinary Services Industry Volume K Unit Forecast, by Animal Type 2020 & 2033
- Table 69: Global Veterinary Services Industry Revenue Million Forecast, by Type of Care 2020 & 2033
- Table 70: Global Veterinary Services Industry Volume K Unit Forecast, by Type of Care 2020 & 2033
- Table 71: Global Veterinary Services Industry Revenue Million Forecast, by Country 2020 & 2033
- Table 72: Global Veterinary Services Industry Volume K Unit Forecast, by Country 2020 & 2033
- Table 73: Brazil Veterinary Services Industry Revenue (Million) Forecast, by Application 2020 & 2033
- Table 74: Brazil Veterinary Services Industry Volume (K Unit) Forecast, by Application 2020 & 2033
- Table 75: Argentina Veterinary Services Industry Revenue (Million) Forecast, by Application 2020 & 2033
- Table 76: Argentina Veterinary Services Industry Volume (K Unit) Forecast, by Application 2020 & 2033
- Table 77: Rest of South America Veterinary Services Industry Revenue (Million) Forecast, by Application 2020 & 2033
- Table 78: Rest of South America Veterinary Services Industry Volume (K Unit) Forecast, by Application 2020 & 2033
Frequently Asked Questions
1. What is the projected Compound Annual Growth Rate (CAGR) of the Veterinary Services Industry?
The projected CAGR is approximately 5.59%.
2. Which companies are prominent players in the Veterinary Services Industry?
Key companies in the market include Zoetis Services LLC, Elanco, Boehringer Ingelheim GmbH, IDEXX Laboratories Inc, Indian Immunologicals Ltd, Vetoquinol S A, Hester Bioscience, Heska Corp, Ceva Sant Animale, Phibro Animal Health, Virbac, Merck Animal Health.
3. What are the main segments of the Veterinary Services Industry?
The market segments include Animal Type, Type of Care.
4. Can you provide details about the market size?
The market size is estimated to be USD 88.22 Million as of 2022.
5. What are some drivers contributing to market growth?
Rising Chronic Diseases and Awareness Regarding Veterinary Care; Increasing Initiatives by Governments and Animal Welfare Associations in Different Countries.
6. What are the notable trends driving market growth?
Companion Animal Segment is Expected to Hold Significant Market Share in the Market Over the Forecast Period.
7. Are there any restraints impacting market growth?
Increasing Costs of Animal Care Product and Veterinary Services.
8. Can you provide examples of recent developments in the market?
April 2022: Animalcare launched Plaqtiv+, a range of dental care products for cats and dogs designed to reduce calculus formation.
9. What pricing options are available for accessing the report?
Pricing options include single-user, multi-user, and enterprise licenses priced at USD 4750, USD 5250, and USD 8750 respectively.
10. Is the market size provided in terms of value or volume?
The market size is provided in terms of value, measured in Million and volume, measured in K Unit.
11. Are there any specific market keywords associated with the report?
Yes, the market keyword associated with the report is "Veterinary Services Industry," which aids in identifying and referencing the specific market segment covered.
12. How do I determine which pricing option suits my needs best?
The pricing options vary based on user requirements and access needs. Individual users may opt for single-user licenses, while businesses requiring broader access may choose multi-user or enterprise licenses for cost-effective access to the report.
13. Are there any additional resources or data provided in the Veterinary Services Industry report?
While the report offers comprehensive insights, it's advisable to review the specific contents or supplementary materials provided to ascertain if additional resources or data are available.
14. How can I stay updated on further developments or reports in the Veterinary Services Industry?
To stay informed about further developments, trends, and reports in the Veterinary Services Industry, consider subscribing to industry newsletters, following relevant companies and organizations, or regularly checking reputable industry news sources and publications.
Methodology
Step 1 - Identification of Relevant Samples Size from Population Database


Step 2 - Approaches for Defining Global Market Size (Value, Volume* & Price*)

Note*: In applicable scenarios
Step 3 - Data Sources
Primary Research
- Web Analytics
- Survey Reports
- Research Institute
- Latest Research Reports
- Opinion Leaders
Secondary Research
- Annual Reports
- White Paper
- Latest Press Release
- Industry Association
- Paid Database
- Investor Presentations

Step 4 - Data Triangulation
Involves using different sources of information in order to increase the validity of a study
These sources are likely to be stakeholders in a program - participants, other researchers, program staff, other community members, and so on.
Then we put all data in single framework & apply various statistical tools to find out the dynamic on the market.
During the analysis stage, feedback from the stakeholder groups would be compared to determine areas of agreement as well as areas of divergence