

Key Insights
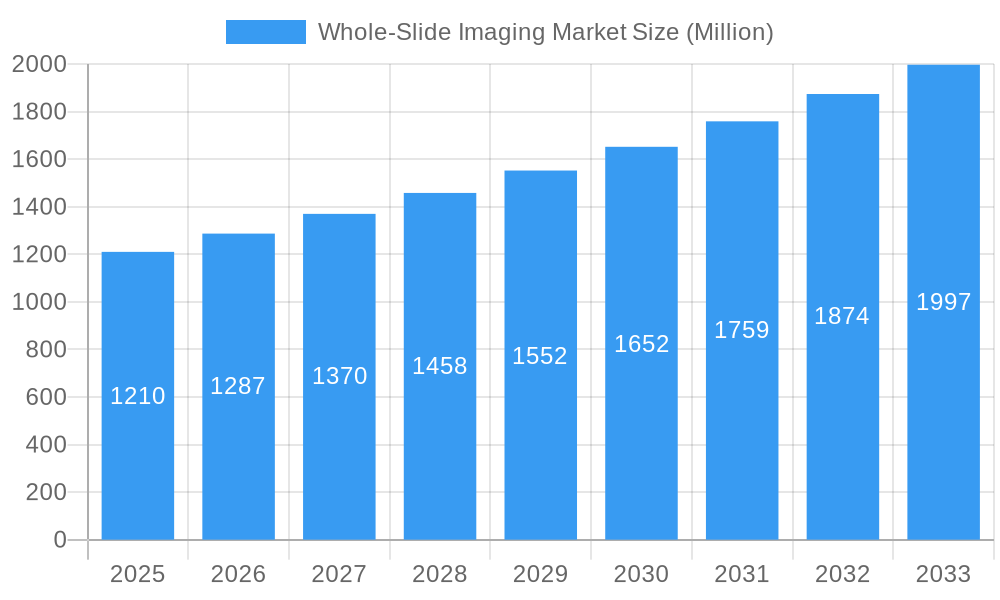
The global Whole-Slide Imaging (WSI) market is poised for robust expansion, projected to reach approximately USD 1.21 billion. This growth is fueled by a Compound Annual Growth Rate (CAGR) of 6.39% from the historical period of 2019-2024 through the forecast period of 2025-2033. A significant driver for this upward trajectory is the increasing adoption of digital pathology solutions across various healthcare and research settings. The ability of WSI to enhance diagnostic accuracy, facilitate remote consultation, and streamline workflow efficiency is paramount. Furthermore, the escalating prevalence of chronic diseases and the growing demand for personalized medicine are creating a substantial need for advanced imaging and analysis tools, directly benefiting the WSI market. Technological advancements in scanner resolution, image processing software, and AI-driven analytical capabilities are also contributing to market expansion, enabling more sophisticated applications.
Whole-Slide Imaging Market Market Size (In Billion)
The WSI market is characterized by a diverse range of applications and end-users. Telepathology and cytopathology represent key application segments, leveraging WSI for remote diagnostics and improved specimen analysis. Immunohistochemistry and hematopathology are also significant areas of adoption, where detailed visualization and quantification are crucial. Academic institutions and research facilities are primary end-users, utilizing WSI for groundbreaking studies and educational purposes. The market is also seeing increased penetration into clinical diagnostic settings. Geographically, North America and Europe currently lead the market, driven by advanced healthcare infrastructure and early adoption of digital technologies. However, the Asia Pacific region is expected to witness the fastest growth due to increasing healthcare investments and a burgeoning research landscape. Restraints include the high initial cost of implementation and the need for robust IT infrastructure, though these are being mitigated by cloud-based solutions and evolving pricing models.
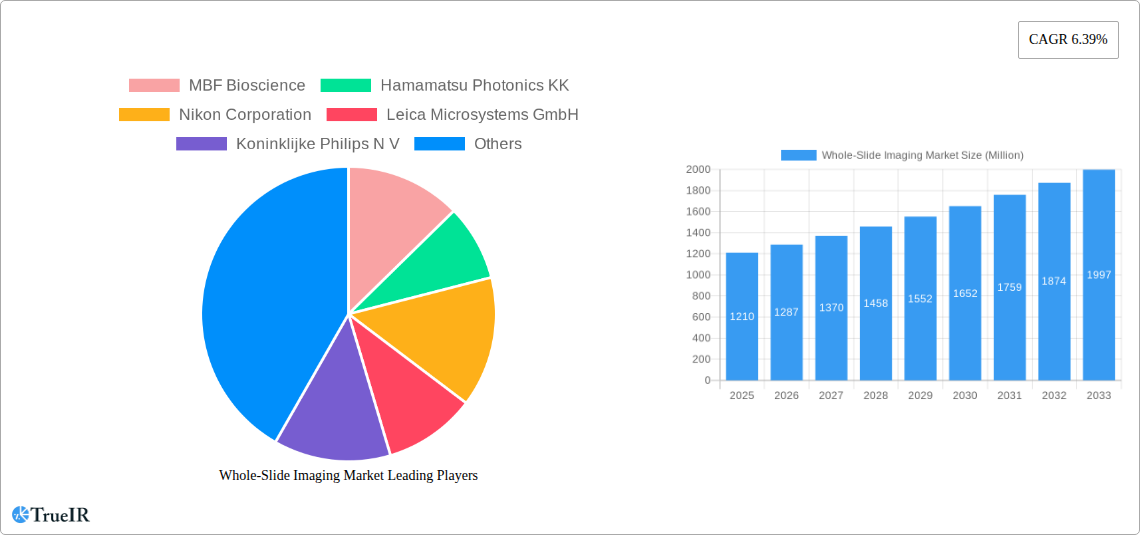
Whole-Slide Imaging Market Company Market Share
Whole-Slide Imaging Market: Comprehensive Analysis and Future Outlook (2019-2033)
This in-depth report provides a comprehensive analysis of the global Whole-Slide Imaging (WSI) market, covering market structure, trends, opportunities, dominant segments, product innovations, key drivers, challenges, leading players, significant industry milestones, and future outlook. The study encompasses the historical period from 2019 to 2024, with a base year of 2025 and a forecast period extending to 2033, offering valuable insights for stakeholders seeking to understand and capitalize on the rapidly evolving digital pathology landscape. The total market size is projected to reach $7,250 Million by 2033, with a CAGR of 12.5% during the forecast period.
Whole-Slide Imaging Market Market Structure & Competitive Landscape
The Whole-Slide Imaging market is characterized by a moderately consolidated structure, with a blend of established players and emerging innovators. Key innovation drivers include advancements in scanner resolution, AI-powered image analysis algorithms, and cloud-based image management systems. Regulatory impacts, particularly from bodies like the FDA and EMA, are significant, influencing product approvals and market access for diagnostic applications. Product substitutes, while evolving, primarily revolve around traditional microscopy, though the clear advantages of digital pathology in terms of accessibility, collaboration, and data analysis are driving WSI adoption.
The end-user segmentation reveals a strong presence of academic and research institutions, driving early adoption and validation of WSI technologies. However, a significant shift towards clinical diagnostics and wider adoption by hospitals and independent diagnostic laboratories is a dominant trend. Merger and acquisition (M&A) activity is expected to increase as larger players seek to consolidate market share, acquire novel technologies, and expand their product portfolios. Historically, M&A volumes have been modest but are projected to rise by approximately 15% year-on-year during the forecast period. Concentration ratios are estimated to be around 45-55% held by the top five players, indicating room for competitive maneuvering.
Whole-Slide Imaging Market Market Trends & Opportunities
The Whole-Slide Imaging market is experiencing a transformative growth phase, driven by an increasing demand for efficient, accurate, and accessible pathology diagnostics. The global market size, estimated at $3,850 Million in 2025, is projected to witness robust expansion throughout the forecast period. This growth is underpinned by several critical trends, including the relentless march of technological innovation, evolving consumer preferences towards digital solutions, and a dynamic competitive landscape.
Technological advancements are at the forefront of this market expansion. Scanner manufacturers are continuously improving resolution, speed, and automation, enabling the capture of high-quality whole slide images with unprecedented detail and efficiency. The integration of Artificial Intelligence (AI) and machine learning algorithms is revolutionizing image analysis, offering powerful tools for automated cell counting, disease grading, biomarker quantification, and early detection of pathological abnormalities. This AI integration is a key driver for enhanced diagnostic accuracy and reduced turnaround times.
Consumer preferences are increasingly leaning towards digital solutions that offer greater accessibility, collaboration, and data management capabilities. Pathologists and researchers are seeking platforms that facilitate remote consultation, seamless sharing of images, and integration with existing laboratory information systems (LIS) and electronic health records (EHRs). The convenience of accessing and analyzing digital slides from anywhere, at any time, is a significant catalyst for adoption, especially in regions with limited access to specialized pathology expertise.
The competitive dynamics within the WSI market are intensifying. Established players are investing heavily in R&D to maintain their market leadership, while new entrants are challenging the status quo with disruptive technologies and novel business models. This competitive fervor is fostering a climate of innovation, leading to the development of more sophisticated and user-friendly WSI solutions. The market penetration rate for WSI in diagnostic settings is currently estimated at 28%, with significant potential for growth as adoption barriers are addressed and the benefits of digital pathology become more widely recognized. The increasing focus on personalized medicine and targeted therapies also fuels the demand for advanced image analysis capabilities offered by WSI. The market opportunity lies in developing integrated solutions that encompass scanning, image management, analysis, and reporting, catering to the diverse needs of academic research, clinical diagnostics, and pharmaceutical drug discovery. The global market is projected to reach $7,250 Million by 2033, exhibiting a Compound Annual Growth Rate (CAGR) of 12.5%.
Dominant Markets & Segments in Whole-Slide Imaging Market
The Whole-Slide Imaging market exhibits a clear dominance in certain regions and segments, driven by a confluence of factors including robust healthcare infrastructure, favorable regulatory environments, and significant investments in research and development. North America, particularly the United States, stands out as a leading region due to its advanced healthcare system, high adoption rates of new technologies, and substantial funding for biomedical research. Europe follows closely, with countries like Germany, the UK, and France showing strong market penetration driven by government initiatives and a well-established network of research institutions and hospitals. The Asia-Pacific region, led by China and Japan, is emerging as a rapidly growing market, fueled by increasing healthcare expenditure, a burgeoning patient population, and a growing emphasis on digital transformation in healthcare.
Within the Technology segmentation, Scanners represent the foundational component and a significant revenue driver, with continuous innovation in speed, resolution, and automation. The market for IT Infrastructure, including cloud storage and high-performance computing, is also expanding rapidly to accommodate the massive datasets generated by WSI. Viewer software plays a crucial role in enabling efficient image navigation and analysis, while Image Management Systems are becoming increasingly sophisticated, offering advanced features for archiving, retrieval, and integration.
In terms of Application, Telepathology is a major growth engine, facilitating remote consultations, second opinions, and expert second reads, thereby improving access to specialized pathology services, particularly in underserved areas. Cytopathology and Immunohistochemistry applications are also experiencing substantial growth, driven by the need for precise quantification and analysis of cellular and molecular markers for diagnosis and treatment selection. Hematopathology applications continue to be a strong segment, with WSI offering significant advantages in the detailed examination of blood and bone marrow specimens.
The End User landscape highlights the dominance of Academic Institutes and Research facilities as early adopters and key drivers of innovation. These entities leverage WSI for groundbreaking research, drug discovery, and the development of novel diagnostic algorithms. However, the segment of Others, which includes hospitals, diagnostic laboratories, and pharmaceutical companies, is demonstrating the fastest growth. This surge is attributed to the increasing clinical integration of digital pathology, the demand for improved workflow efficiency, and the growing adoption of WSI for routine diagnostic purposes and clinical trials. The increasing implementation of standardized protocols and reimbursement policies for digital pathology services further fuels the expansion of these segments.
Whole-Slide Imaging Market Product Analysis
Product innovations in the Whole-Slide Imaging market are primarily focused on enhancing scanning speed, improving image resolution, and integrating advanced AI-powered analysis capabilities. Manufacturers are developing scanners capable of high-throughput processing, reducing turnaround times significantly. The advent of computational pathology algorithms provides powerful tools for automated detection, quantification, and classification of various cellular structures and biomarkers, offering objective and reproducible diagnostic insights. Competitive advantages lie in the seamless integration of scanning hardware, intuitive software platforms for image viewing and analysis, and robust data management solutions that ensure data integrity and security. The market fit is being optimized for both research and clinical diagnostic applications, with a growing emphasis on user-friendly interfaces and interoperability with existing healthcare IT systems.
Key Drivers, Barriers & Challenges in Whole-Slide Imaging Market
Key Drivers, Barriers & Challenges in Whole-Slide Imaging Market
Key Drivers:
- Technological Advancements: Continuous improvements in scanner technology, AI-driven image analysis algorithms, and cloud computing are enhancing accuracy, speed, and efficiency in pathology.
- Growing Demand for Precision Medicine: WSI enables detailed analysis of biomarkers, crucial for personalized treatment strategies in oncology and other diseases.
- Increasing Adoption in Clinical Diagnostics: Hospitals and labs are increasingly adopting WSI for routine diagnoses, improving workflow and collaboration.
- Need for Improved Pathology Workflow Efficiency: Digital pathology solutions streamline sample handling, reduce manual errors, and accelerate turnaround times.
- Expansion of Telemedicine and Remote Consultation: WSI facilitates remote access to pathology expertise, bridging geographical gaps.
Barriers & Challenges:
- High Initial Investment Costs: The purchase of WSI scanners and associated IT infrastructure can be substantial for smaller institutions.
- Regulatory Hurdles and Standardization: Obtaining regulatory approvals for diagnostic use and establishing standardized digital pathology workflows remain complex.
- Data Storage and Management: The large file sizes of whole slide images necessitate robust and scalable data storage and management solutions.
- Integration with Existing IT Systems: Seamless integration of WSI platforms with existing Laboratory Information Systems (LIS) and Electronic Health Records (EHRs) can be challenging.
- Pathologist Training and Workflow Adaptation: Pathologists require training to effectively utilize digital pathology tools and adapt to new workflows.
- Interoperability and Data Exchange: Ensuring interoperability between different WSI systems and facilitating secure data exchange are ongoing challenges. The market faces a potential 20% slowdown in adoption if interoperability issues are not effectively addressed.
Growth Drivers in the Whole-Slide Imaging Market Market
The Whole-Slide Imaging market is propelled by several key growth drivers. Technologically, the continuous enhancement of scanner resolution, scanning speed, and the development of sophisticated AI algorithms for image analysis are paramount. The increasing focus on precision medicine and targeted therapies necessitates the granular analysis of tissue samples, a capability that WSI excels at. Economically, growing healthcare expenditures globally and the potential for cost savings through streamlined workflows and reduced manual errors contribute to market expansion. Regulatory bodies are increasingly supporting the adoption of digital pathology for diagnostic purposes, further fueling growth. For instance, recent FDA approvals for digital pathology devices signal a favorable policy environment. The expanding demand for telepathology services, particularly in emerging economies, also presents a significant growth opportunity.
Challenges Impacting Whole-Slide Imaging Market Growth
Despite its promising trajectory, the Whole-Slide Imaging market faces several challenges. Regulatory complexities and the need for standardized validation protocols can slow down the adoption of WSI for diagnostic use. Supply chain issues, though currently minimal, could emerge with increased global demand for specialized hardware. Competitive pressures are intensifying, leading to a need for continuous innovation and differentiation. The significant initial investment required for WSI systems can be a substantial barrier for smaller healthcare providers. Furthermore, the massive data generated by whole slide images poses challenges for storage, management, and secure sharing, requiring robust IT infrastructure and cybersecurity measures. The market could experience a 10-15% impact on growth if these data management challenges are not adequately addressed.
Key Players Shaping the Whole-Slide Imaging Market Market
- MBF Bioscience
- Hamamatsu Photonics KK
- Nikon Corporation
- Leica Microsystems GmbH
- Koninklijke Philips N V
- 3Dhistech
- Visiopharm
- Indica Labs
- Molecular Machines & Industries
- Mikroscan Technologies Inc
- Olympus Corporation
- Akoya Biosciences
Significant Whole-Slide Imaging Market Industry Milestones
- March 2023: Pramana, Inc. collaborated with PathPresenter to accelerate the enterprise adoption of digital pathology workflows, aiming for a seamless user experience for their Digital Pathology as a Service solution and PathPresenter's image management/viewing platform.
- March 2023: Hamamatsu entered into a multi-year distribution agreement with Siemens Healthineers, likely to provide NanoZoomer whole slide scanners to support Siemens Healthineers' digital pathology expansion in the Americas and Europe.
Future Outlook for Whole-Slide Imaging Market Market
The future outlook for the Whole-Slide Imaging market is exceptionally bright, driven by the accelerating digital transformation in healthcare. Key growth catalysts include the expanding role of AI in pathology for automated diagnostics and drug discovery, the continued drive towards precision medicine, and the increasing integration of digital pathology into routine clinical workflows. Strategic opportunities lie in developing end-to-end digital pathology solutions that encompass hardware, software, cloud infrastructure, and AI analytics. The market potential is further amplified by the growing adoption in emerging economies, where WSI can address critical gaps in healthcare access and expertise. The market is poised for sustained growth, with increasing collaboration between technology providers, healthcare institutions, and regulatory bodies to unlock the full potential of digital pathology.
Whole-Slide Imaging Market Segmentation
-
1. Technology
- 1.1. Scanners
- 1.2. IT Infrastructure
- 1.3. Viewer
- 1.4. Image Management System
-
2. Application
- 2.1. Telepathology
- 2.2. Cytopathology
- 2.3. Immunohistochemistry
- 2.4. Hematopathology
-
3. End User
- 3.1. Academic Institute
- 3.2. Research
- 3.3. Others
Whole-Slide Imaging Market Segmentation By Geography
-
1. North America
- 1.1. United States
- 1.2. Canada
- 1.3. Mexico
-
2. Europe
- 2.1. Germany
- 2.2. United Kingdom
- 2.3. France
- 2.4. Italy
- 2.5. Spain
- 2.6. Rest of Europe
-
3. Asia Pacific
- 3.1. China
- 3.2. Japan
- 3.3. India
- 3.4. Australia
- 3.5. South korea
- 3.6. Rest of Asia Pacific
-
4. Middle East and Africa
- 4.1. GCC
- 4.2. South Africa
- 4.3. Rest of Middle East and Africa
-
5. South America
- 5.1. Brazil
- 5.2. Argentina
- 5.3. Rest of South America
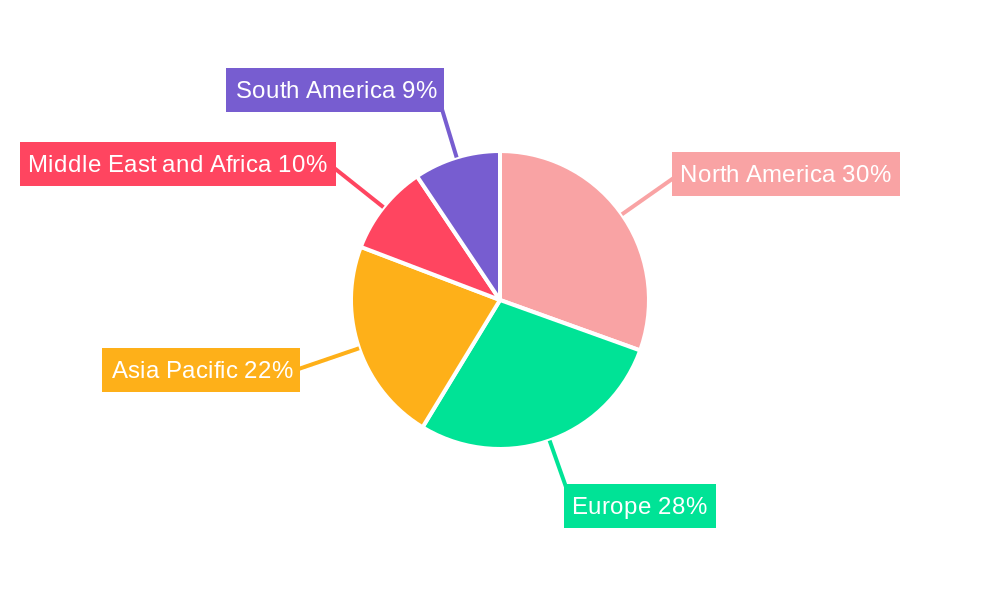
Whole-Slide Imaging Market Regional Market Share
Geographic Coverage of Whole-Slide Imaging Market
Whole-Slide Imaging Market REPORT HIGHLIGHTS
| Aspects | Details |
|---|---|
| Study Period | 2020-2034 |
| Base Year | 2025 |
| Estimated Year | 2026 |
| Forecast Period | 2026-2034 |
| Historical Period | 2020-2025 |
| Growth Rate | CAGR of 6.39% from 2020-2034 |
| Segmentation |
|
Table of Contents
- 1. Introduction
- 1.1. Research Scope
- 1.2. Market Segmentation
- 1.3. Research Objective
- 1.4. Definitions and Assumptions
- 2. Executive Summary
- 2.1. Market Snapshot
- 3. Market Dynamics
- 3.1. Market Drivers
- 3.2. Market Restrains
- 3.3. Market Trends
- 3.4. Market Opportunities
- 4. Market Factor Analysis
- 4.1. Porters Five Forces
- 4.1.1. Bargaining Power of Suppliers
- 4.1.2. Bargaining Power of Buyers
- 4.1.3. Threat of New Entrants
- 4.1.4. Threat of Substitutes
- 4.1.5. Competitive Rivalry
- 4.2. PESTEL analysis
- 4.3. BCG Analysis
- 4.3.1. Stars (High Growth, High Market Share)
- 4.3.2. Cash Cows (Low Growth, High Market Share)
- 4.3.3. Question Mark (High Growth, Low Market Share)
- 4.3.4. Dogs (Low Growth, Low Market Share)
- 4.4. Ansoff Matrix Analysis
- 4.5. Supply Chain Analysis
- 4.6. Regulatory Landscape
- 4.7. Current Market Potential and Opportunity Assessment (TAM–SAM–SOM Framework)
- 4.8. TIR Analyst Note
- 4.1. Porters Five Forces
- 5. Market Analysis, Insights and Forecast 2021-2033
- 5.1. Market Analysis, Insights and Forecast - by Technology
- 5.1.1. Scanners
- 5.1.2. IT Infrastructure
- 5.1.3. Viewer
- 5.1.4. Image Management System
- 5.2. Market Analysis, Insights and Forecast - by Application
- 5.2.1. Telepathology
- 5.2.2. Cytopathology
- 5.2.3. Immunohistochemistry
- 5.2.4. Hematopathology
- 5.3. Market Analysis, Insights and Forecast - by End User
- 5.3.1. Academic Institute
- 5.3.2. Research
- 5.3.3. Others
- 5.4. Market Analysis, Insights and Forecast - by Region
- 5.4.1. North America
- 5.4.2. Europe
- 5.4.3. Asia Pacific
- 5.4.4. Middle East and Africa
- 5.4.5. South America
- 5.1. Market Analysis, Insights and Forecast - by Technology
- 6. Global Whole-Slide Imaging Market Analysis, Insights and Forecast, 2021-2033
- 6.1. Market Analysis, Insights and Forecast - by Technology
- 6.1.1. Scanners
- 6.1.2. IT Infrastructure
- 6.1.3. Viewer
- 6.1.4. Image Management System
- 6.2. Market Analysis, Insights and Forecast - by Application
- 6.2.1. Telepathology
- 6.2.2. Cytopathology
- 6.2.3. Immunohistochemistry
- 6.2.4. Hematopathology
- 6.3. Market Analysis, Insights and Forecast - by End User
- 6.3.1. Academic Institute
- 6.3.2. Research
- 6.3.3. Others
- 6.1. Market Analysis, Insights and Forecast - by Technology
- 7. North America Whole-Slide Imaging Market Analysis, Insights and Forecast, 2020-2032
- 7.1. Market Analysis, Insights and Forecast - by Technology
- 7.1.1. Scanners
- 7.1.2. IT Infrastructure
- 7.1.3. Viewer
- 7.1.4. Image Management System
- 7.2. Market Analysis, Insights and Forecast - by Application
- 7.2.1. Telepathology
- 7.2.2. Cytopathology
- 7.2.3. Immunohistochemistry
- 7.2.4. Hematopathology
- 7.3. Market Analysis, Insights and Forecast - by End User
- 7.3.1. Academic Institute
- 7.3.2. Research
- 7.3.3. Others
- 7.1. Market Analysis, Insights and Forecast - by Technology
- 8. Europe Whole-Slide Imaging Market Analysis, Insights and Forecast, 2020-2032
- 8.1. Market Analysis, Insights and Forecast - by Technology
- 8.1.1. Scanners
- 8.1.2. IT Infrastructure
- 8.1.3. Viewer
- 8.1.4. Image Management System
- 8.2. Market Analysis, Insights and Forecast - by Application
- 8.2.1. Telepathology
- 8.2.2. Cytopathology
- 8.2.3. Immunohistochemistry
- 8.2.4. Hematopathology
- 8.3. Market Analysis, Insights and Forecast - by End User
- 8.3.1. Academic Institute
- 8.3.2. Research
- 8.3.3. Others
- 8.1. Market Analysis, Insights and Forecast - by Technology
- 9. Asia Pacific Whole-Slide Imaging Market Analysis, Insights and Forecast, 2020-2032
- 9.1. Market Analysis, Insights and Forecast - by Technology
- 9.1.1. Scanners
- 9.1.2. IT Infrastructure
- 9.1.3. Viewer
- 9.1.4. Image Management System
- 9.2. Market Analysis, Insights and Forecast - by Application
- 9.2.1. Telepathology
- 9.2.2. Cytopathology
- 9.2.3. Immunohistochemistry
- 9.2.4. Hematopathology
- 9.3. Market Analysis, Insights and Forecast - by End User
- 9.3.1. Academic Institute
- 9.3.2. Research
- 9.3.3. Others
- 9.1. Market Analysis, Insights and Forecast - by Technology
- 10. Middle East and Africa Whole-Slide Imaging Market Analysis, Insights and Forecast, 2020-2032
- 10.1. Market Analysis, Insights and Forecast - by Technology
- 10.1.1. Scanners
- 10.1.2. IT Infrastructure
- 10.1.3. Viewer
- 10.1.4. Image Management System
- 10.2. Market Analysis, Insights and Forecast - by Application
- 10.2.1. Telepathology
- 10.2.2. Cytopathology
- 10.2.3. Immunohistochemistry
- 10.2.4. Hematopathology
- 10.3. Market Analysis, Insights and Forecast - by End User
- 10.3.1. Academic Institute
- 10.3.2. Research
- 10.3.3. Others
- 10.1. Market Analysis, Insights and Forecast - by Technology
- 11. South America Whole-Slide Imaging Market Analysis, Insights and Forecast, 2020-2032
- 11.1. Market Analysis, Insights and Forecast - by Technology
- 11.1.1. Scanners
- 11.1.2. IT Infrastructure
- 11.1.3. Viewer
- 11.1.4. Image Management System
- 11.2. Market Analysis, Insights and Forecast - by Application
- 11.2.1. Telepathology
- 11.2.2. Cytopathology
- 11.2.3. Immunohistochemistry
- 11.2.4. Hematopathology
- 11.3. Market Analysis, Insights and Forecast - by End User
- 11.3.1. Academic Institute
- 11.3.2. Research
- 11.3.3. Others
- 11.1. Market Analysis, Insights and Forecast - by Technology
- 12. Competitive Analysis
- 12.1. Company Profiles
- 12.1.1 MBF Bioscience
- 12.1.1.1. Company Overview
- 12.1.1.2. Products
- 12.1.1.3. Company Financials
- 12.1.1.4. SWOT Analysis
- 12.1.2 Hamamatsu Photonics KK
- 12.1.2.1. Company Overview
- 12.1.2.2. Products
- 12.1.2.3. Company Financials
- 12.1.2.4. SWOT Analysis
- 12.1.3 Nikon Corporation
- 12.1.3.1. Company Overview
- 12.1.3.2. Products
- 12.1.3.3. Company Financials
- 12.1.3.4. SWOT Analysis
- 12.1.4 Leica Microsystems GmbH
- 12.1.4.1. Company Overview
- 12.1.4.2. Products
- 12.1.4.3. Company Financials
- 12.1.4.4. SWOT Analysis
- 12.1.5 Koninklijke Philips N V
- 12.1.5.1. Company Overview
- 12.1.5.2. Products
- 12.1.5.3. Company Financials
- 12.1.5.4. SWOT Analysis
- 12.1.6 3Dhistech
- 12.1.6.1. Company Overview
- 12.1.6.2. Products
- 12.1.6.3. Company Financials
- 12.1.6.4. SWOT Analysis
- 12.1.7 Visiopharm
- 12.1.7.1. Company Overview
- 12.1.7.2. Products
- 12.1.7.3. Company Financials
- 12.1.7.4. SWOT Analysis
- 12.1.8 Indica Labs
- 12.1.8.1. Company Overview
- 12.1.8.2. Products
- 12.1.8.3. Company Financials
- 12.1.8.4. SWOT Analysis
- 12.1.9 Molecular Machines & Industries
- 12.1.9.1. Company Overview
- 12.1.9.2. Products
- 12.1.9.3. Company Financials
- 12.1.9.4. SWOT Analysis
- 12.1.10 Mikroscan Technologies Inc
- 12.1.10.1. Company Overview
- 12.1.10.2. Products
- 12.1.10.3. Company Financials
- 12.1.10.4. SWOT Analysis
- 12.1.11 Olympus Corporation
- 12.1.11.1. Company Overview
- 12.1.11.2. Products
- 12.1.11.3. Company Financials
- 12.1.11.4. SWOT Analysis
- 12.1.12 Akoya Biosciences
- 12.1.12.1. Company Overview
- 12.1.12.2. Products
- 12.1.12.3. Company Financials
- 12.1.12.4. SWOT Analysis
- 12.1.1 MBF Bioscience
- 12.2. Market Entropy
- 12.2.1 Company's Key Areas Served
- 12.2.2 Recent Developments
- 12.3. Company Market Share Analysis 2025
- 12.3.1 Top 5 Companies Market Share Analysis
- 12.3.2 Top 3 Companies Market Share Analysis
- 12.4. List of Potential Customers
- 13. Research Methodology
List of Figures
- Figure 1: Global Whole-Slide Imaging Market Revenue Breakdown (Million, %) by Region 2025 & 2033
- Figure 2: Global Whole-Slide Imaging Market Volume Breakdown (K Unit, %) by Region 2025 & 2033
- Figure 3: North America Whole-Slide Imaging Market Revenue (Million), by Technology 2025 & 2033
- Figure 4: North America Whole-Slide Imaging Market Volume (K Unit), by Technology 2025 & 2033
- Figure 5: North America Whole-Slide Imaging Market Revenue Share (%), by Technology 2025 & 2033
- Figure 6: North America Whole-Slide Imaging Market Volume Share (%), by Technology 2025 & 2033
- Figure 7: North America Whole-Slide Imaging Market Revenue (Million), by Application 2025 & 2033
- Figure 8: North America Whole-Slide Imaging Market Volume (K Unit), by Application 2025 & 2033
- Figure 9: North America Whole-Slide Imaging Market Revenue Share (%), by Application 2025 & 2033
- Figure 10: North America Whole-Slide Imaging Market Volume Share (%), by Application 2025 & 2033
- Figure 11: North America Whole-Slide Imaging Market Revenue (Million), by End User 2025 & 2033
- Figure 12: North America Whole-Slide Imaging Market Volume (K Unit), by End User 2025 & 2033
- Figure 13: North America Whole-Slide Imaging Market Revenue Share (%), by End User 2025 & 2033
- Figure 14: North America Whole-Slide Imaging Market Volume Share (%), by End User 2025 & 2033
- Figure 15: North America Whole-Slide Imaging Market Revenue (Million), by Country 2025 & 2033
- Figure 16: North America Whole-Slide Imaging Market Volume (K Unit), by Country 2025 & 2033
- Figure 17: North America Whole-Slide Imaging Market Revenue Share (%), by Country 2025 & 2033
- Figure 18: North America Whole-Slide Imaging Market Volume Share (%), by Country 2025 & 2033
- Figure 19: Europe Whole-Slide Imaging Market Revenue (Million), by Technology 2025 & 2033
- Figure 20: Europe Whole-Slide Imaging Market Volume (K Unit), by Technology 2025 & 2033
- Figure 21: Europe Whole-Slide Imaging Market Revenue Share (%), by Technology 2025 & 2033
- Figure 22: Europe Whole-Slide Imaging Market Volume Share (%), by Technology 2025 & 2033
- Figure 23: Europe Whole-Slide Imaging Market Revenue (Million), by Application 2025 & 2033
- Figure 24: Europe Whole-Slide Imaging Market Volume (K Unit), by Application 2025 & 2033
- Figure 25: Europe Whole-Slide Imaging Market Revenue Share (%), by Application 2025 & 2033
- Figure 26: Europe Whole-Slide Imaging Market Volume Share (%), by Application 2025 & 2033
- Figure 27: Europe Whole-Slide Imaging Market Revenue (Million), by End User 2025 & 2033
- Figure 28: Europe Whole-Slide Imaging Market Volume (K Unit), by End User 2025 & 2033
- Figure 29: Europe Whole-Slide Imaging Market Revenue Share (%), by End User 2025 & 2033
- Figure 30: Europe Whole-Slide Imaging Market Volume Share (%), by End User 2025 & 2033
- Figure 31: Europe Whole-Slide Imaging Market Revenue (Million), by Country 2025 & 2033
- Figure 32: Europe Whole-Slide Imaging Market Volume (K Unit), by Country 2025 & 2033
- Figure 33: Europe Whole-Slide Imaging Market Revenue Share (%), by Country 2025 & 2033
- Figure 34: Europe Whole-Slide Imaging Market Volume Share (%), by Country 2025 & 2033
- Figure 35: Asia Pacific Whole-Slide Imaging Market Revenue (Million), by Technology 2025 & 2033
- Figure 36: Asia Pacific Whole-Slide Imaging Market Volume (K Unit), by Technology 2025 & 2033
- Figure 37: Asia Pacific Whole-Slide Imaging Market Revenue Share (%), by Technology 2025 & 2033
- Figure 38: Asia Pacific Whole-Slide Imaging Market Volume Share (%), by Technology 2025 & 2033
- Figure 39: Asia Pacific Whole-Slide Imaging Market Revenue (Million), by Application 2025 & 2033
- Figure 40: Asia Pacific Whole-Slide Imaging Market Volume (K Unit), by Application 2025 & 2033
- Figure 41: Asia Pacific Whole-Slide Imaging Market Revenue Share (%), by Application 2025 & 2033
- Figure 42: Asia Pacific Whole-Slide Imaging Market Volume Share (%), by Application 2025 & 2033
- Figure 43: Asia Pacific Whole-Slide Imaging Market Revenue (Million), by End User 2025 & 2033
- Figure 44: Asia Pacific Whole-Slide Imaging Market Volume (K Unit), by End User 2025 & 2033
- Figure 45: Asia Pacific Whole-Slide Imaging Market Revenue Share (%), by End User 2025 & 2033
- Figure 46: Asia Pacific Whole-Slide Imaging Market Volume Share (%), by End User 2025 & 2033
- Figure 47: Asia Pacific Whole-Slide Imaging Market Revenue (Million), by Country 2025 & 2033
- Figure 48: Asia Pacific Whole-Slide Imaging Market Volume (K Unit), by Country 2025 & 2033
- Figure 49: Asia Pacific Whole-Slide Imaging Market Revenue Share (%), by Country 2025 & 2033
- Figure 50: Asia Pacific Whole-Slide Imaging Market Volume Share (%), by Country 2025 & 2033
- Figure 51: Middle East and Africa Whole-Slide Imaging Market Revenue (Million), by Technology 2025 & 2033
- Figure 52: Middle East and Africa Whole-Slide Imaging Market Volume (K Unit), by Technology 2025 & 2033
- Figure 53: Middle East and Africa Whole-Slide Imaging Market Revenue Share (%), by Technology 2025 & 2033
- Figure 54: Middle East and Africa Whole-Slide Imaging Market Volume Share (%), by Technology 2025 & 2033
- Figure 55: Middle East and Africa Whole-Slide Imaging Market Revenue (Million), by Application 2025 & 2033
- Figure 56: Middle East and Africa Whole-Slide Imaging Market Volume (K Unit), by Application 2025 & 2033
- Figure 57: Middle East and Africa Whole-Slide Imaging Market Revenue Share (%), by Application 2025 & 2033
- Figure 58: Middle East and Africa Whole-Slide Imaging Market Volume Share (%), by Application 2025 & 2033
- Figure 59: Middle East and Africa Whole-Slide Imaging Market Revenue (Million), by End User 2025 & 2033
- Figure 60: Middle East and Africa Whole-Slide Imaging Market Volume (K Unit), by End User 2025 & 2033
- Figure 61: Middle East and Africa Whole-Slide Imaging Market Revenue Share (%), by End User 2025 & 2033
- Figure 62: Middle East and Africa Whole-Slide Imaging Market Volume Share (%), by End User 2025 & 2033
- Figure 63: Middle East and Africa Whole-Slide Imaging Market Revenue (Million), by Country 2025 & 2033
- Figure 64: Middle East and Africa Whole-Slide Imaging Market Volume (K Unit), by Country 2025 & 2033
- Figure 65: Middle East and Africa Whole-Slide Imaging Market Revenue Share (%), by Country 2025 & 2033
- Figure 66: Middle East and Africa Whole-Slide Imaging Market Volume Share (%), by Country 2025 & 2033
- Figure 67: South America Whole-Slide Imaging Market Revenue (Million), by Technology 2025 & 2033
- Figure 68: South America Whole-Slide Imaging Market Volume (K Unit), by Technology 2025 & 2033
- Figure 69: South America Whole-Slide Imaging Market Revenue Share (%), by Technology 2025 & 2033
- Figure 70: South America Whole-Slide Imaging Market Volume Share (%), by Technology 2025 & 2033
- Figure 71: South America Whole-Slide Imaging Market Revenue (Million), by Application 2025 & 2033
- Figure 72: South America Whole-Slide Imaging Market Volume (K Unit), by Application 2025 & 2033
- Figure 73: South America Whole-Slide Imaging Market Revenue Share (%), by Application 2025 & 2033
- Figure 74: South America Whole-Slide Imaging Market Volume Share (%), by Application 2025 & 2033
- Figure 75: South America Whole-Slide Imaging Market Revenue (Million), by End User 2025 & 2033
- Figure 76: South America Whole-Slide Imaging Market Volume (K Unit), by End User 2025 & 2033
- Figure 77: South America Whole-Slide Imaging Market Revenue Share (%), by End User 2025 & 2033
- Figure 78: South America Whole-Slide Imaging Market Volume Share (%), by End User 2025 & 2033
- Figure 79: South America Whole-Slide Imaging Market Revenue (Million), by Country 2025 & 2033
- Figure 80: South America Whole-Slide Imaging Market Volume (K Unit), by Country 2025 & 2033
- Figure 81: South America Whole-Slide Imaging Market Revenue Share (%), by Country 2025 & 2033
- Figure 82: South America Whole-Slide Imaging Market Volume Share (%), by Country 2025 & 2033
List of Tables
- Table 1: Global Whole-Slide Imaging Market Revenue Million Forecast, by Technology 2020 & 2033
- Table 2: Global Whole-Slide Imaging Market Volume K Unit Forecast, by Technology 2020 & 2033
- Table 3: Global Whole-Slide Imaging Market Revenue Million Forecast, by Application 2020 & 2033
- Table 4: Global Whole-Slide Imaging Market Volume K Unit Forecast, by Application 2020 & 2033
- Table 5: Global Whole-Slide Imaging Market Revenue Million Forecast, by End User 2020 & 2033
- Table 6: Global Whole-Slide Imaging Market Volume K Unit Forecast, by End User 2020 & 2033
- Table 7: Global Whole-Slide Imaging Market Revenue Million Forecast, by Region 2020 & 2033
- Table 8: Global Whole-Slide Imaging Market Volume K Unit Forecast, by Region 2020 & 2033
- Table 9: Global Whole-Slide Imaging Market Revenue Million Forecast, by Technology 2020 & 2033
- Table 10: Global Whole-Slide Imaging Market Volume K Unit Forecast, by Technology 2020 & 2033
- Table 11: Global Whole-Slide Imaging Market Revenue Million Forecast, by Application 2020 & 2033
- Table 12: Global Whole-Slide Imaging Market Volume K Unit Forecast, by Application 2020 & 2033
- Table 13: Global Whole-Slide Imaging Market Revenue Million Forecast, by End User 2020 & 2033
- Table 14: Global Whole-Slide Imaging Market Volume K Unit Forecast, by End User 2020 & 2033
- Table 15: Global Whole-Slide Imaging Market Revenue Million Forecast, by Country 2020 & 2033
- Table 16: Global Whole-Slide Imaging Market Volume K Unit Forecast, by Country 2020 & 2033
- Table 17: United States Whole-Slide Imaging Market Revenue (Million) Forecast, by Application 2020 & 2033
- Table 18: United States Whole-Slide Imaging Market Volume (K Unit) Forecast, by Application 2020 & 2033
- Table 19: Canada Whole-Slide Imaging Market Revenue (Million) Forecast, by Application 2020 & 2033
- Table 20: Canada Whole-Slide Imaging Market Volume (K Unit) Forecast, by Application 2020 & 2033
- Table 21: Mexico Whole-Slide Imaging Market Revenue (Million) Forecast, by Application 2020 & 2033
- Table 22: Mexico Whole-Slide Imaging Market Volume (K Unit) Forecast, by Application 2020 & 2033
- Table 23: Global Whole-Slide Imaging Market Revenue Million Forecast, by Technology 2020 & 2033
- Table 24: Global Whole-Slide Imaging Market Volume K Unit Forecast, by Technology 2020 & 2033
- Table 25: Global Whole-Slide Imaging Market Revenue Million Forecast, by Application 2020 & 2033
- Table 26: Global Whole-Slide Imaging Market Volume K Unit Forecast, by Application 2020 & 2033
- Table 27: Global Whole-Slide Imaging Market Revenue Million Forecast, by End User 2020 & 2033
- Table 28: Global Whole-Slide Imaging Market Volume K Unit Forecast, by End User 2020 & 2033
- Table 29: Global Whole-Slide Imaging Market Revenue Million Forecast, by Country 2020 & 2033
- Table 30: Global Whole-Slide Imaging Market Volume K Unit Forecast, by Country 2020 & 2033
- Table 31: Germany Whole-Slide Imaging Market Revenue (Million) Forecast, by Application 2020 & 2033
- Table 32: Germany Whole-Slide Imaging Market Volume (K Unit) Forecast, by Application 2020 & 2033
- Table 33: United Kingdom Whole-Slide Imaging Market Revenue (Million) Forecast, by Application 2020 & 2033
- Table 34: United Kingdom Whole-Slide Imaging Market Volume (K Unit) Forecast, by Application 2020 & 2033
- Table 35: France Whole-Slide Imaging Market Revenue (Million) Forecast, by Application 2020 & 2033
- Table 36: France Whole-Slide Imaging Market Volume (K Unit) Forecast, by Application 2020 & 2033
- Table 37: Italy Whole-Slide Imaging Market Revenue (Million) Forecast, by Application 2020 & 2033
- Table 38: Italy Whole-Slide Imaging Market Volume (K Unit) Forecast, by Application 2020 & 2033
- Table 39: Spain Whole-Slide Imaging Market Revenue (Million) Forecast, by Application 2020 & 2033
- Table 40: Spain Whole-Slide Imaging Market Volume (K Unit) Forecast, by Application 2020 & 2033
- Table 41: Rest of Europe Whole-Slide Imaging Market Revenue (Million) Forecast, by Application 2020 & 2033
- Table 42: Rest of Europe Whole-Slide Imaging Market Volume (K Unit) Forecast, by Application 2020 & 2033
- Table 43: Global Whole-Slide Imaging Market Revenue Million Forecast, by Technology 2020 & 2033
- Table 44: Global Whole-Slide Imaging Market Volume K Unit Forecast, by Technology 2020 & 2033
- Table 45: Global Whole-Slide Imaging Market Revenue Million Forecast, by Application 2020 & 2033
- Table 46: Global Whole-Slide Imaging Market Volume K Unit Forecast, by Application 2020 & 2033
- Table 47: Global Whole-Slide Imaging Market Revenue Million Forecast, by End User 2020 & 2033
- Table 48: Global Whole-Slide Imaging Market Volume K Unit Forecast, by End User 2020 & 2033
- Table 49: Global Whole-Slide Imaging Market Revenue Million Forecast, by Country 2020 & 2033
- Table 50: Global Whole-Slide Imaging Market Volume K Unit Forecast, by Country 2020 & 2033
- Table 51: China Whole-Slide Imaging Market Revenue (Million) Forecast, by Application 2020 & 2033
- Table 52: China Whole-Slide Imaging Market Volume (K Unit) Forecast, by Application 2020 & 2033
- Table 53: Japan Whole-Slide Imaging Market Revenue (Million) Forecast, by Application 2020 & 2033
- Table 54: Japan Whole-Slide Imaging Market Volume (K Unit) Forecast, by Application 2020 & 2033
- Table 55: India Whole-Slide Imaging Market Revenue (Million) Forecast, by Application 2020 & 2033
- Table 56: India Whole-Slide Imaging Market Volume (K Unit) Forecast, by Application 2020 & 2033
- Table 57: Australia Whole-Slide Imaging Market Revenue (Million) Forecast, by Application 2020 & 2033
- Table 58: Australia Whole-Slide Imaging Market Volume (K Unit) Forecast, by Application 2020 & 2033
- Table 59: South korea Whole-Slide Imaging Market Revenue (Million) Forecast, by Application 2020 & 2033
- Table 60: South korea Whole-Slide Imaging Market Volume (K Unit) Forecast, by Application 2020 & 2033
- Table 61: Rest of Asia Pacific Whole-Slide Imaging Market Revenue (Million) Forecast, by Application 2020 & 2033
- Table 62: Rest of Asia Pacific Whole-Slide Imaging Market Volume (K Unit) Forecast, by Application 2020 & 2033
- Table 63: Global Whole-Slide Imaging Market Revenue Million Forecast, by Technology 2020 & 2033
- Table 64: Global Whole-Slide Imaging Market Volume K Unit Forecast, by Technology 2020 & 2033
- Table 65: Global Whole-Slide Imaging Market Revenue Million Forecast, by Application 2020 & 2033
- Table 66: Global Whole-Slide Imaging Market Volume K Unit Forecast, by Application 2020 & 2033
- Table 67: Global Whole-Slide Imaging Market Revenue Million Forecast, by End User 2020 & 2033
- Table 68: Global Whole-Slide Imaging Market Volume K Unit Forecast, by End User 2020 & 2033
- Table 69: Global Whole-Slide Imaging Market Revenue Million Forecast, by Country 2020 & 2033
- Table 70: Global Whole-Slide Imaging Market Volume K Unit Forecast, by Country 2020 & 2033
- Table 71: GCC Whole-Slide Imaging Market Revenue (Million) Forecast, by Application 2020 & 2033
- Table 72: GCC Whole-Slide Imaging Market Volume (K Unit) Forecast, by Application 2020 & 2033
- Table 73: South Africa Whole-Slide Imaging Market Revenue (Million) Forecast, by Application 2020 & 2033
- Table 74: South Africa Whole-Slide Imaging Market Volume (K Unit) Forecast, by Application 2020 & 2033
- Table 75: Rest of Middle East and Africa Whole-Slide Imaging Market Revenue (Million) Forecast, by Application 2020 & 2033
- Table 76: Rest of Middle East and Africa Whole-Slide Imaging Market Volume (K Unit) Forecast, by Application 2020 & 2033
- Table 77: Global Whole-Slide Imaging Market Revenue Million Forecast, by Technology 2020 & 2033
- Table 78: Global Whole-Slide Imaging Market Volume K Unit Forecast, by Technology 2020 & 2033
- Table 79: Global Whole-Slide Imaging Market Revenue Million Forecast, by Application 2020 & 2033
- Table 80: Global Whole-Slide Imaging Market Volume K Unit Forecast, by Application 2020 & 2033
- Table 81: Global Whole-Slide Imaging Market Revenue Million Forecast, by End User 2020 & 2033
- Table 82: Global Whole-Slide Imaging Market Volume K Unit Forecast, by End User 2020 & 2033
- Table 83: Global Whole-Slide Imaging Market Revenue Million Forecast, by Country 2020 & 2033
- Table 84: Global Whole-Slide Imaging Market Volume K Unit Forecast, by Country 2020 & 2033
- Table 85: Brazil Whole-Slide Imaging Market Revenue (Million) Forecast, by Application 2020 & 2033
- Table 86: Brazil Whole-Slide Imaging Market Volume (K Unit) Forecast, by Application 2020 & 2033
- Table 87: Argentina Whole-Slide Imaging Market Revenue (Million) Forecast, by Application 2020 & 2033
- Table 88: Argentina Whole-Slide Imaging Market Volume (K Unit) Forecast, by Application 2020 & 2033
- Table 89: Rest of South America Whole-Slide Imaging Market Revenue (Million) Forecast, by Application 2020 & 2033
- Table 90: Rest of South America Whole-Slide Imaging Market Volume (K Unit) Forecast, by Application 2020 & 2033
Frequently Asked Questions
1. What is the projected Compound Annual Growth Rate (CAGR) of the Whole-Slide Imaging Market?
The projected CAGR is approximately 6.39%.
2. Which companies are prominent players in the Whole-Slide Imaging Market?
Key companies in the market include MBF Bioscience, Hamamatsu Photonics KK, Nikon Corporation, Leica Microsystems GmbH, Koninklijke Philips N V, 3Dhistech, Visiopharm, Indica Labs, Molecular Machines & Industries, Mikroscan Technologies Inc, Olympus Corporation, Akoya Biosciences.
3. What are the main segments of the Whole-Slide Imaging Market?
The market segments include Technology, Application, End User.
4. Can you provide details about the market size?
The market size is estimated to be USD 1.21 Million as of 2022.
5. What are some drivers contributing to market growth?
Growing Popularity of Virtual Slides as Compared to Physical Slides; Technological Advancements in Whole Slide Imaging; Increasing Research in Drug Discovery.
6. What are the notable trends driving market growth?
Telepathology Segment is Expected to Grow Significantly Over the Forecast Period.
7. Are there any restraints impacting market growth?
Stringent Regulatory Approvals; High Cost of Whole Slide Imaging Systems.
8. Can you provide examples of recent developments in the market?
March 2023: Pramana, Inc., an AI-enabled health tech company modernizing the pathology sector, collaborated with PathPresenter to accelerate the enterprise adoption of digital pathology workflows. The goal of this collaboration is to ensure a seamless user experience for the labs adopting Pramana's Digital Pathology as a Service solution for whole slide image generation, as well as PathPresenter's image management/image viewing platform.
9. What pricing options are available for accessing the report?
Pricing options include single-user, multi-user, and enterprise licenses priced at USD 4750, USD 5250, and USD 8750 respectively.
10. Is the market size provided in terms of value or volume?
The market size is provided in terms of value, measured in Million and volume, measured in K Unit.
11. Are there any specific market keywords associated with the report?
Yes, the market keyword associated with the report is "Whole-Slide Imaging Market," which aids in identifying and referencing the specific market segment covered.
12. How do I determine which pricing option suits my needs best?
The pricing options vary based on user requirements and access needs. Individual users may opt for single-user licenses, while businesses requiring broader access may choose multi-user or enterprise licenses for cost-effective access to the report.
13. Are there any additional resources or data provided in the Whole-Slide Imaging Market report?
While the report offers comprehensive insights, it's advisable to review the specific contents or supplementary materials provided to ascertain if additional resources or data are available.
14. How can I stay updated on further developments or reports in the Whole-Slide Imaging Market?
To stay informed about further developments, trends, and reports in the Whole-Slide Imaging Market, consider subscribing to industry newsletters, following relevant companies and organizations, or regularly checking reputable industry news sources and publications.
Methodology
Step 1 - Identification of Relevant Samples Size from Population Database


Step 2 - Approaches for Defining Global Market Size (Value, Volume* & Price*)

Note*: In applicable scenarios
Step 3 - Data Sources
Primary Research
- Web Analytics
- Survey Reports
- Research Institute
- Latest Research Reports
- Opinion Leaders
Secondary Research
- Annual Reports
- White Paper
- Latest Press Release
- Industry Association
- Paid Database
- Investor Presentations

Step 4 - Data Triangulation
Involves using different sources of information in order to increase the validity of a study
These sources are likely to be stakeholders in a program - participants, other researchers, program staff, other community members, and so on.
Then we put all data in single framework & apply various statistical tools to find out the dynamic on the market.
During the analysis stage, feedback from the stakeholder groups would be compared to determine areas of agreement as well as areas of divergence